H1. Narrowing the Monitored Target (Group, Host, Instance)
Diátaxis: How-to · Audience: operators ← Back to contents
A chart on the screen only means something once "whose data is this" is settled. This document sets out, by goal, how to narrow the scope you want with the context selector at the top of the main area.
For the concept of "what a group, instance, and agent are", see E2.1; for the other common tools such as dates and themes, see R4. Common UI Elements.
Where the Selector Is
On most screens it is at the very top of the main area (below the header). It is a set of dropdowns narrowing the scope from left to right in the order group → host → instance. Below is the WAS › Application screen as an example, with the selector to the right of the screen title.
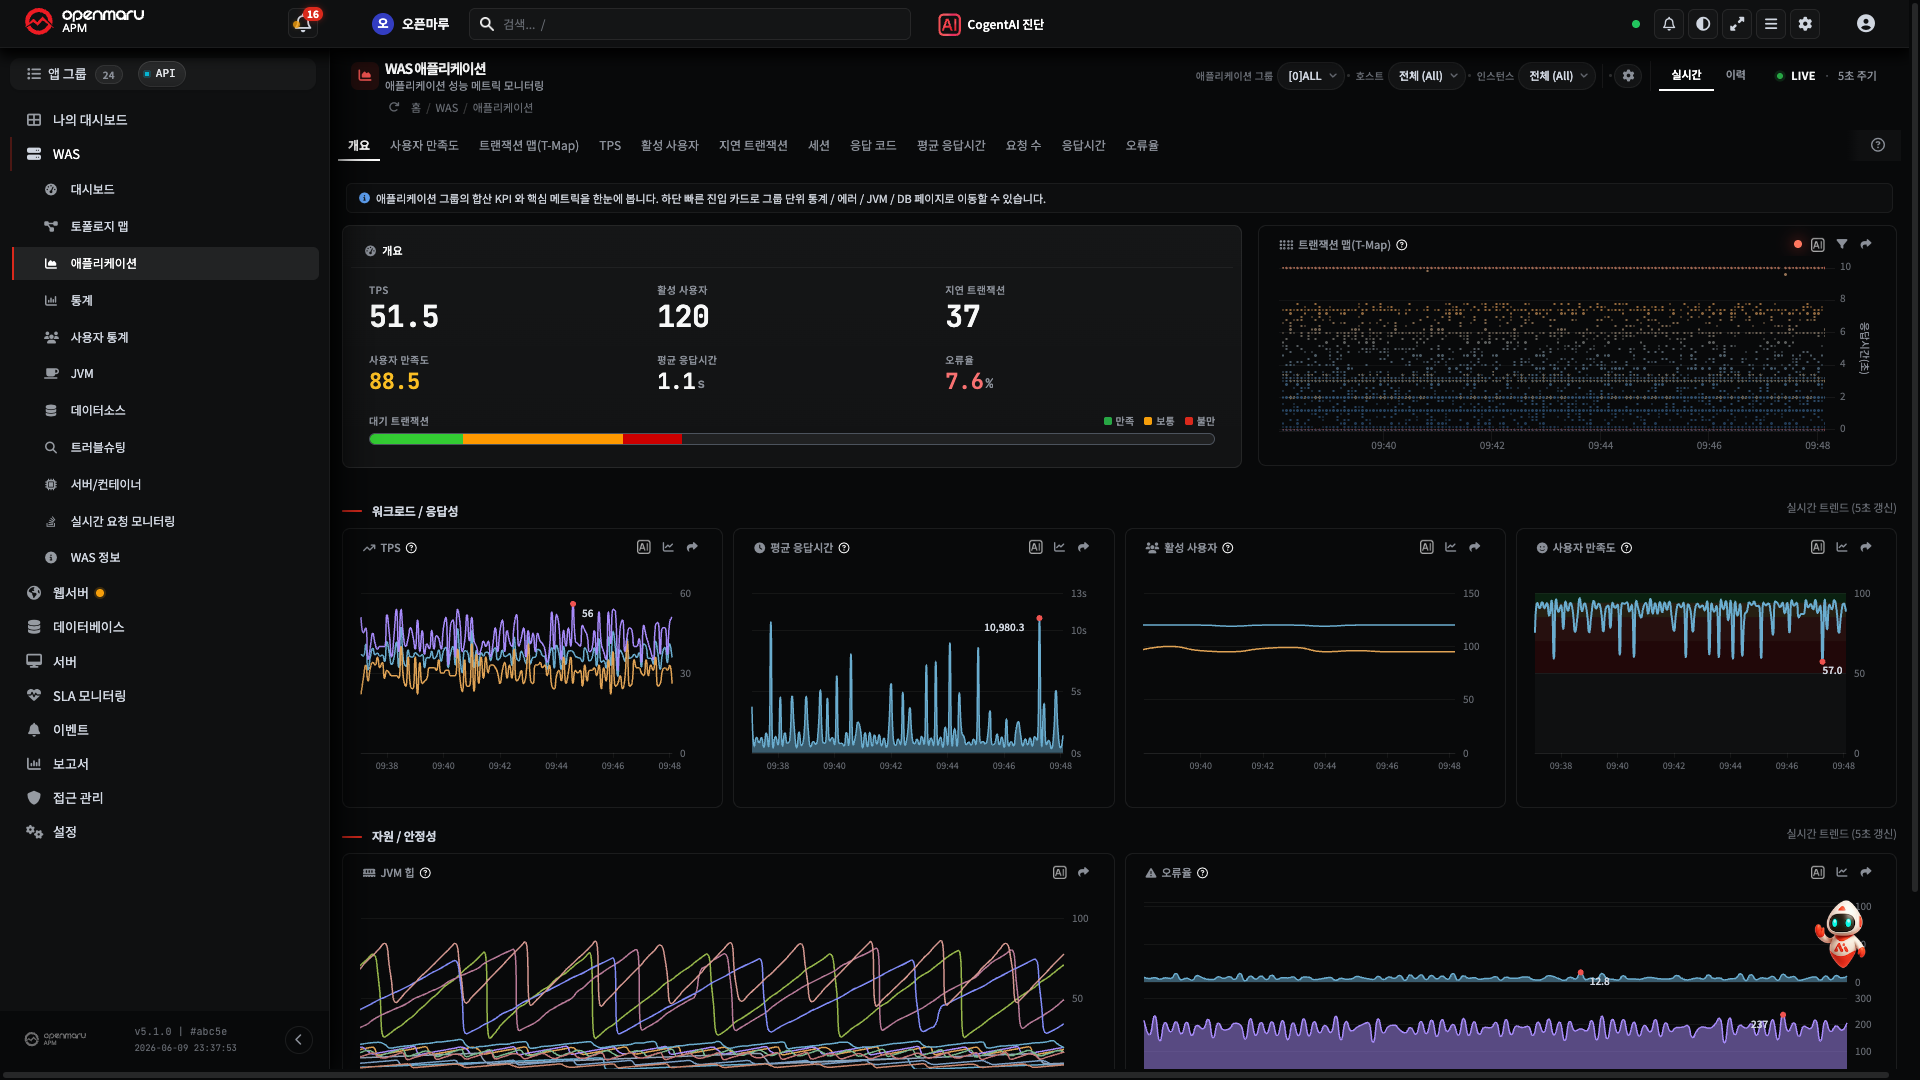
The levels shown differ by screen. The WAS family usually starts from the group, and the server and web families from the host. A level that is not shown has no meaning on that screen and is hidden.
Goal 1 — Seeing a Whole Service (Group)
The most common case. The instances of one service are bundled and seen as totals and averages.
- Open the group dropdown.
- Choose the application group you want to see.
- Leaving the lower levels (host, instance) as they are makes the whole group the target.
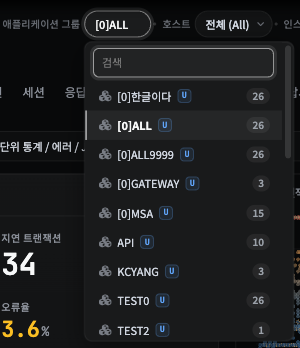
Result -- the data of every instance in the group is reflected in the charts.
Goal 2 — Narrowing to One Particular Instance
When you think "one particular machine looks like the problem", reduce the scope to one instance.
- Choose the group first.
- Choose that server (host) in the host dropdown.
- Choose one particular instance in the instance dropdown.
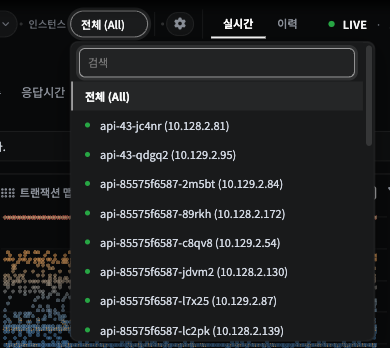
Result -- only that instance's data is shown. To go back to the whole group, set the host and instance back to All.
Goal 3 — Knowing What "All" Means
Each dropdown has an All option (every target at that level).
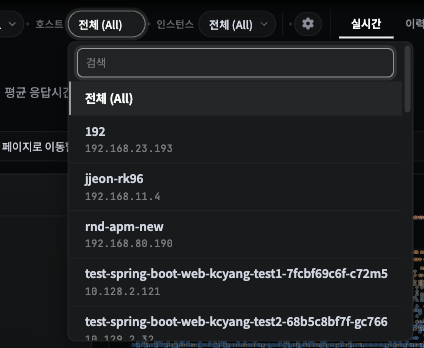
- Instance = All → every instance of the host (or group) chosen above is the target
- Host = All → every host in the group is the target
- In other words, the more lower levels are left at "All", the wider the scope.
Note Changing an upper level (the group) refills the lower levels (host, instance) to match that group. That is why choosing from the top down always feels natural.
Goal 4 — Combining Several Machines or Splitting Them (Merge)
Inside the cog options to the right of the selector is a Merge checkbox. It decides how several selected targets are drawn on the screen.
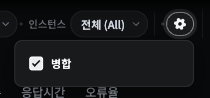
- Merge on (default): the several selected instances are combined into one and seen as a single line -- good for seeing the trend of the whole service.
- Merge off: the instances are split out individually into several lines -- good for comparing whether one machine is out of line.
Result -- switch merge on when you want "the overall trend", and off when you want "a comparison between machines".
When It Does Not Work (the Chart Is Empty)
| Symptom | What to check |
|---|---|
| The chart is empty | Check a group or target is selected. If a lower level is narrowed wrongly, set it back to All |
| Only one instance is empty | Whether an agent is connected on that instance → H20. Checking Agent Status |
| The past shows but now is empty | Whether the period is fixed in the past → H2. Changing the Period |
Related Documents
- The concept -- E2.1 Application Groups, Instances, and Agents
- Creating a group yourself (administrators) -- H19. Application Groups
- The other common tools -- R4. Common UI Elements · the whole menu, R1. Screen Map