R4. Common UI Elements Reference
Diátaxis: Reference (a dictionary to look things up in) · Audience: operators / administrators ← Back to contents
This sets out the position and behaviour of the UI elements that appear on almost every screen. Individual usage links to the relevant how-to.
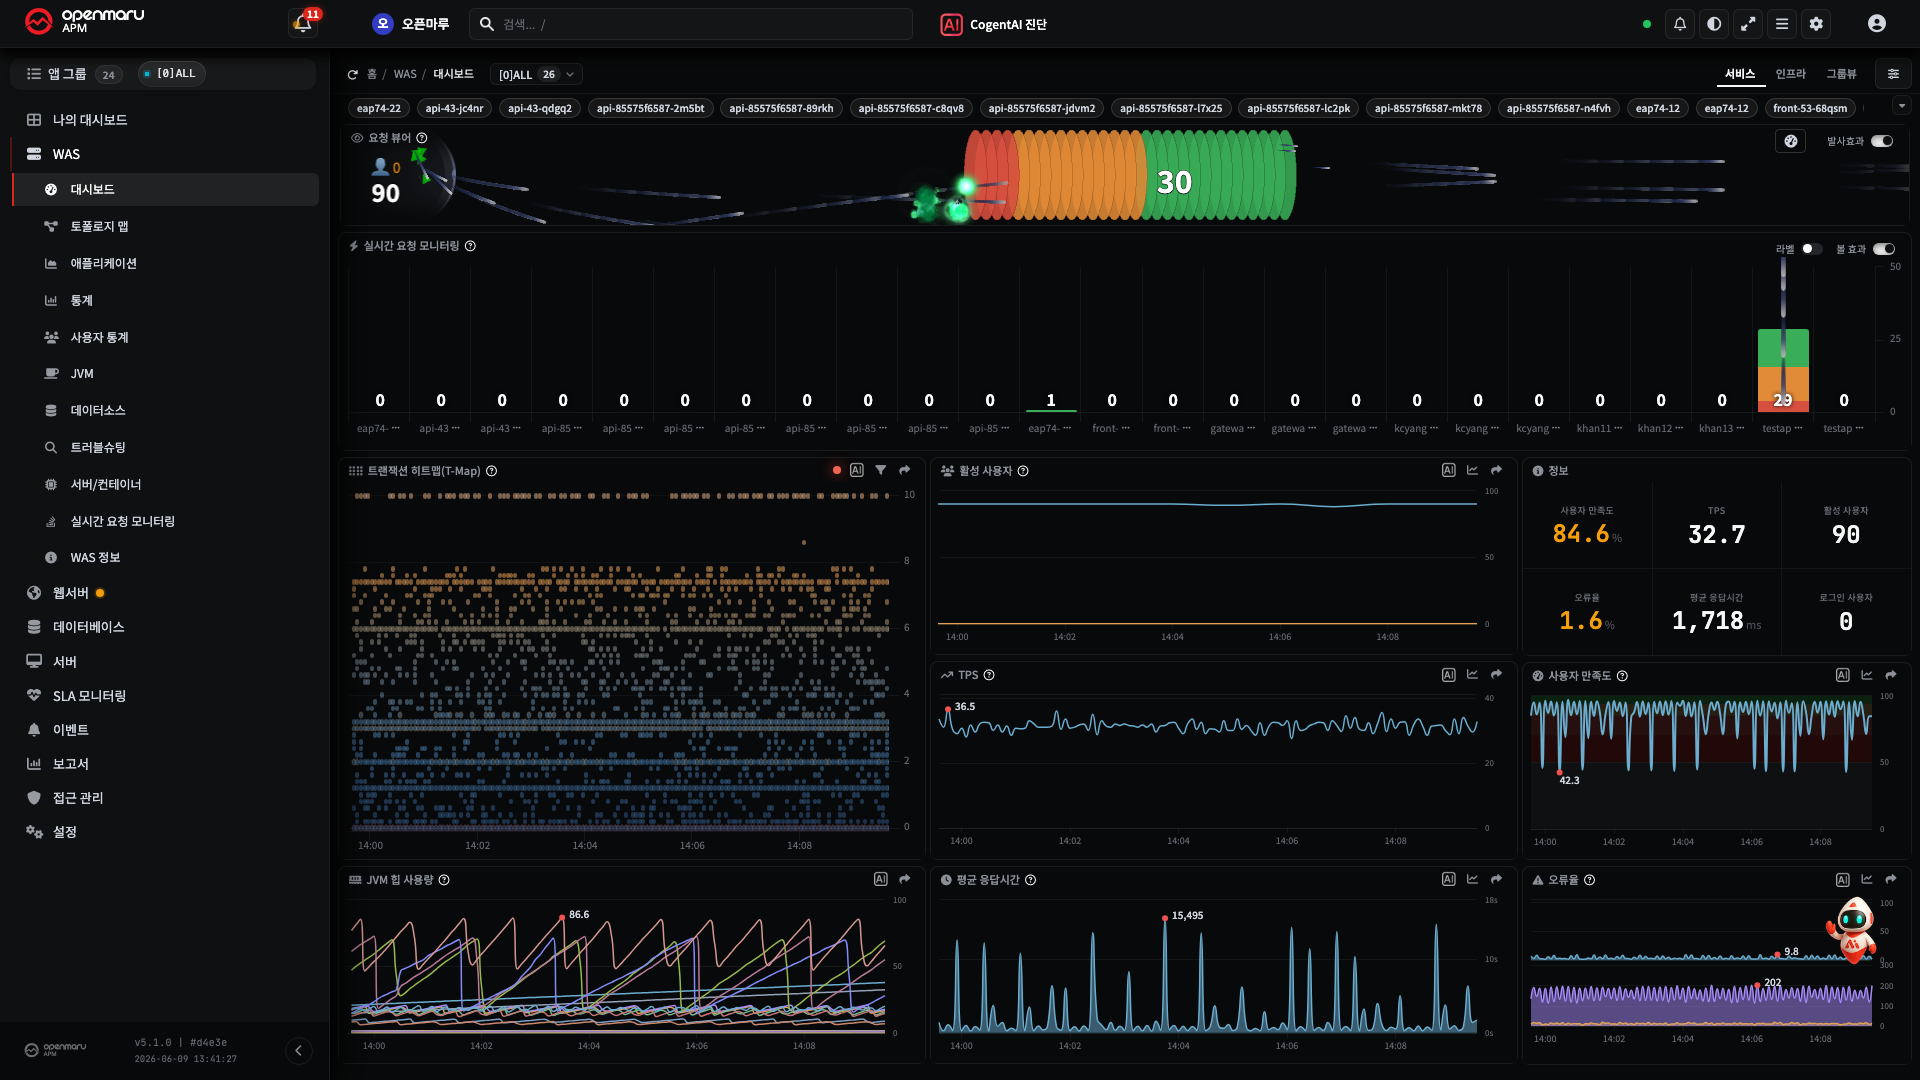
Broadly, a screen consists of the top header (global tools) + the left menu (moving between screens) + the tool row at the top of the main area (the target and period selectors) + the main area (charts).
The Context Selector (Group, Host, Instance)
Position -- at the very top of the main area (below the header). Dropdowns that narrow the scope in the order group → host → instance.

| Element | Behaviour |
|---|---|
| Group | Selects the application group (service) |
| Host | Selects a particular server within the group (All is possible) |
| Instance | Selects a particular process within the host (All is possible) |
| Merge | Whether to combine several targets into one (on) or split them out individually (off) |
- The levels shown differ by screen (the WAS family starts at group; the server and web families start at host).
- Changing an upper level refills the lower levels to match -- choose from the top down.
Usage: H1. Narrowing the Monitored Target · concept: E2.1 · creating a group: H19
The Date and Time Picker
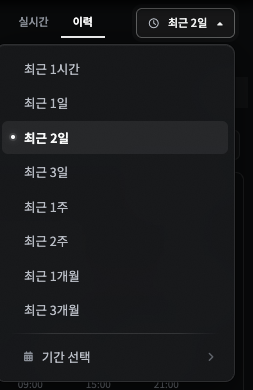
Position -- beside the target selector. A time mode tab + a period picker. (The example below is the WAS ▸ Application ▸ Overview screen.)
| Mode | What it shows |
|---|---|
| Real time | Now (refreshes automatically about every 5 seconds) |
| History | The past interval you specify |
| Daily | By the day -- provided only on the T-Map screen |
Note As in the example above (Application Overview), most screens have two time modes, real time and history. The daily mode is currently provided only on the WAS ▸ Application ▸ Transaction Map (T-Map) tab -- the daily tab does not appear on the other screens (Overview, JVM, Dashboard, and so on) (H2).
- Quick ranges: the last 1 hour / 1, 2, 3 days / 1, 2 weeks / 1, 3 months.
- Custom: enter the start and end date and time to the minute, then search.
- Dates and times are based on the user profile time zone plus the server time (unrelated to the PC clock).
Usage: H2. Changing the Period
Global Search (/)
Position -- the search box in the top header (placeholder Search... /).
- Finds menus and screens by name for quick navigation.
- Pressing
/on the keyboard focuses the search box straight away (when you are not typing). - It closes when the search term is cleared or you click outside it.
Switching the Theme (Dark/Light)
Position -- the theme toggle in the top header, or the Preferences (cog) menu in the header.
- Clicking it switches the appearance dark ↔ light ("Switches between the dark and light theme").
- The choice is kept and applies on the next visit.
- Opening the Preferences menu in the header also allows adjusting display options alongside the theme (dark/light) -- showing stopped instances, abbreviating instance names -- as well as instance sorting and the traffic visual intensity.
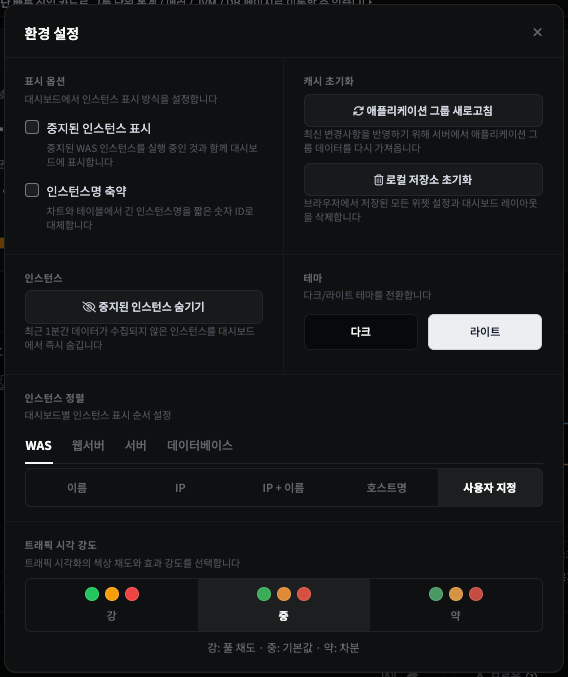
The captures in this manual use the dark theme by default. Every screen behaves the same in light.
Changing the Language
Position -- click the profile at the far right of the top header ▸ Language.
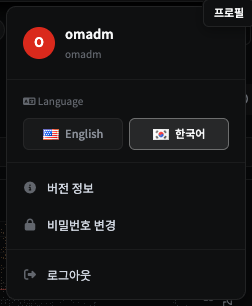
- Switch with the English / 한국어 flag buttons under Language in the profile menu.
- Menus, labels, and event messages appear in the chosen language.
- The same menu also offers version information, changing the password, and signing out.
- The Excel report language and the alert message language are configured separately (Settings → R6).
The Header
The global tools in the top header (TopBar), left to right (only some may be visible, depending on the environment and permissions).
| Element | Description |
|---|---|
| Logo | The OPENMARU APM brand / home |
| Global search | Searching menus and screens (/) |
| AI Diagnose (CogentAI) | Diagnoses the whole selected application group with AI → H14 (shown when an administrator has configured it) |
| Alert bell | The collection of push alerts. Critical/warning/information count badges, and a Mute tab → H16 |
| Theme toggle | Switching dark/light |
| Full screen | Puts the browser into full-screen mode |
| TV wallboard | Opens the monitoring status in a new window, on a screen built for TVs and large monitors. It sits next to the full-screen button and is visible on every screen. Pressed on a screen under Server in the left menu, it opens the server view; pressed anywhere else, it opens the application view. The application view carries over the application group you are currently viewing → H21 |
| User menu | Profile (time zone and so on), signing out |
Note The TV wallboard opens as a pop-up window. If your browser blocks pop-ups, it opens in a new tab instead. It opens with a view value in the address (
?view=sysor?view=app), and that value wins over the view saved in the wallboard. So even if you switched the wallboard to the server view, pressing the icon outside the Server menu opens the application view. To leave it up on an unattended TV, start the browser in kiosk mode (--kioskor--app=<address>) so the screen is filled without an address bar.
Related Documents
- H1. Narrowing the Monitored Target · H2. Changing the Period · H4. Chart Controls
- R1. Screen Map -- the whole left menu
- R6. Settings Reference -- environment settings such as language and reports
- E2.1 Application Groups, Instances, and Agents