H6. Finding the Cause of a Slow Transaction — the 20 Problem Patterns
Diátaxis: How-to · Audience: operators / developers ← Back to contents
If you can tell that a transaction is slow but not where the time went, this is the document. The Performance Analysis tab of the transaction detail automatically classifies slow or abnormal causes into 20 problem patterns and shows them as cards. Instead of scanning a waterfall in time order, looking at the patterns makes the cause visible at once. This document sets out what each card means, what to check, and what to do.
If transaction tracing is new to you, follow T2. Tracing One Slow Request All the Way first. Slow SQL can be analysed right down to the execution plan with the AI Query Diagnosis in T3. Analysing a Cause with AI. For the response distribution pattern of the service as a whole, see H5. Diagnosing with T-Map Patterns.
How to open it -- the Transaction Heatmap (T-Map) widget on the WAS ▸ Dashboard → drag the band where the upper (slow) dots gather → click a transaction in the list → the Performance Analysis tab. (The same T-Map is also on the WAS ▸ Application ▸ Transaction Map tab.)
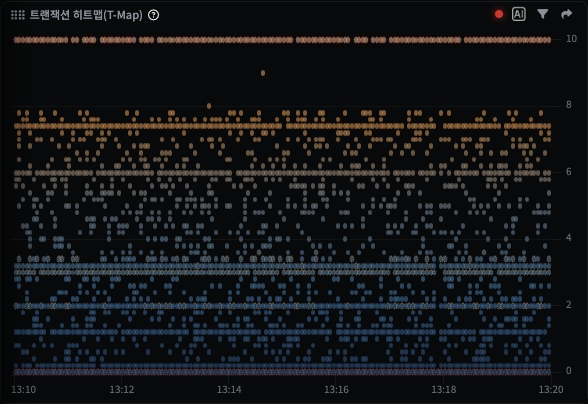
Dragging opens the transaction search list for that band -- the time range and response time range you dragged appear in the header, and you can work down the list from the rows with the largest (slowest) response time.

You can also skip the T-Map and click a row with a large response time directly in the WAS ▸ Transactions (slowest transactions) list.
Whichever route you take, clicking a transaction opens the detail dialog, with the problem detection cards at the top of the Performance Analysis tab (or "No problem detected" when no pattern was found).
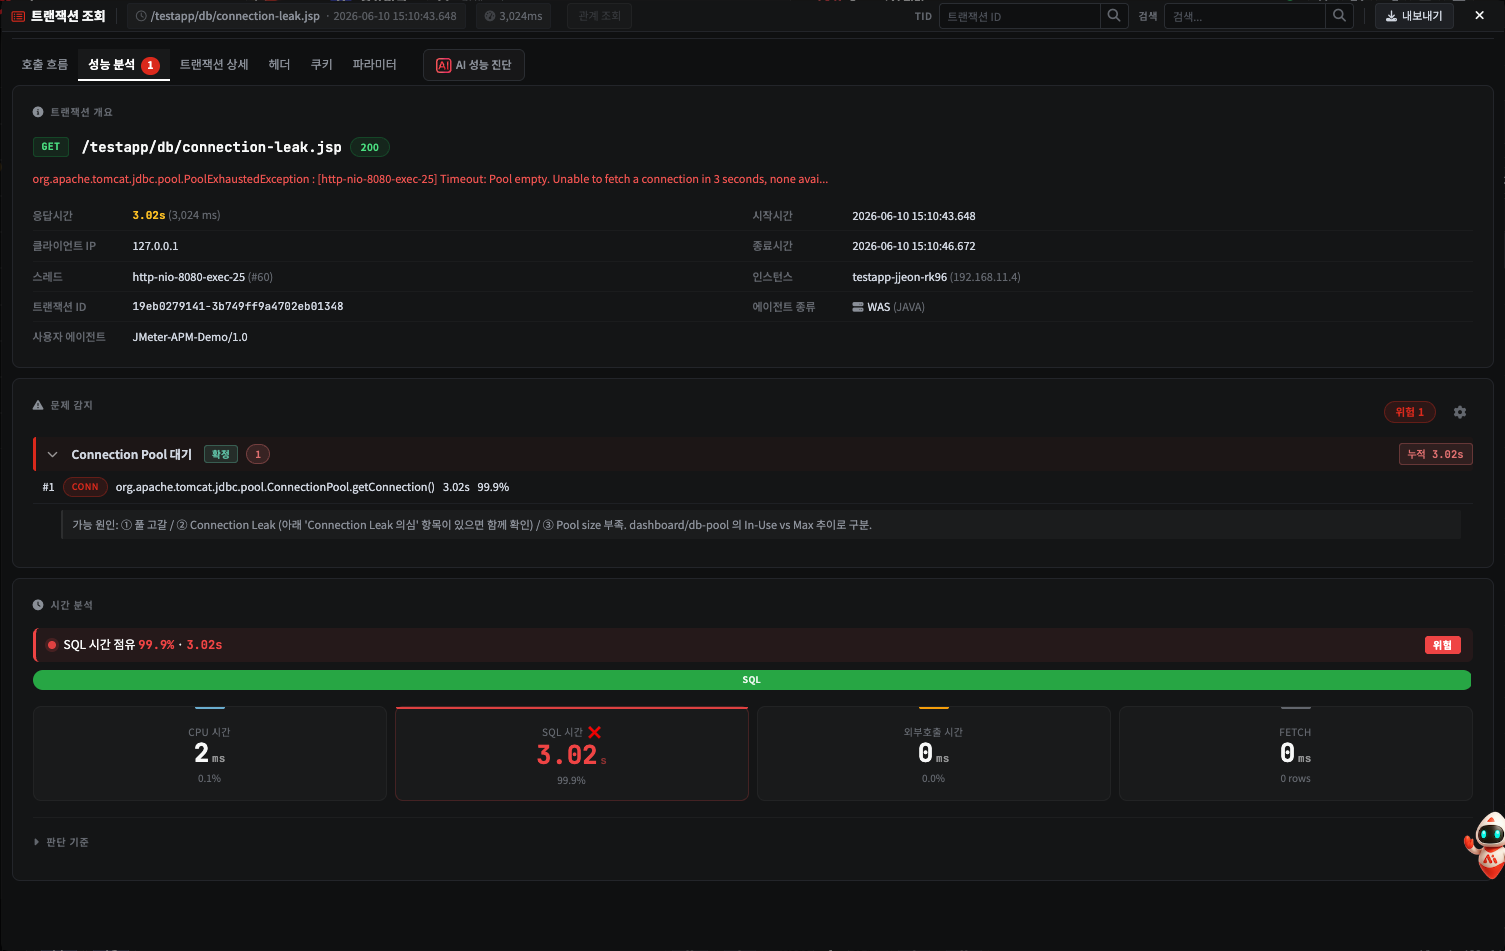
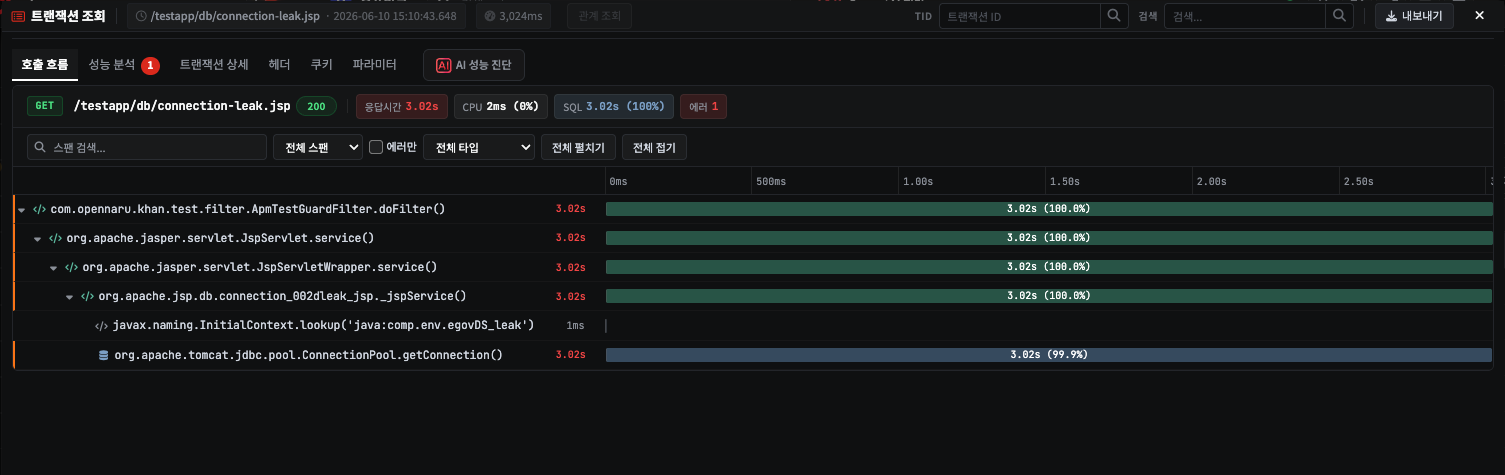
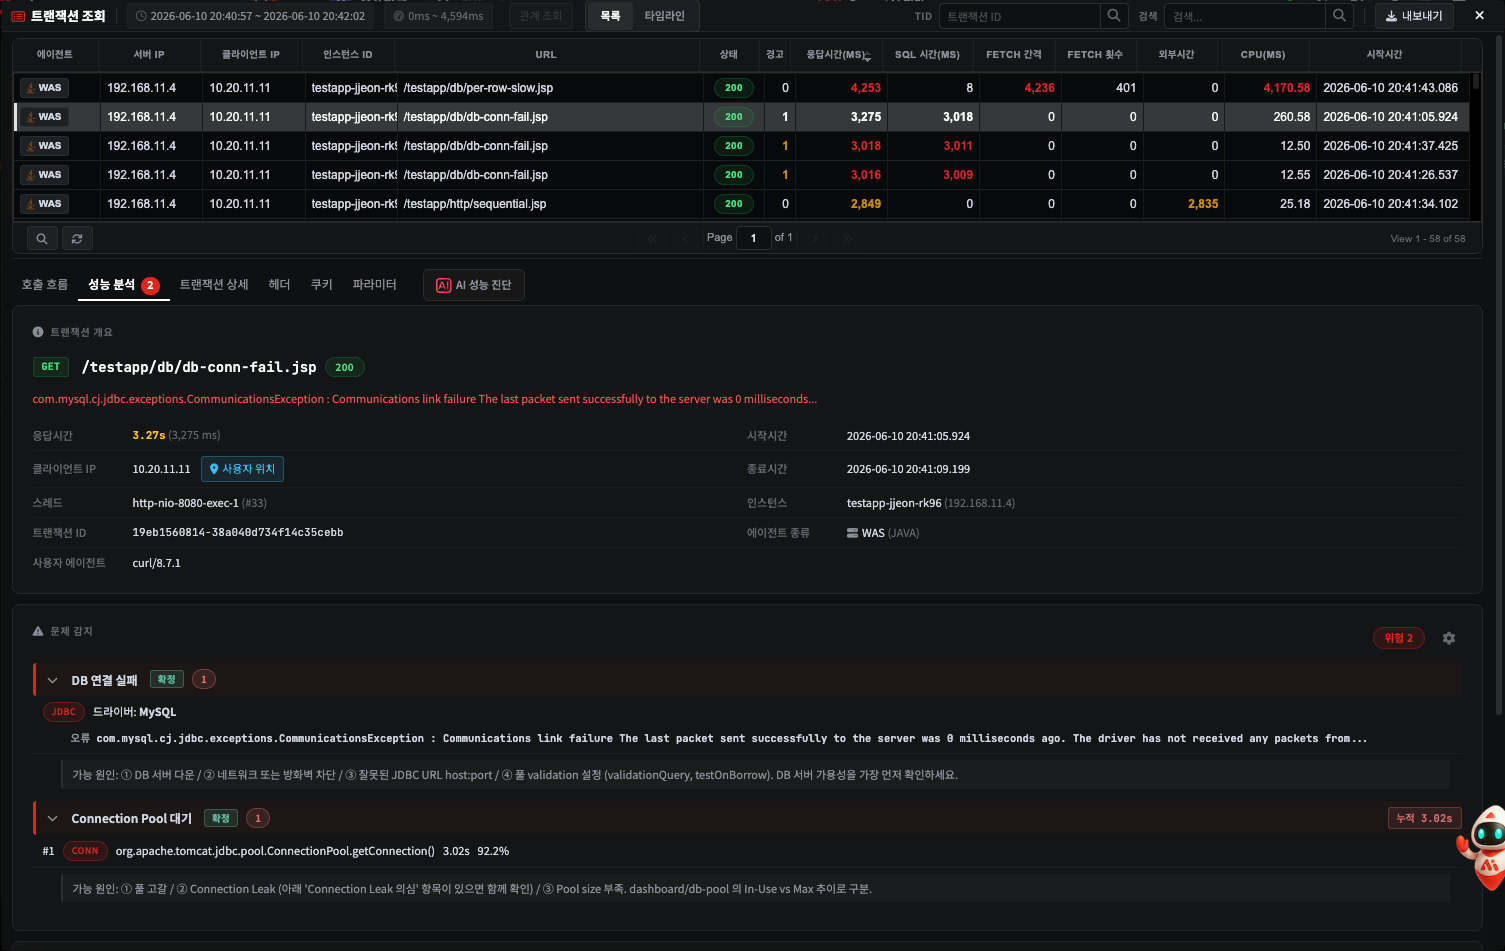
Clicking a card switches to the Call Flow tab (the waterfall) with that pattern's span
highlighted. In the example below, the single line ConnectionPool.getConnection() taking the whole
time (3.02 seconds) shows up as a bar -- the SQL is not slow; all the time went on borrowing a
connection.
Setting Priority by Card Colour
Problem patterns are colour-classified into three tiers. Decide where to start from the card colour alone.
| Tier | Colour | Meaning | Patterns |
|---|---|---|---|
| Tier 1 | Red | Act now -- direct user impact / infrastructure blocked / data integrity | 8 |
| Tier 2 | Orange | Look deeper -- degraded performance, resolvable by a code change | 5 |
| Tier 3 | Grey · blue | Analysis information -- a latent risk or a supporting signal | 6 |
Key point Start at Tier 1. With no Tier 1, go down to Tier 2; with no Tier 2 either, go down to Tier 3.
The 20 Patterns at a Glance
| # | Pattern shape | Title · one-line meaning |
|---|---|---|
| Tier 1 | Red — act now | |
| 1 | 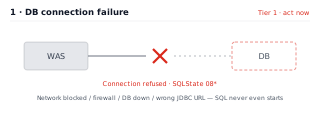 | DB connection failure -- the JDBC driver cannot reach the DB (network / firewall / DB down) |
| 2 | 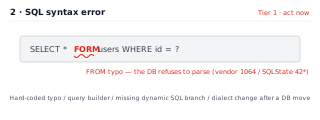 | SQL syntax error -- the SQL statement itself will not parse (fix the code) |
| 3 | 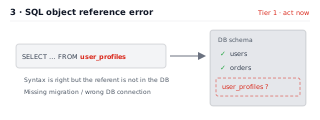 | SQL object reference error -- no such column or table (a missing migration / an ORM mapping) |
| 4 | 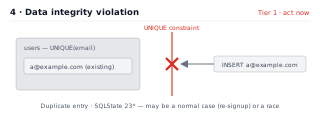 | Data integrity violation -- a unique / FK / not-null / check violation (validation / a race) |
| 5 | 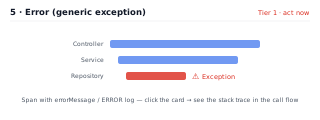 | Error -- a generic exception or an ERROR log |
| 6 | 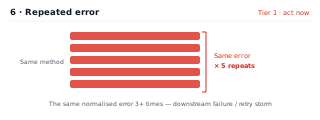 | Repeated error -- the same error 3 or more times (a downstream failure / a retry storm) |
| 7 | 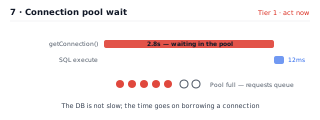 | Connection pool wait -- waiting in getConnection() -- a leak or too small a pool ★ |
| 8 | 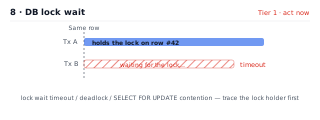 | DB lock wait -- SQL lock contention / a deadlock / SELECT FOR UPDATE |
| Tier 2 | Orange — look deeper | |
| 9 | 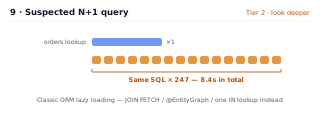 | Suspected N+1 query -- the same SQL repeated 5 or more times (ORM lazy loading) |
| 10 | 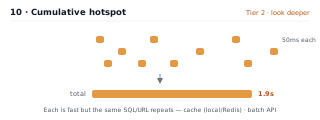 | Cumulative hotspot -- a large cumulative time for the same SQL or URL |
| 11 | 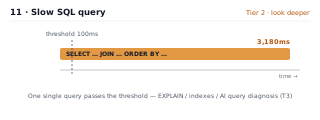 | Slow SQL query -- a single query over 100 ms (indexes / the execution plan) |
| 12 | 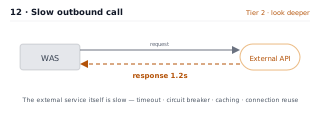 | Slow outbound call -- a single outbound call over 200 ms |
| 13 | 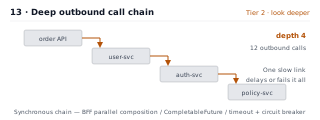 | Deep outbound call chain -- outbound depth 3+ or 10+ calls |
| 20 | 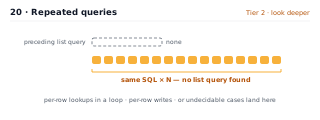 | Repeated queries -- the same SQL 5+ times, but no preceding list lookup was found |
| Tier 3 | Grey · blue — analysis information | |
| 14 | 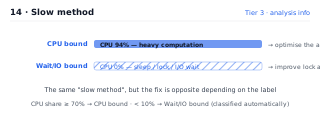 | Slow method -- automatically classified as CPU bound or Wait/IO bound |
| 15 | 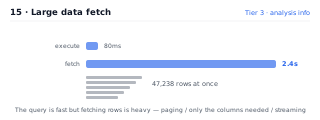 | Large data fetch -- 1,000 rows or more with fetch time > execution time |
| 16 | 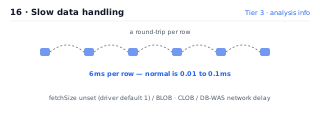 | Slow data handling -- 1 ms or more of fetch per row (fetchSize unset) |
| 17 | 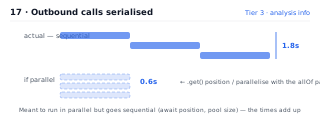 | Outbound calls serialised -- meant to be parallel but run sequentially |
| 18 | 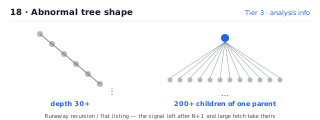 | Abnormal tree shape -- call depth 30+ or 200+ children of one parent |
| 19 | 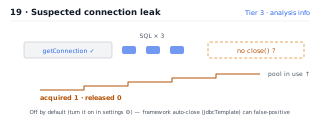 | Suspected connection leak -- 1 acquired, 0 released ★ (off by default, turned on in settings) |
The number (#) is the same as the number in the pattern details below. The badge at the top right of each diagram is the tier (the colour priority).
Pattern 20 was added later, so its number comes last while its place is in Tier 2 -- it was appended to keep the existing numbers 1 to 19 unchanged.
★ Patterns 7 and 19 often appear together -- the cause (19) and the effect (7) of a leak. When both appear, suspect a leak strongly.
Tier 1 — Red: Act Now
1. DB Connection Failure
The DB server itself cannot be reached, so SQL execution never even started. Connection failure
exceptions per driver (MySQL CommunicationsException, ORA-12541, and the like), SQLState 08*,
and messages such as "Connection refused" are recognised automatically (MySQL · MariaDB · Oracle ·
PostgreSQL · MS SQL Server · CUBRID · DB2 supported).
- Cause -- the DB is down or restarting / the network or firewall blocks it / a wrong JDBC URL / pool validation failing
- What to do -- check that instance's state on the DBMS dashboard → confirm reachability from
the WAS host with
nc -zv host port→ verify the JDBC URL (host · port · SID) and the firewall rules. If the DB is down, restart it at once.
The distinction This differs from pattern 7 (Connection Pool wait) -- this pattern is the state of not reaching the DB at all, while pattern 7 is the state where the DB is fine but the wait is in the pool inside the application.
2. SQL Syntax Error
The SQL syntax is wrong and the DB could not even parse the query. It is classified by the vendor
code the DB returns (MySQL 1064, the ORA-00936 family, SQLState 42*).
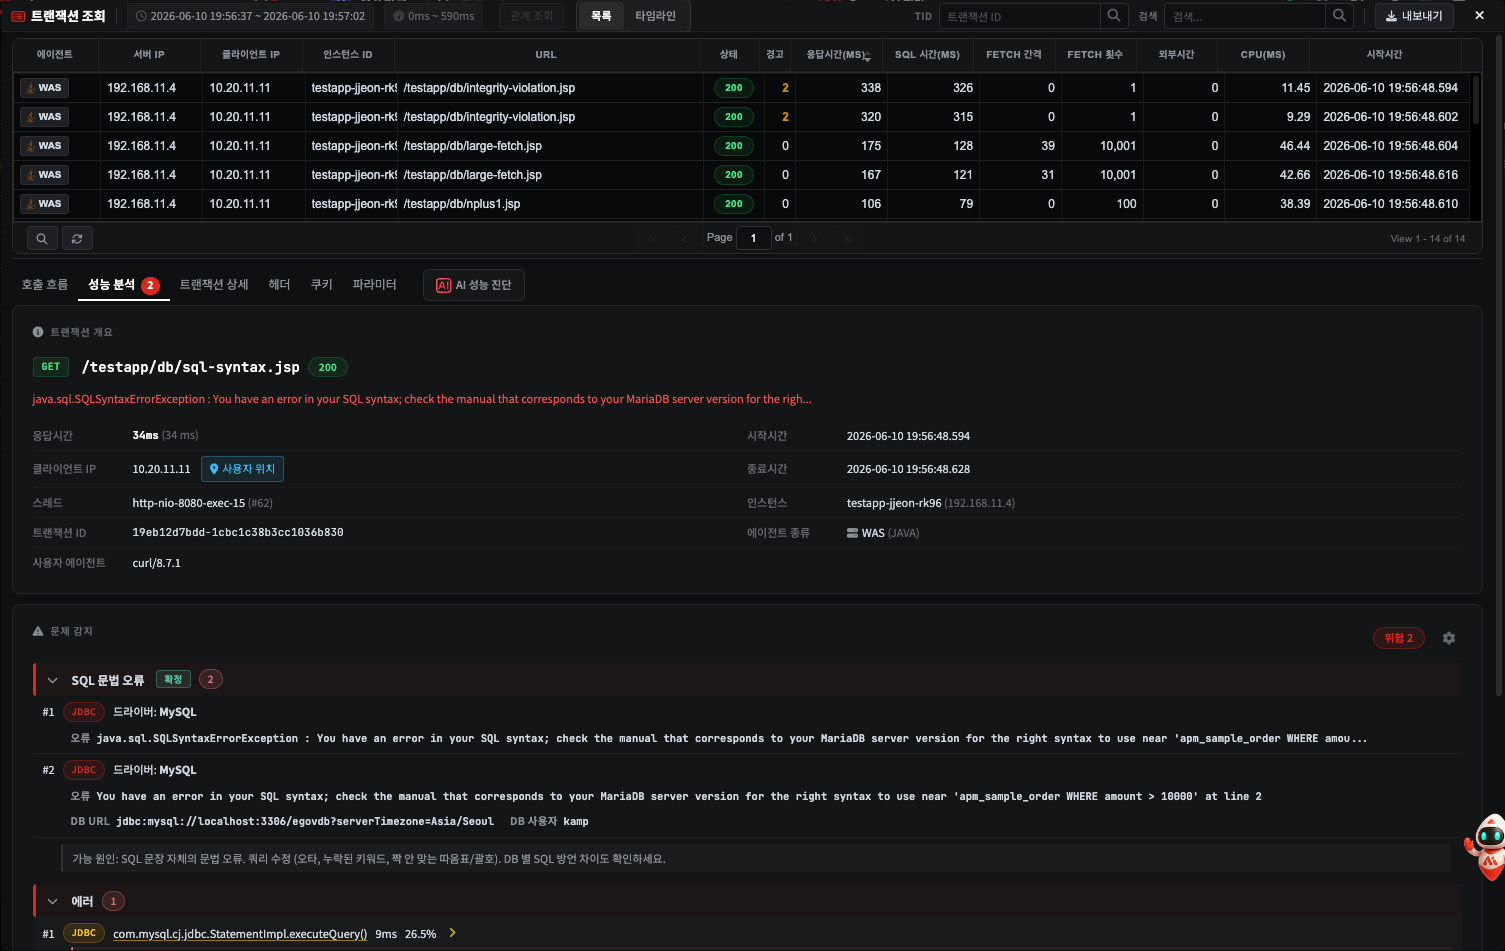
- Cause -- a typo in hard-coded SQL / a wrong combination from a query builder / a missing branch in dynamic SQL conditions / a dialect difference after a DB move
- What to do -- look at the
near '...'position in the error message, fix the query or code, and redeploy. Suspect a regression if it is right after a recent deployment.
3. SQL Object Reference Error
The syntax is right but the column or table referenced is not in the DB schema (MySQL
1054/1146, ORA-00904/ORA-00942, SQLState 42703/42P01, and so on).
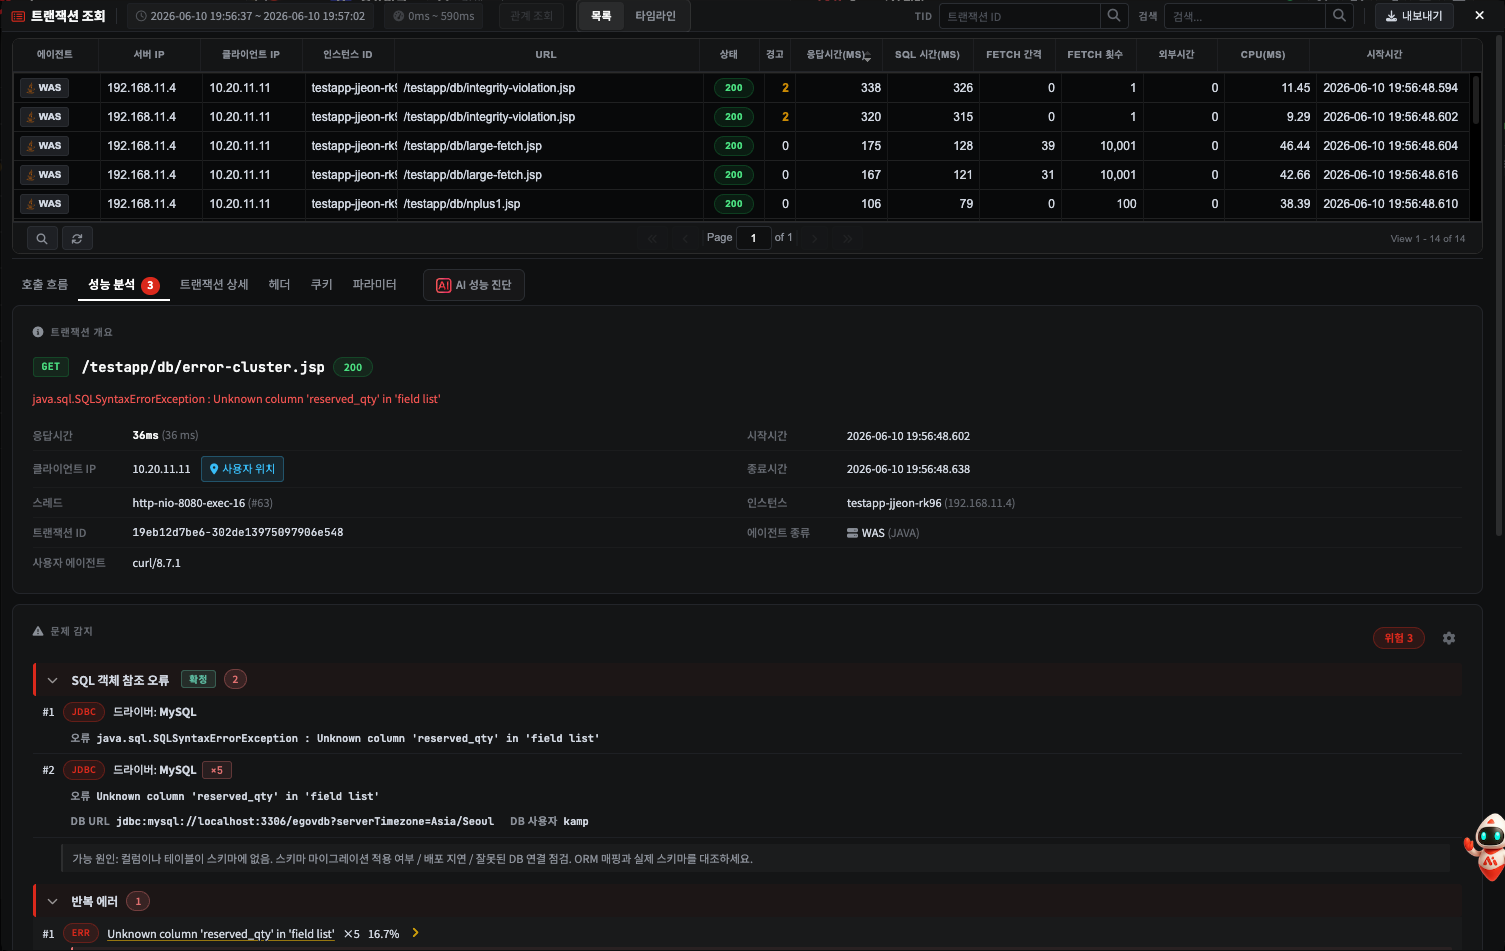
- Cause -- a missing schema migration (the most common) / connected to the wrong DB (staging against production) / the ORM mapping not updated after a rename / a missing schema prefix
- What to do -- compare the production DB's actual schema (
SHOW TABLES,DESC) with the ORM mapping → apply the migration at once if one is missing, or correct the DataSource setting if the connection is wrong.
4. Data Integrity Violation
An INSERT or UPDATE was refused by a unique · FK · not-null · check constraint (SQLState 23*,
MySQL 1062, and the like).
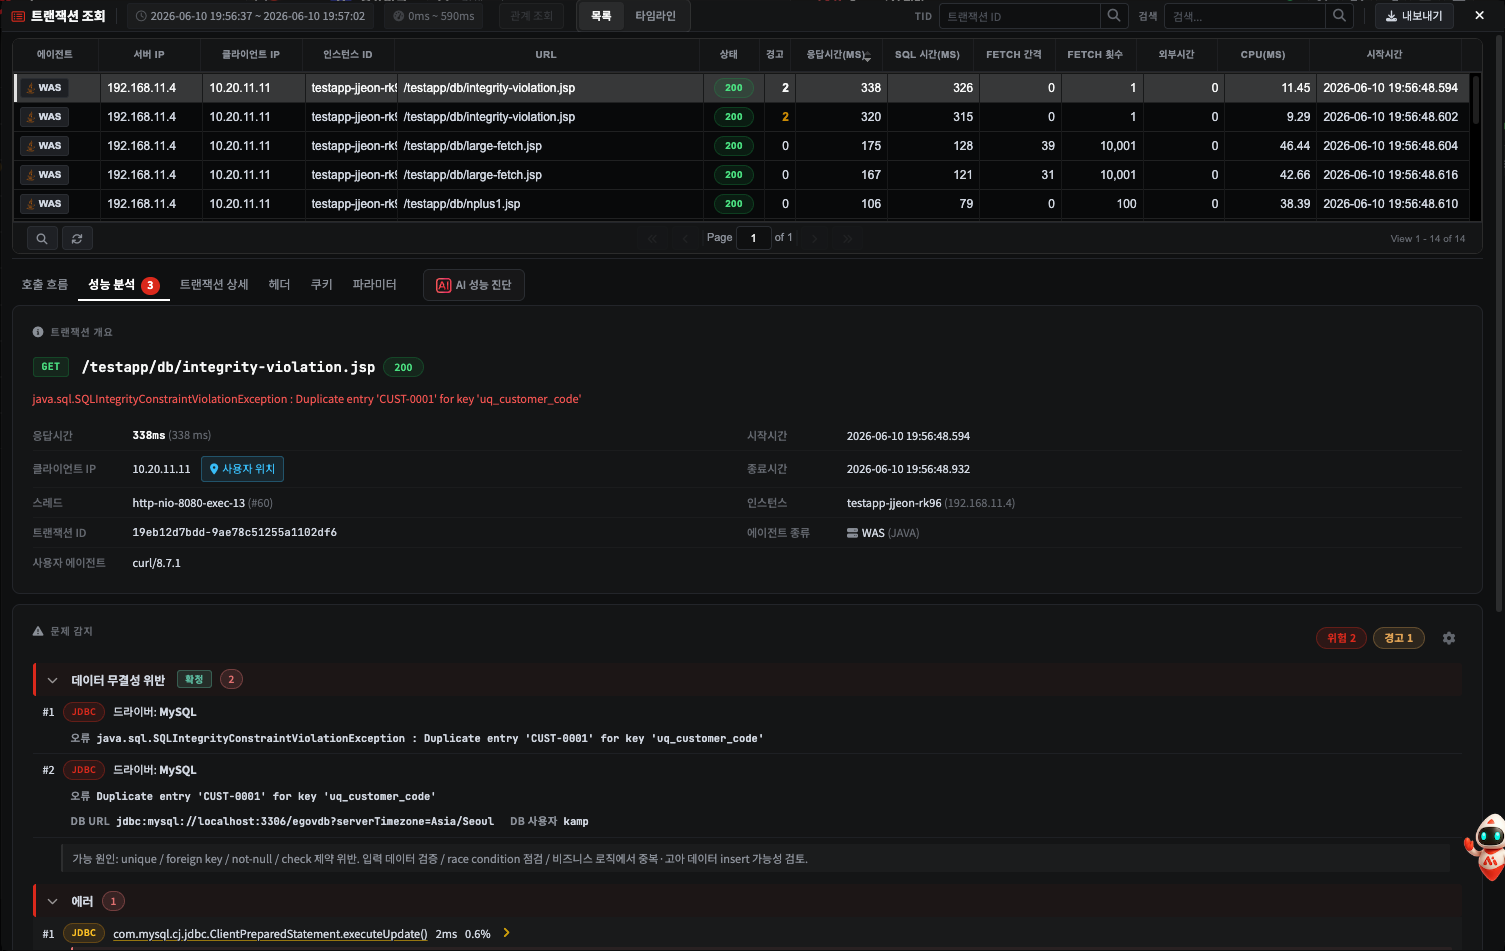
- Cause -- a duplicate-key INSERT (which may well be a normal case, such as a user who has already signed up) / a child INSERT with no parent / a null value / a race where two transactions write the same key at once
- What to do -- tell a normal case from a bug by the constraint name and column in the message →
if it is a normal case, add up-front validation and a courteous user message; if a race is
suspected, use
INSERT ... ON CONFLICT(orINSERT IGNORE) or an explicit lock.
5. Error
A generic exception or ERROR log that does not fall under the patterns above. It shows when the span has an errorMessage or the log level is ERROR/CRITICAL.
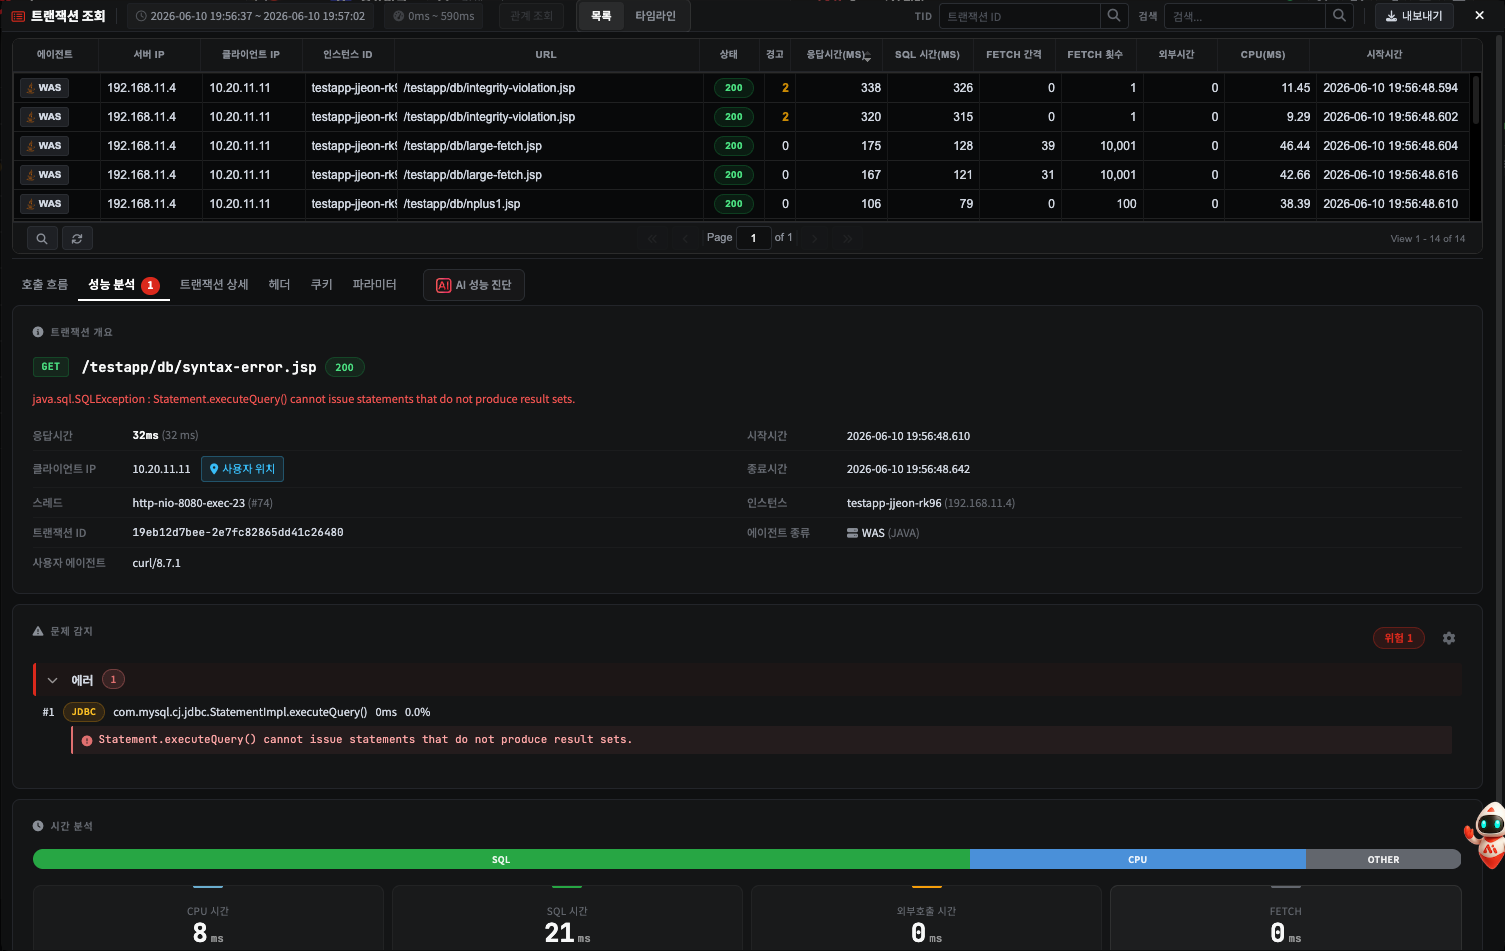
- What to check -- click the card and look at that span's stack trace, SQL, and parameters on the Call Flow tab. If the same error repeats, it is also grouped as pattern 6 (Repeated error).
- What to do -- reproduce it from the errorMessage and the parameters → check the logic, such as handling of empty results or nulls. Suspect a regression right after a deployment, and roll back where needed.
6. Repeated Error
The same error (exception class plus normalised message) repeated 3 or more times within one transaction.
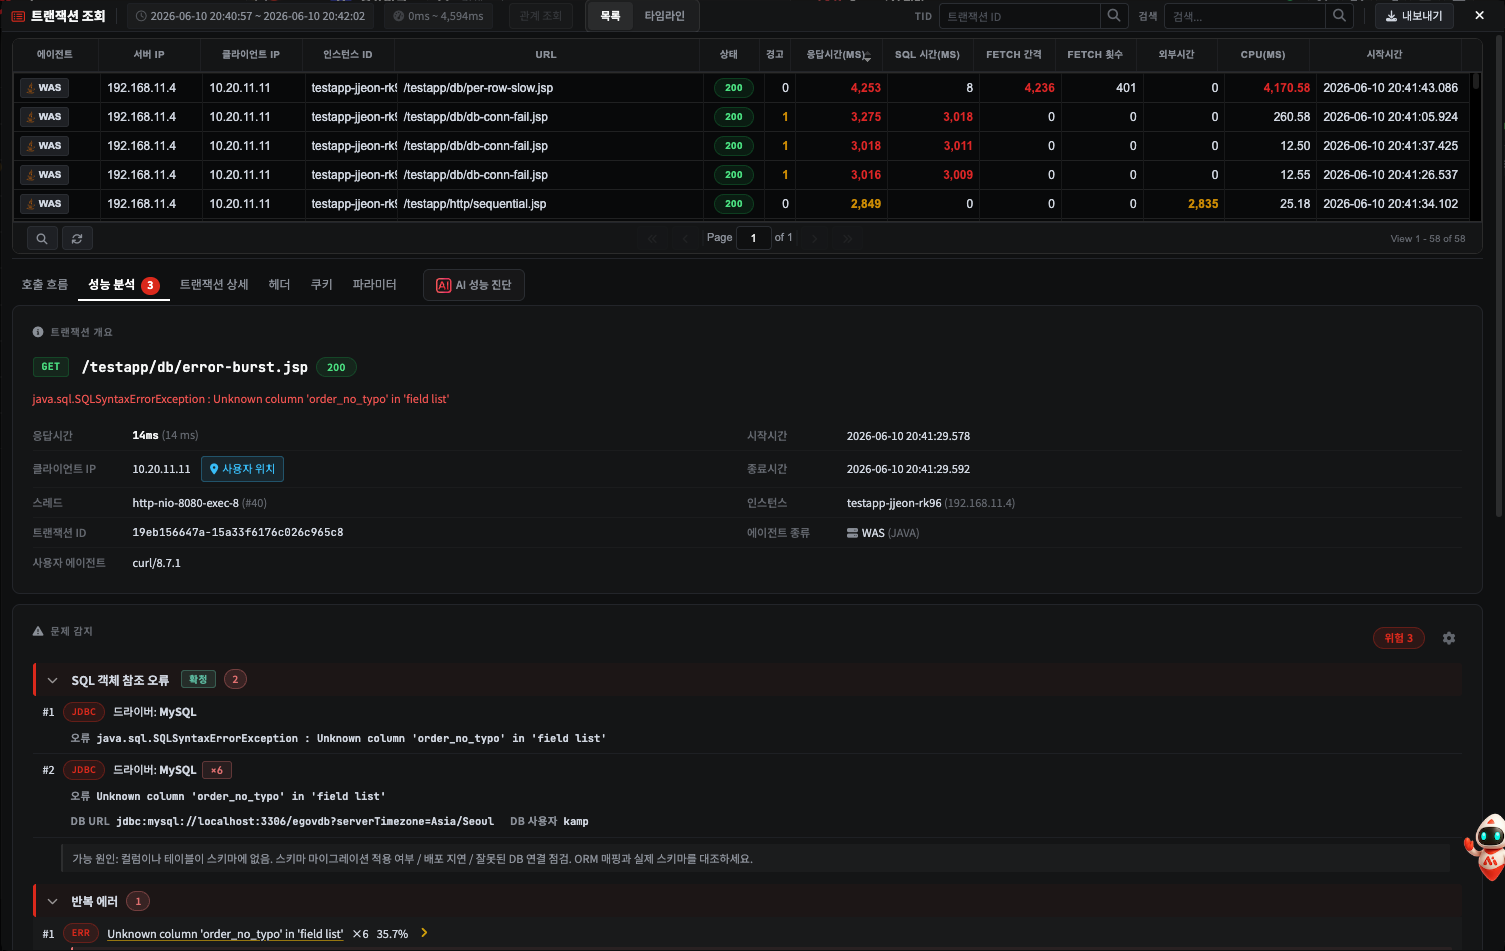
- Cause -- a temporary downstream service failure / retry logic attempting N times on the same error (a retry storm) / repeated failure on the same data during an iteration
- What to do -- getting the downstream service healthy comes first → apply backoff and a circuit breaker to the retries → exclude errors where retrying is pointless (validation and the like) from the retry set.
7. Connection Pool Wait
SQL execution itself is fast, but borrowing a connection from the pool (getConnection()) took a
long time. On the surface it looks like "the SQL is slow", but in fact the DB is idle and the
application is queuing for want of connections -- a pattern easily missed. It shows when the longest
getConnection-type span is 100 ms or more, or when the waits add up to 200 ms or more
(Tomcat JDBC · HikariCP · DBCP · C3P0 · Oracle UCP · JBoss/WildFly · WebLogic · WebSphere and
others supported). There is no watch/serious split -- the card either appears or it does not.
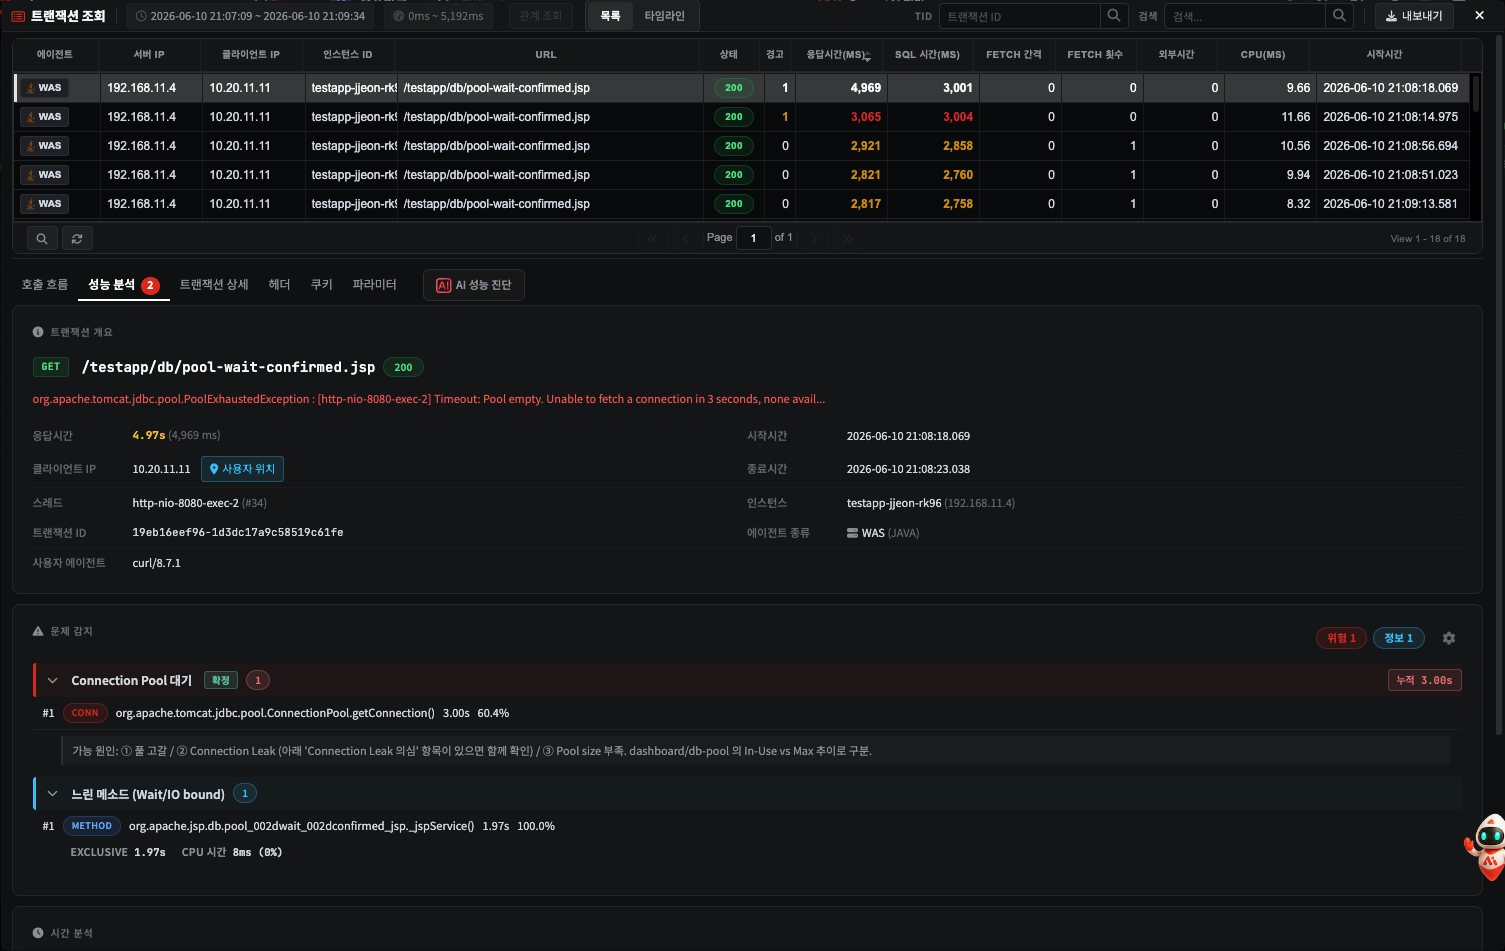
Pool usage shown on the card -- the right end of the card header shows the pool usage at that time.
| Display | Meaning |
|---|---|
Pool Usage <pool name> In Use N / Max M | The in-use connection count and the maximum pool size of that instance's pool, in the 5-second interval that contains the transaction time |
| Pool Exhausted (warning colour) | In-use has reached the maximum (N ≥ M) |
| Pool Available | In-use is below the maximum. If the transaction still waited while the pool had room, look at new connection creation or the validation query |
| Open Chart → | Closes the transaction detail window and opens the Pool Count tab of the WAS ▸ Datasources screen, for the same instance and pool, over the 5 minutes before and after the transaction, in history mode |
- If there are several data sources (pools), only the one with the highest usage ratio (in use / max) is shown.
- This value is the pool usage of that instance at that time. Which pool the transaction waited
on cannot be told -- the
getConnectionrecord carries no pool name. - If there is no metric for that time, neither the pool usage nor Open Chart is shown. Examples: just after the agent starts, an environment where pool information cannot be collected, an old transaction past the retention period of the raw metrics. The values rolled up per hour are averages in which a short exhaustion does not show, so they are not used instead.
Possible causes on the card -- the Possible causes list at the bottom of the card splits in two by pool usage.
-
Pool full → small pool / unclosed connections (a connection leak, a missing
close()-- occurs together with pattern 19) / long connection use (slow SQL, long transactions, holding a connection through an outbound call or heavy computation) -
Pool not full → slow new connection (no idle connection, so a new one is opened to the DB) / validation query (with
testOnBorrowon, every borrow adds the validation query time) -
How to tell → the pool usage above, the In-Use / Max trend in WAS > Datasources
-
What to check -- look at the pool usage on the card first, then open the data source pool chart with Open Chart and see from the trend before and after whether in-use (Active/InUse) is touching Max. If it is, exhaustion is confirmed -- the diagnostic procedure is in H8. Diagnosing Database Connection Pool Exhaustion.
-
What to do -- when the pool is full, immediately: raise maxActive temporarily to limit the impact. At root: apply an automatic-close pattern such as try-with-resources or Spring
JdbcTemplate, and on Tomcat JDBC trace the leak point withremoveAbandoned=true+logAbandoned=true. When the pool had room: check the DB connection time and the data source's validation setting (testOnBorrow).
Note On the exceptional paths where the agent does not instrument getConnection (a raw
DriverManagercall and the like), the same phenomenon can be shown as an inferred (Suspected) card based on the "parent method start → first SQL start" gap. In a normal environment that goes through a pool (a DataSource), it is always caught as this confirmed card. The pool usage and Open Chart appear only on the confirmed card.
8. DB Lock Wait
SQL execution is abnormally long and lock-related signals are visible -- the error message contains
lock wait timeout or deadlock, or an explicit lock statement such as SELECT ... FOR UPDATE took
a second or more.
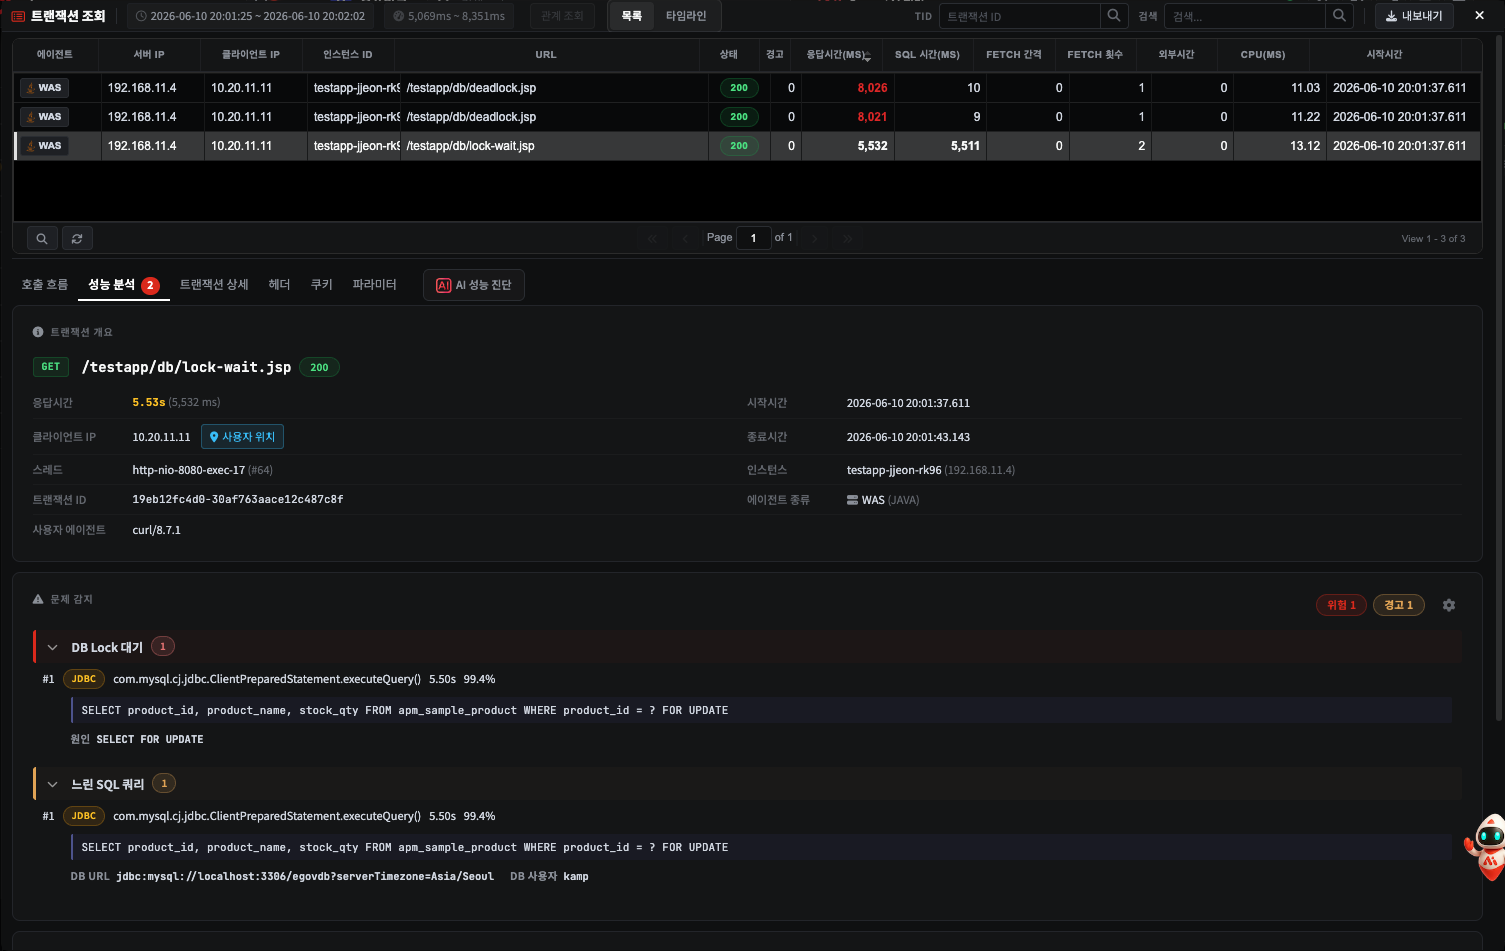
- Cause -- another long transaction occupying the same row / a deadlock from two paths locking in
a different order / a missing index widening the lock from a row to a range / heavy logic after a
FOR UPDATE - What to do -- immediately: find and end the lock holder transaction with the DBA.
At root: minimise the
@Transactionalscope, unify the lock order (by ascending id, for example), consider an optimistic lock (@Version), and add an index to avoid a range lock. Cross-check against the Lock/Wait events on the DBMS dashboard.
Tier 2 — Orange: Look Deeper
9. Suspected N+1 Query
The same SQL ran tens or hundreds of times -- the classic ORM lazy loading anti-pattern. It shows when the same (normalised) SQL repeats 5 or more times and a list lookup that read as many rows as the repeat count is found before it. The parent method is not considered; the count is taken across the whole transaction. Cumulative time is not part of this test -- that is pattern 10 (cumulative hotspot).
When no such list lookup is found, the repeats go to pattern 20 (repeated queries) instead. The two are kept apart so that the card name states only what was confirmed.
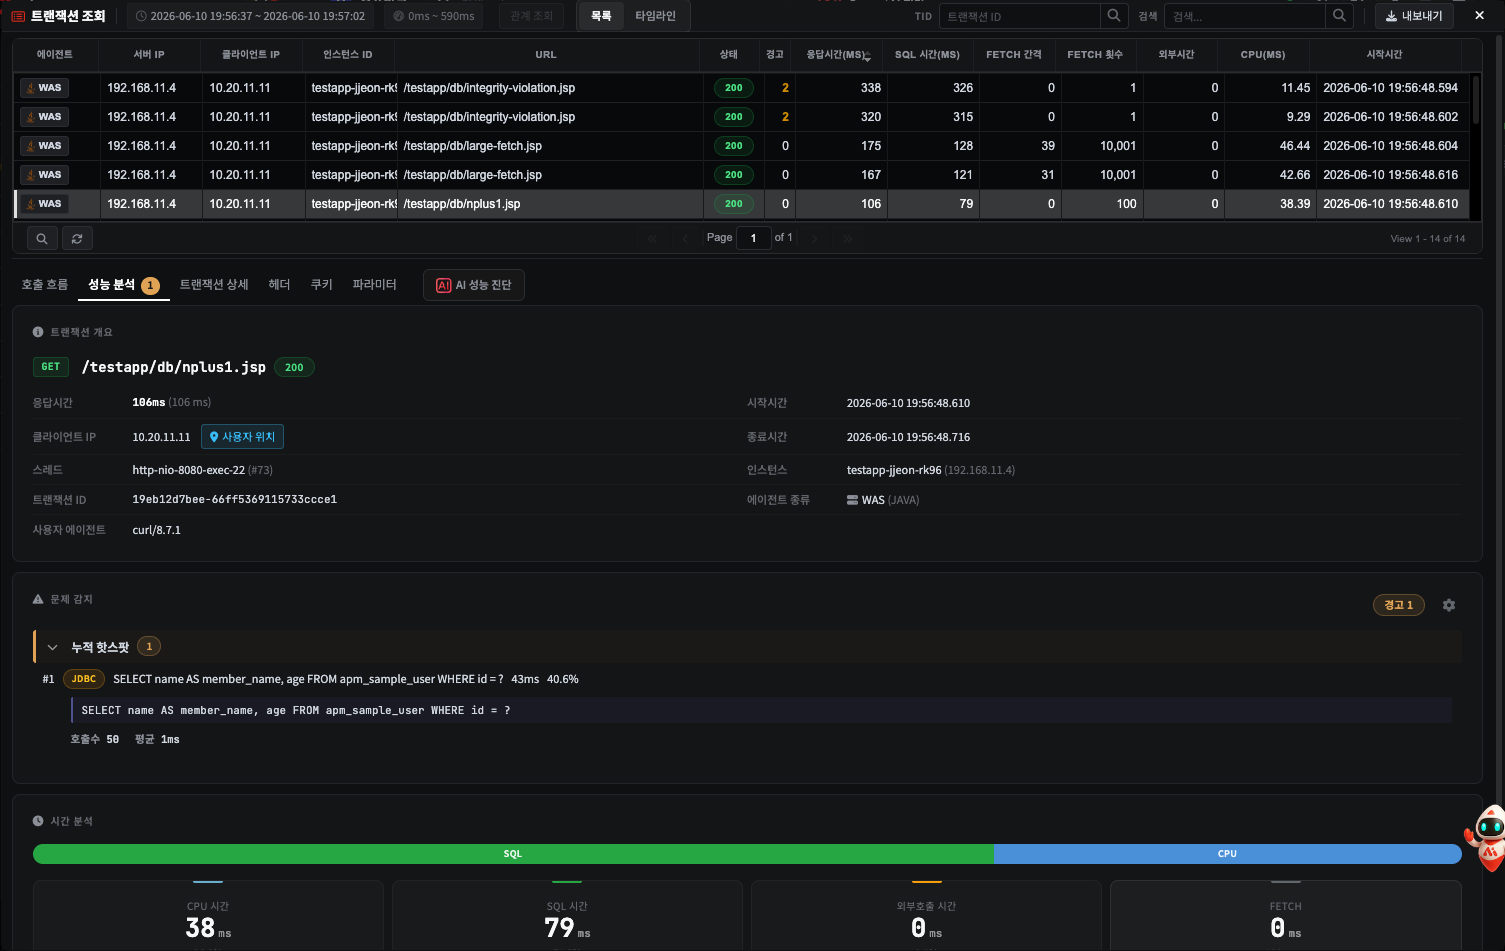
Evidence shown on the card -- below the repeated SQL, a Preceding query line shows the SQL of the list lookup that came before it, and the item information line shows Preceding query rows (the number of rows that list lookup read). When the repeat count equals the preceding query rows, it has the N+1 shape: "one list, then one query per row".
Suggested fixes on the card -- when the card has at least one repeated SQL item, a Suggested fixes list is added at the bottom. (A card with only repeated outbound (HTTP) calls does not get it.)
-
Add a JOIN to the list query to fetch everything at once
-
Collect IDs from the list and fetch them with one IN clause
-
With an ORM, use fetch join or set batch fetch size
-
Cause -- JPA
@OneToManylazy loading plus iterating the collection / MyBatis selecting child entities one at a time / an SQL call inside a loop -
What to do --
JOIN FETCHor@EntityGraph(or a batch fetch size) for JPA, a<collection>join query for MyBatis; as an emergency measure, gather the IDs and fetch in one go withWHERE id IN (...).
Note Queries that differ only by parameter are normalised and grouped automatically (
WHERE id = 123→WHERE id = ?, IN lists compressed). External URLs are grouped too:/users/123→/users/{id}.
10. Cumulative Hotspot
Each call is fast, but the same SQL or external API is called many times so the cumulative time is large. It shows when the call count is fewer than 5 and the total either exceeds one second or accounts for 30% or more of the transaction's response time. Repeats of 5 or more belong to pattern 9 or pattern 20.
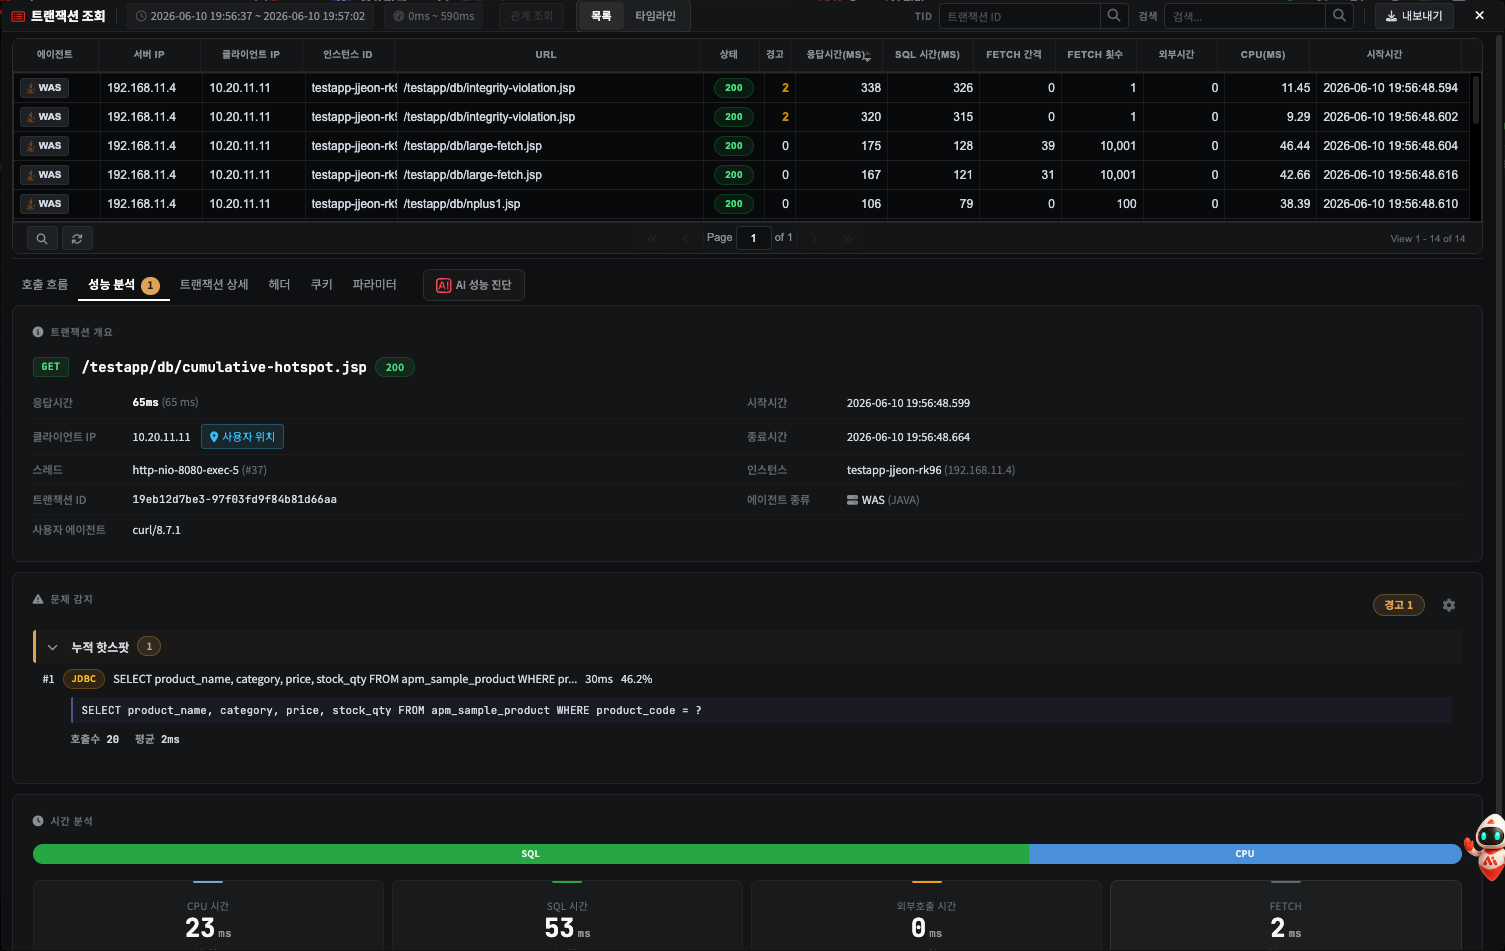
- Cause -- authentication and authorisation checks on every call / a cacheable lookup going to the DB or outside every time / duplicate fetches of the same resource
- What to do -- review in the order local cache (Caffeine and the like, with a short TTL) → distributed cache (Redis) → a batch API.
11. Slow SQL Query
A single SQL statement exceeded 100 ms. The most traditional DB tuning target.
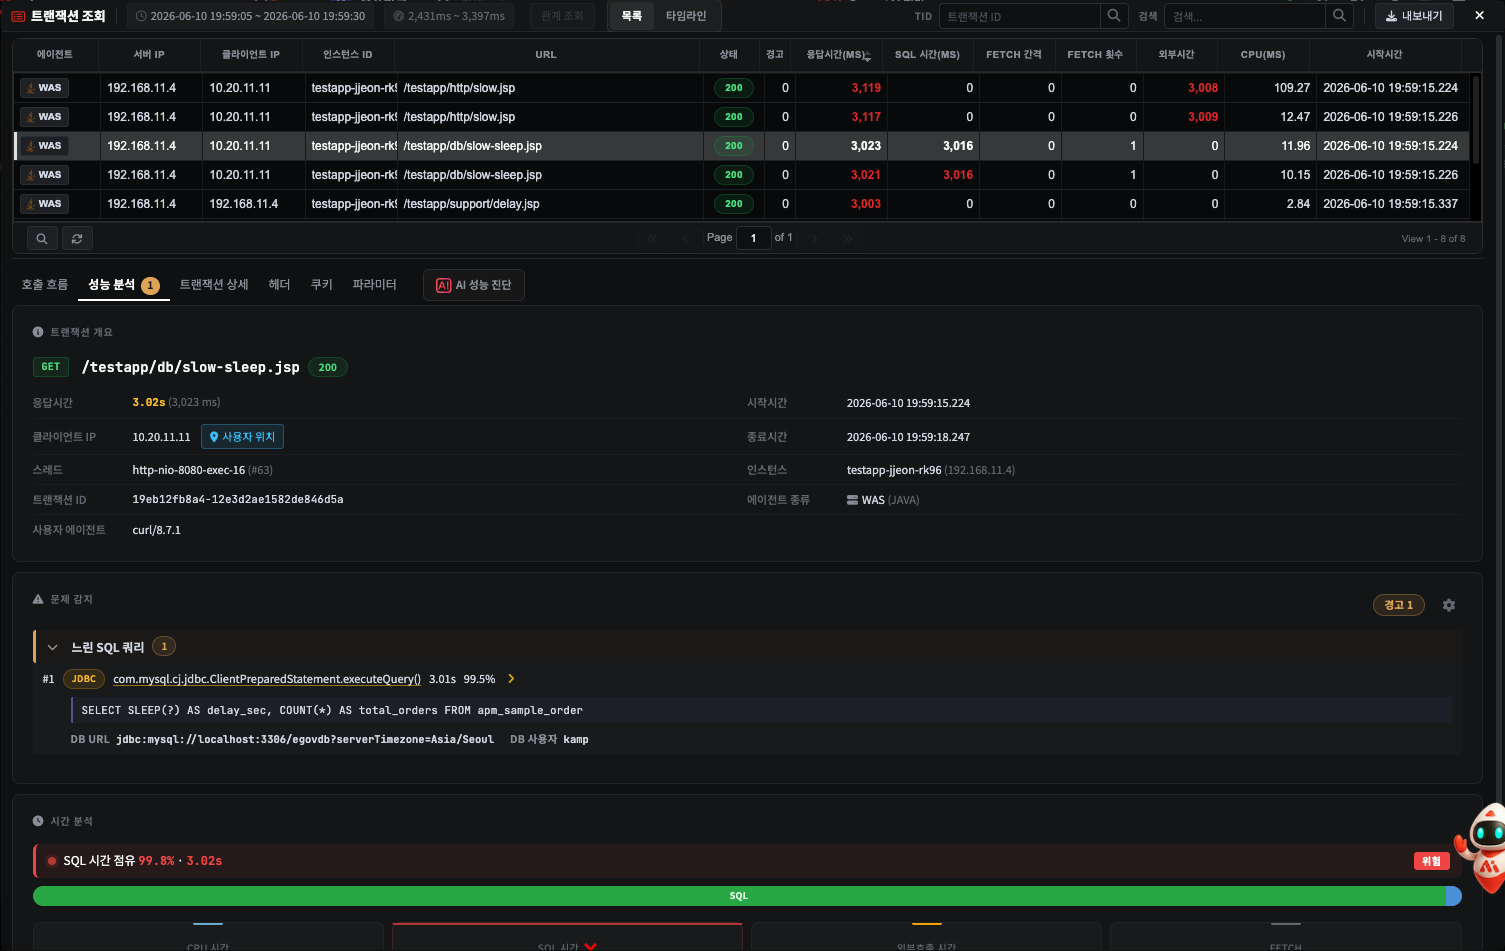
- Cause -- a missing or unused index / a bad execution plan (a table scan) / stale statistics / an inefficient JOIN order
- What to do -- analyse that SQL with
EXPLAINand add the index it needs. Pressing the [SQL] button for that SQL in the waterfall runs the AI Query Diagnosis, which analyses the execution plan and the indexes -- T3. Analysing a Cause with AI.
12. Slow Outbound Call
A single outbound HTTP/RPC/gRPC call exceeded 200 ms -- the case where the external service itself is slow.
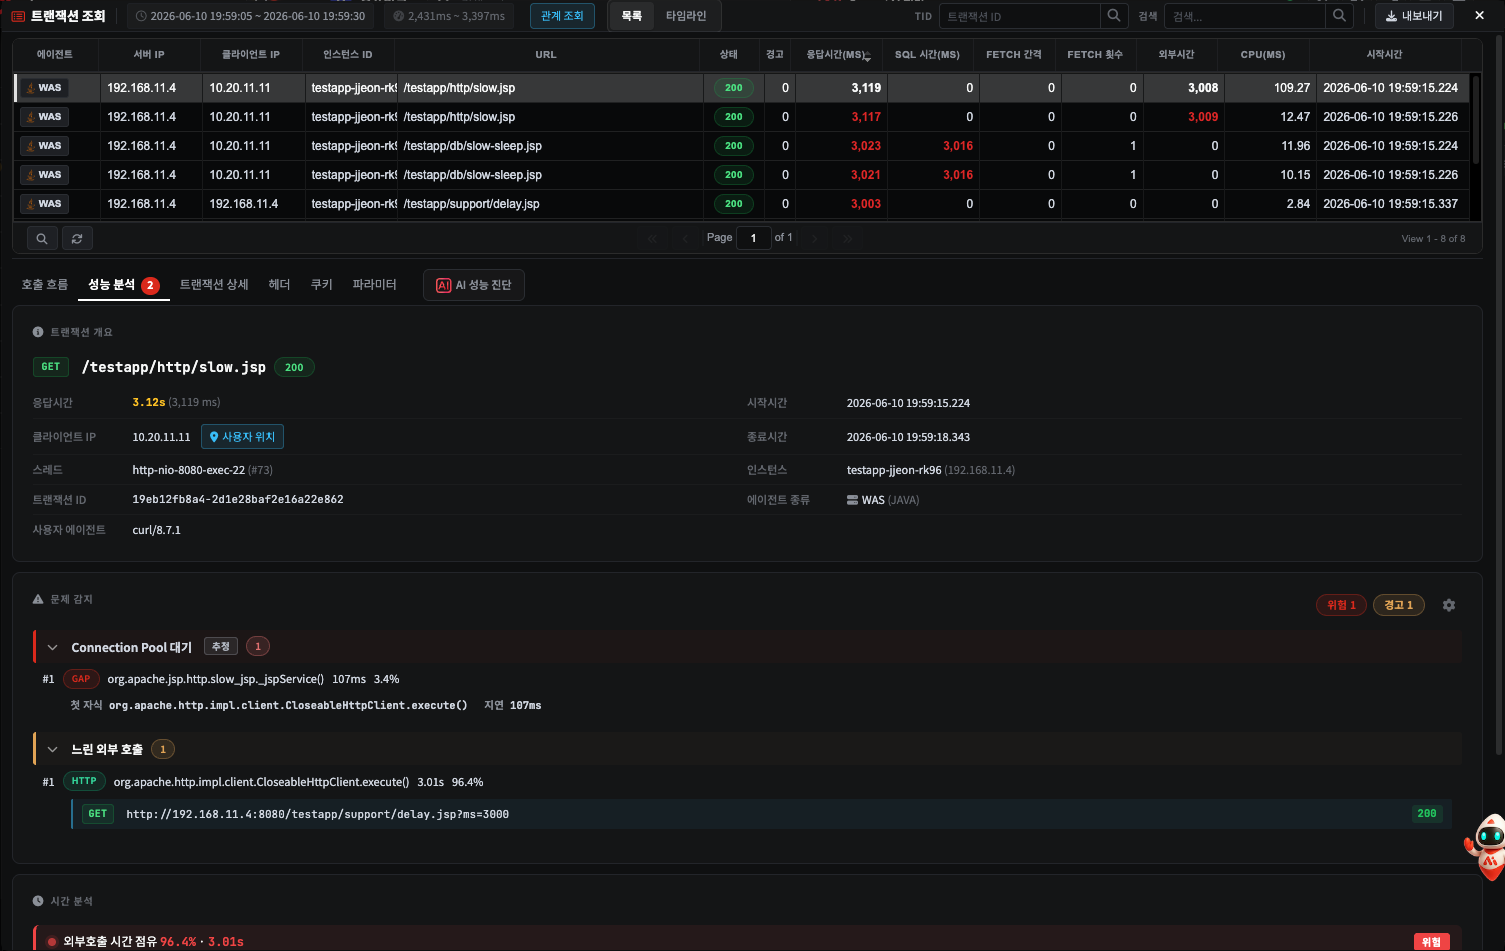
- Cause -- degraded performance of the external service / a problem in its downstream / network delay / connections not reused (repeated SSL handshakes and DNS lookups)
- What to do -- block the unbounded wait with a timeout → a circuit breaker (Resilience4j and the like) → response caching → HTTP client connection pooling. If it repeats, agree an SLA with the external service.
The distinction Pattern 10 (Cumulative hotspot) is fast individually but called many times, and pattern 13 (Deep chain) is about depth and call count. This pattern is where one single call is slow -- all three can appear at once.
13. Deep Outbound Call Chain
An HTTP call triggers other HTTP calls in a chain -- the precursor to a microservice cascade failure. It shows when the chain depth is 3 or more, or one transaction makes 10 or more outbound calls.
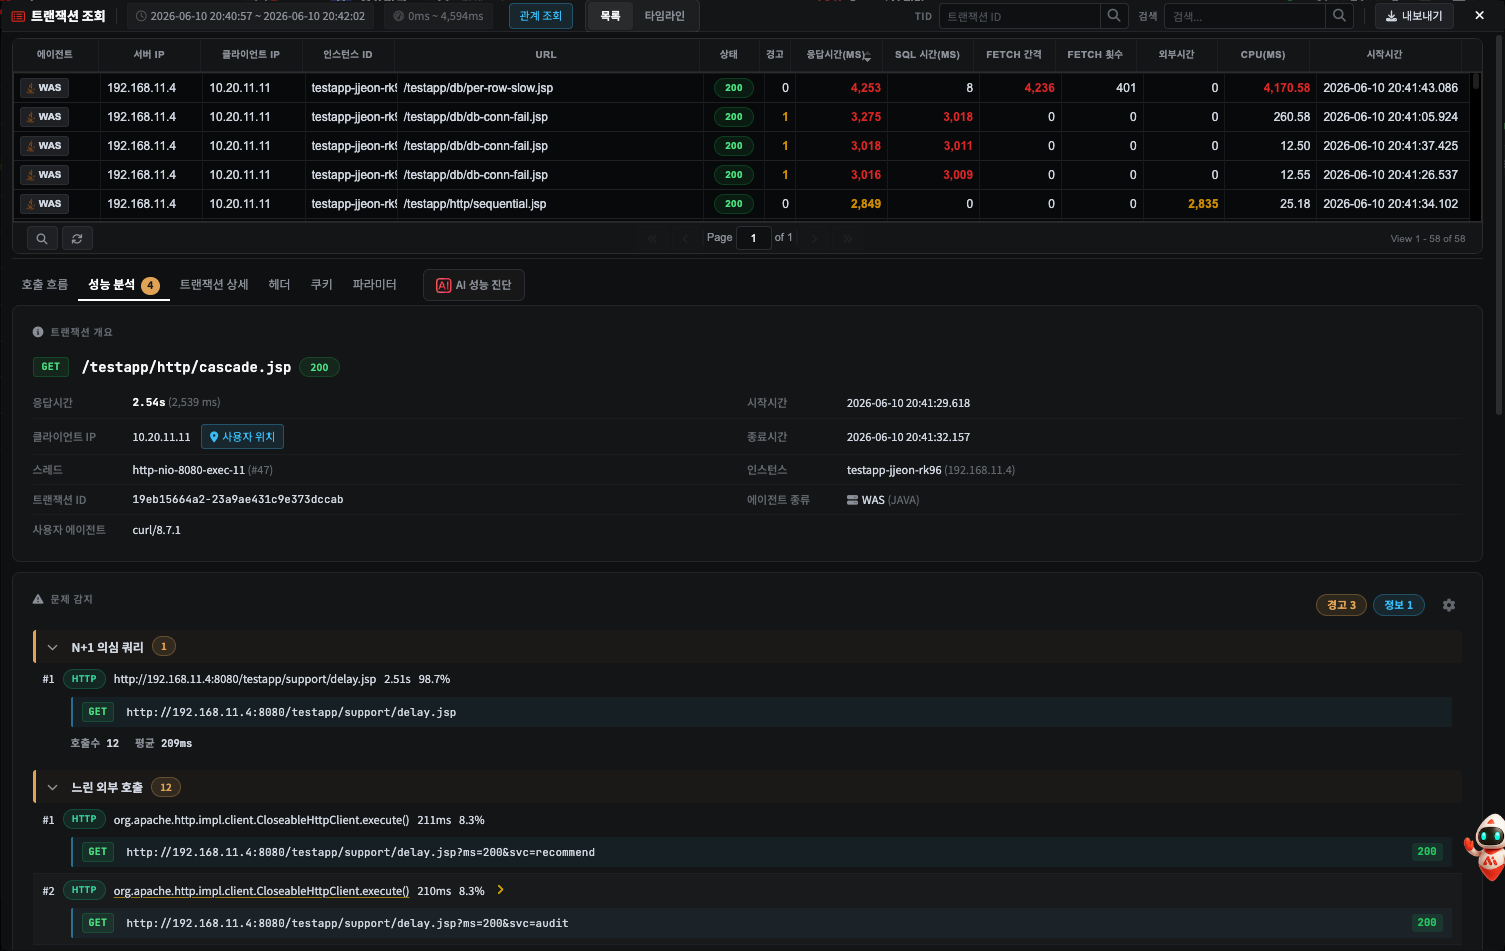
- Cause -- service boundaries drawn too finely / synchronous cross-service calls (a
@FeignClientchain) / several services looking up the same information over again - What to do -- have the gateway call in parallel and compose the responses (the BFF pattern) →
parallelise calls with no dependency using
CompletableFuture→ a timeout and a circuit breaker at each stage. One dead service in the chain fails the whole thing.
20. Repeated Queries
The same query ran 5 or more times, but no list lookup reading as many rows as the repeat count is visible before it. Repeated lookups with no list query in front, repeated writes (INSERT · UPDATE · DELETE), and cases where the statement kind or the preceding lookup cannot be decided all land here.
Why it is kept apart from pattern 9 is so that the card name states only what was confirmed. "The same query ran N times" is a fact in the record; "a list lookup came before it" is an inference drawn from execution order and row counts. It is called N+1 only when that evidence is there.
- Cause -- per-row lookups or writes inside a loop / saving one row at a time / the same lookup repeated with only the condition changed
- What to do -- collect the identifiers and look them up in one go (
WHERE id IN (...)), or send the rows together in one batch (executeBatch). If the repetition is inherent to the logic, start by asking whether the count can be reduced.
The Suggested fixes list at the bottom of the card gives candidates by cause of repetition. It does not pick a line to match the SQL kind (lookup or write) on the card, so choose the line that fits the repeated SQL.
- Only the value changes → one query with an IN clause
- Same value queried again → cache the result
- Repeated INSERT/UPDATE/DELETE → JDBC Batch
Note Repeated outbound (HTTP) calls are not split out into this card and stay with pattern 9, because there is no equivalent of a list lookup for them.
Tier 3 — Grey · Blue: Analysis Information
14. Slow Method (CPU bound / Wait·IO bound)
A plain method, not SQL or HTTP, took a long time. It is classified automatically by CPU share, and the fix for the two cases is the opposite, so be sure to check the label.
| Label | Criterion | Meaning → direction of the fix |
|---|---|---|
| CPU bound | CPU share ≥ 70% | The computation really is heavy → optimise the algorithm, serialisation, or regular expressions; profile the CPU |
| Wait/IO bound | CPU share < 10% | Waiting on sleep · a lock · blocking I/O → shrink the locked region, make the I/O asynchronous or cache it |
| (mixed) | otherwise | Check both |
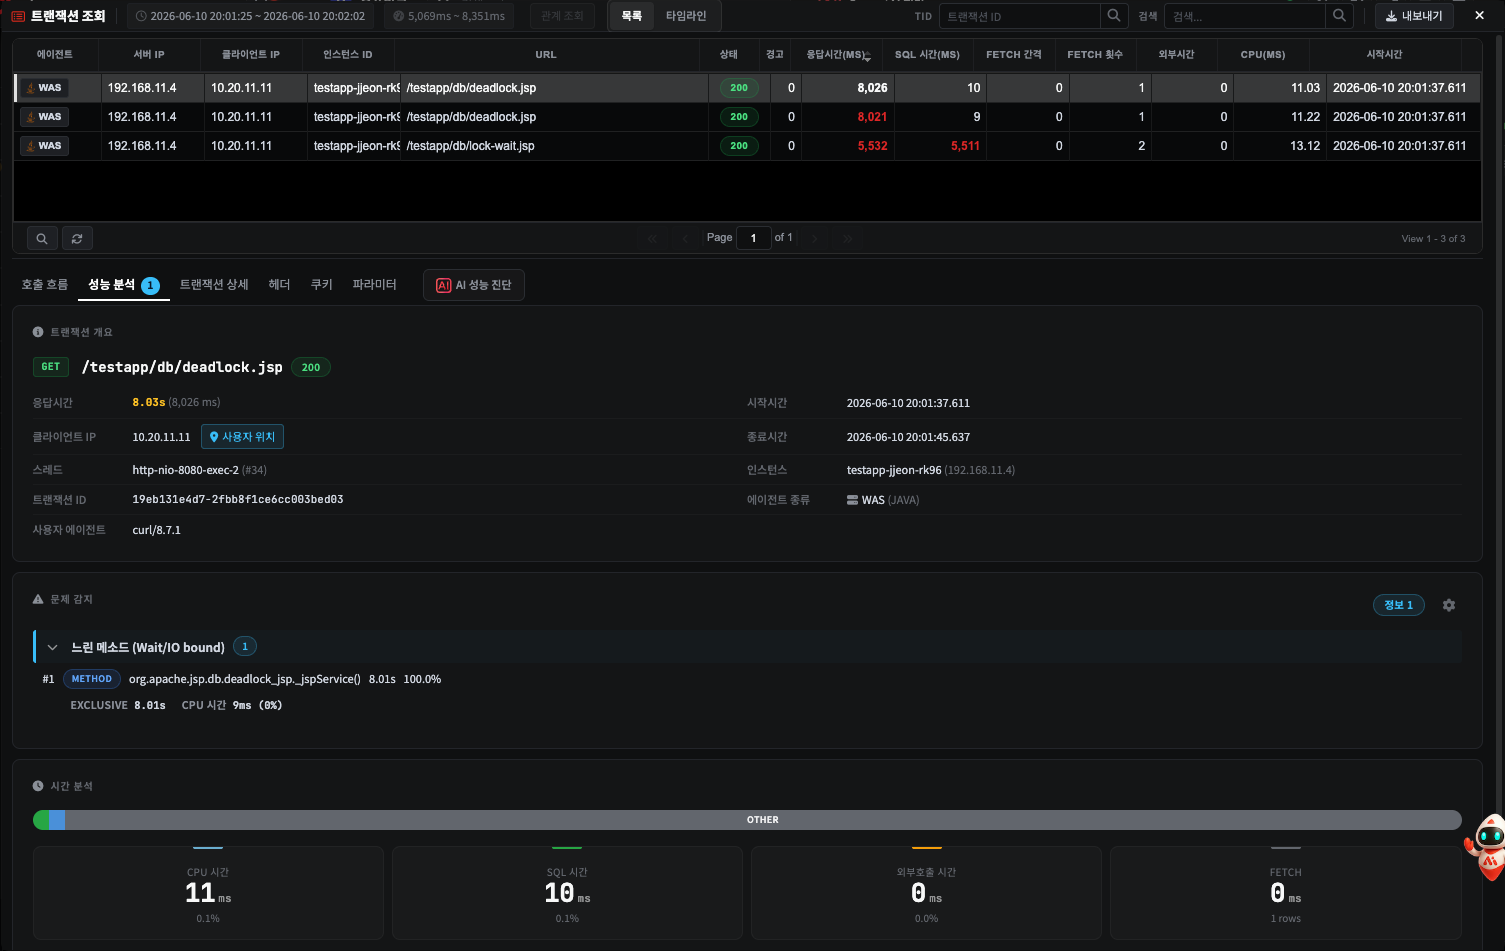
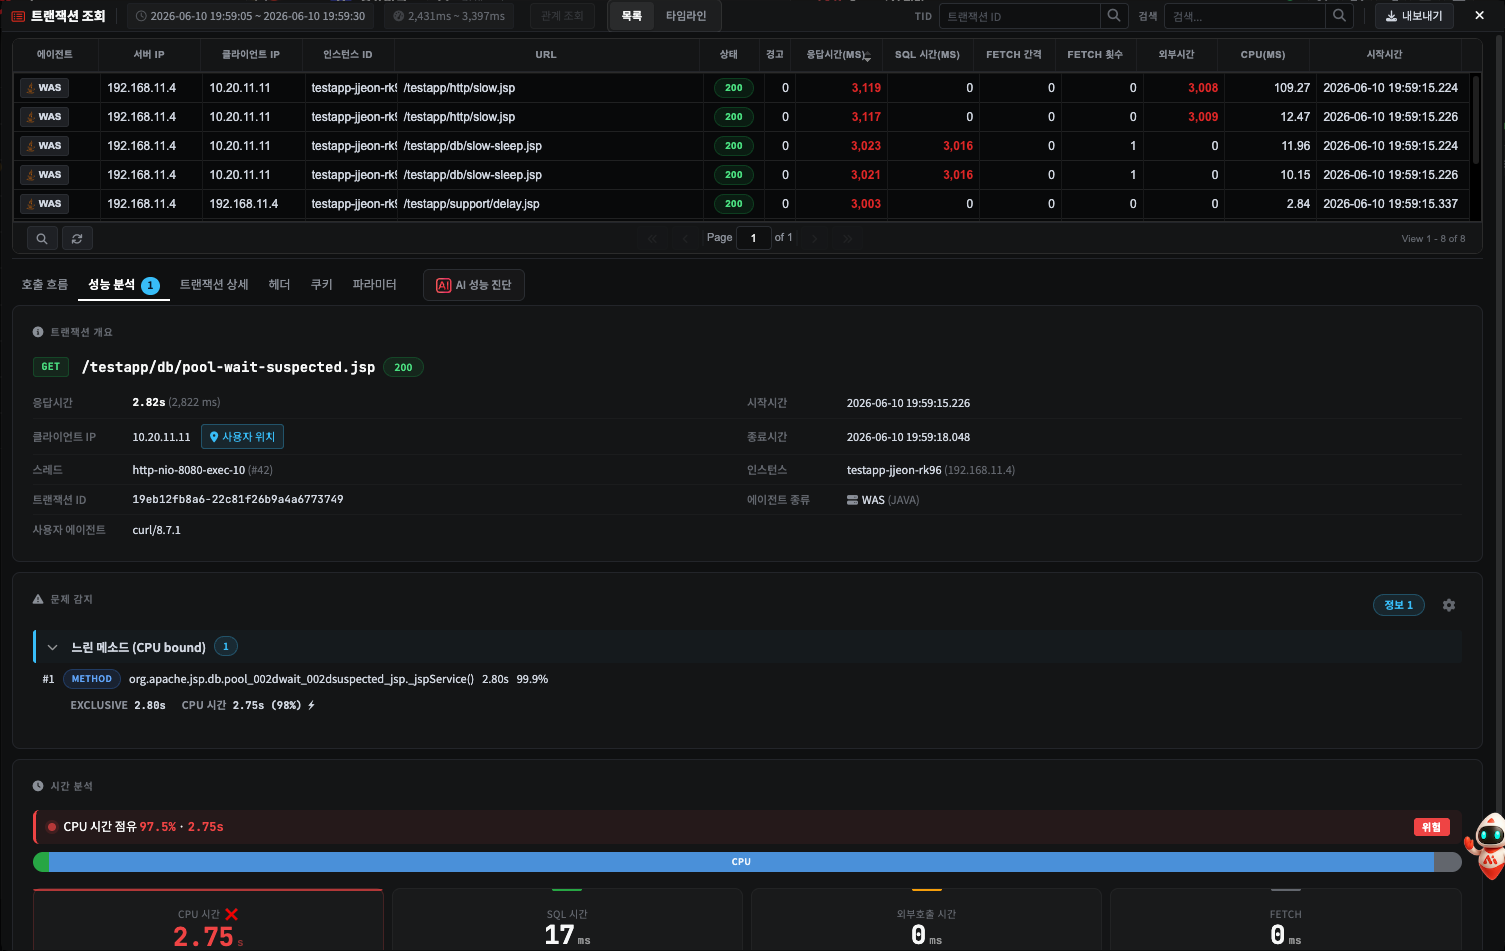
- What to check -- look at that method's stack trace in the call flow, or confirm a BLOCKED/WAITING state with a thread dump.
Note Only one label is shown per transaction, according to the distribution -- CPU bound and Wait/IO bound never appear together.
15. Large Data Fetch
A single SQL statement returned a very large result set -- 1,000 rows or more, with the time to fetch the rows greater than the query execution time.
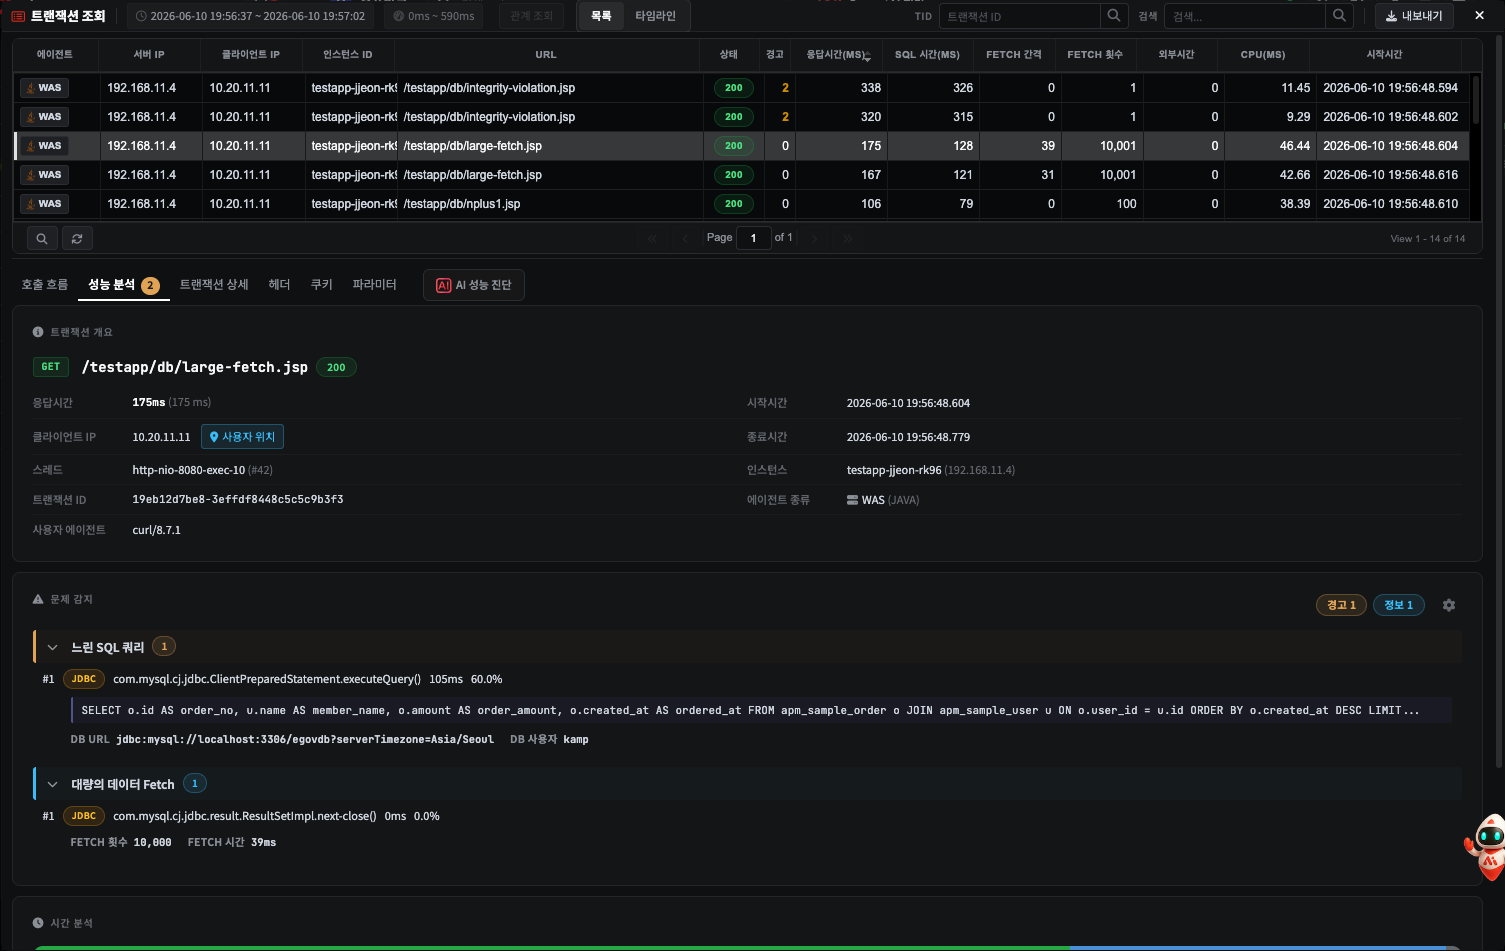
- Cause -- missing paging / JPA eager loading /
SELECT *(including BLOBs and large TEXT) / a missing search condition - What to do --
LIMITor keyset paging → SELECT only the columns needed → for a bulk export, use JDBCsetFetchSizewith cursor streaming, or a dedicated asynchronous file download path.
16. Slow Data Handling
The row count is not large (under 1,000) but the time to fetch each row is abnormally large at 1 ms or more (normal is 0.01 to 0.1 ms).
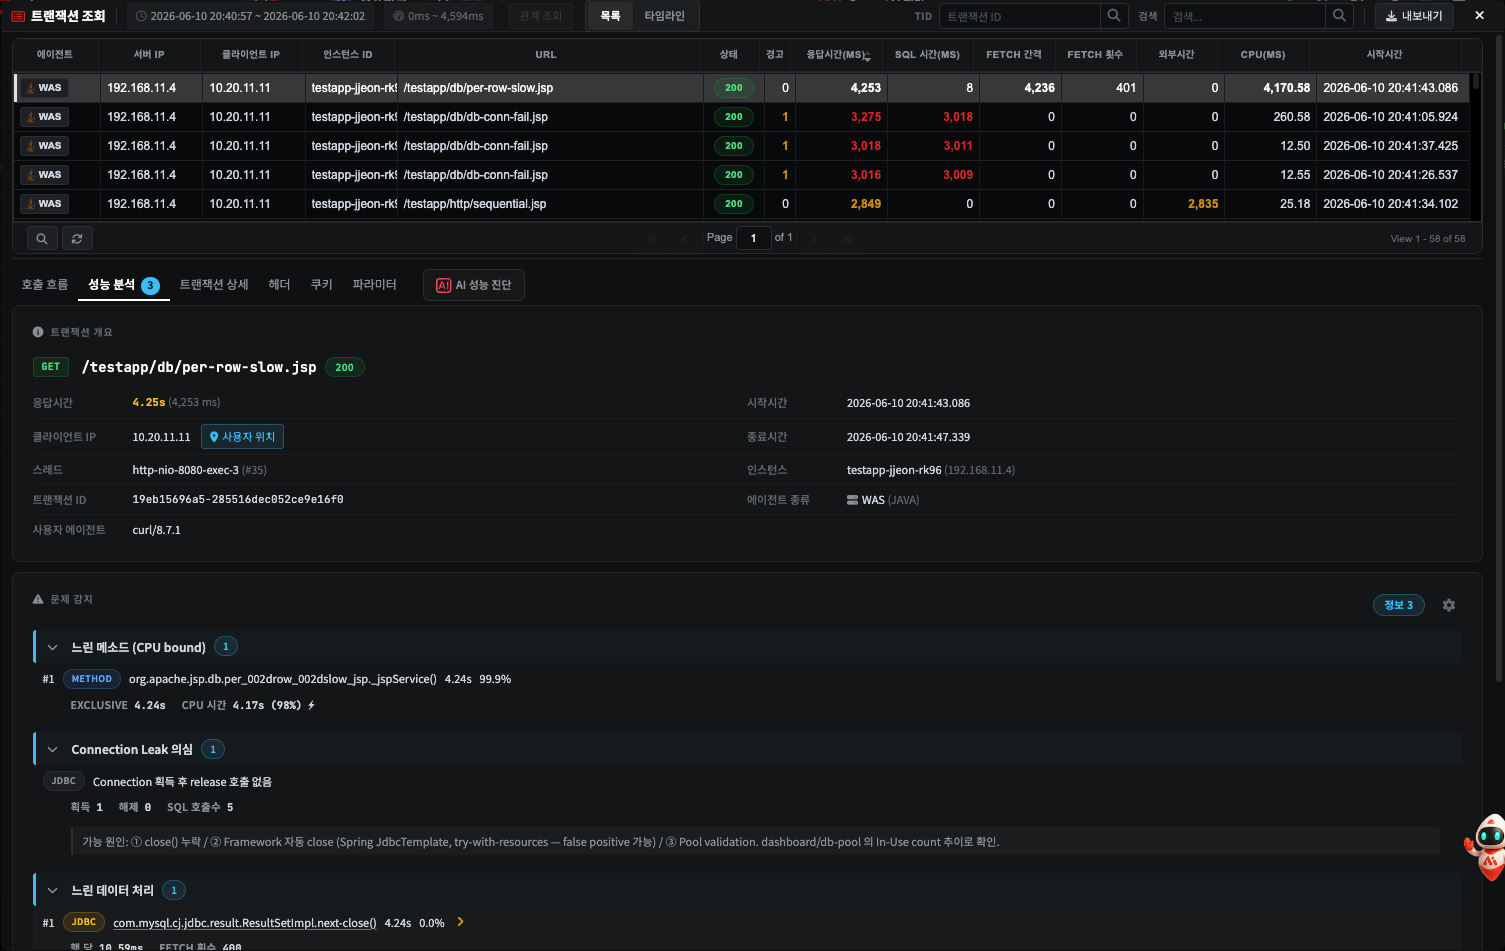
- Cause -- JDBC
fetchSizeunset (a driver default of 1 means a round-trip per row) / BLOB and CLOB columns / DB-to-WAS network delay - What to do -- raise the fetch size with
statement.setFetchSize(100)and the like → separate BLOBs out with a lazy fetch → put the DB and the WAS on the same network segment.
17. Outbound Calls Serialised
Outbound calls expected to run in parallel actually ran sequentially, so the times added up. It shows when 3 or more outbound calls under the same parent are 90% or more sequential, and it also shows how much time parallelising could save.
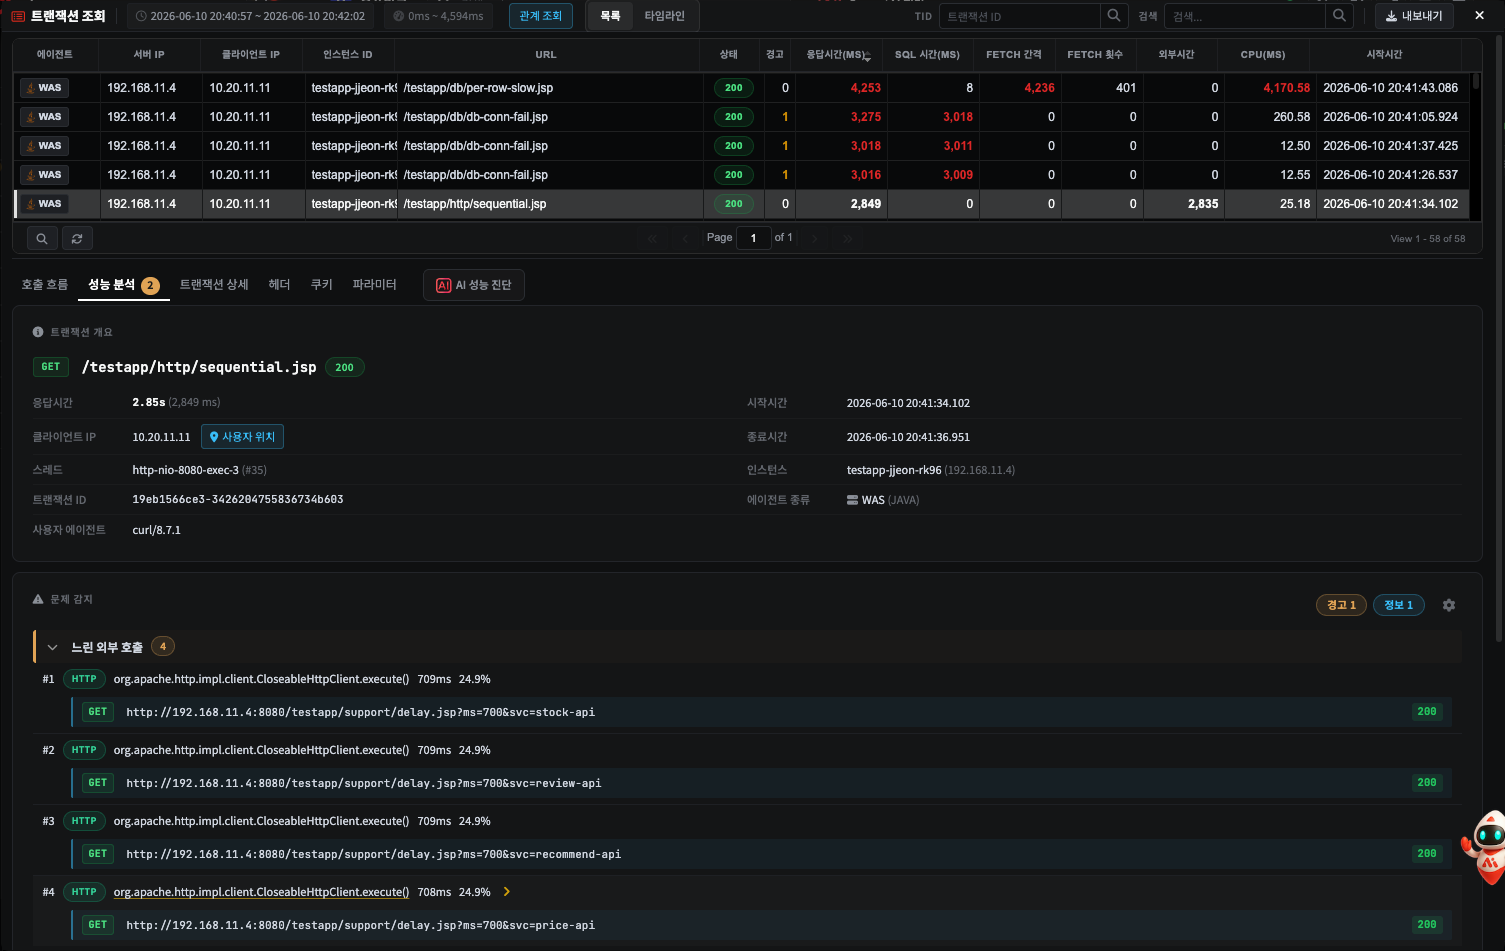
- Cause -- awaiting
.get()on aCompletableFutureright after each call / an@Asyncthread pool of size 1 / overuse of Reactorblock() - What to do -- start all the futures and wait once at the end (the
allOfpattern) → secure the thread pool size → useMono.zip/Flux.mergewith Reactor.
18. Abnormal Tree Shape
The call flow is abnormally deep (depth over 30) or wide (over 200 direct children of one parent) -- the signal of runaway recursion or a call design problem.
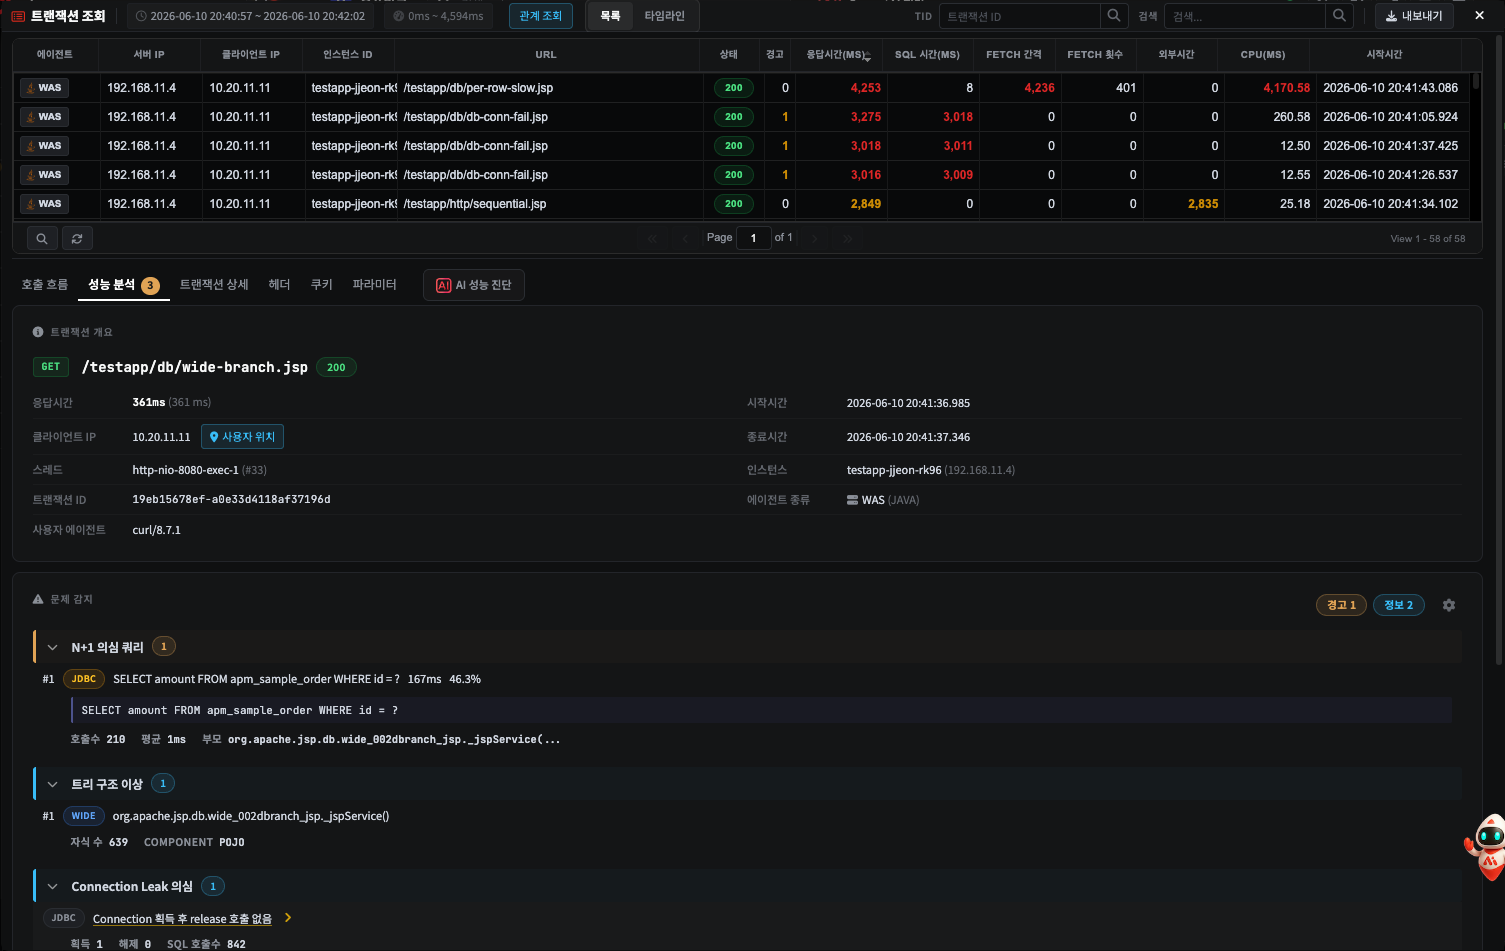
- Cause -- a missing base case in the recursion / a graph traversal revisiting the same node / many children listed flat
- What to do -- recursion → iteration or DP, cycle detection (a visited set), memoisation.
Note Even with many children, if they are all the same SQL it shows as pattern 9 (N+1), and if they are all the same fetch as pattern 15 (Large fetch), and it is excluded from this pattern -- an absorption rule to avoid showing the same thing twice.
19. Suspected Connection Leak
A connection was acquired with getConnection() within one transaction but no close/release call
is visible in the trace. It often occurs paired with pattern 7 (Connection Pool wait) -- as leaks
accumulate the pool is exhausted, and later transactions wait as pattern 7. This card points at
the transaction that caused the leak itself.
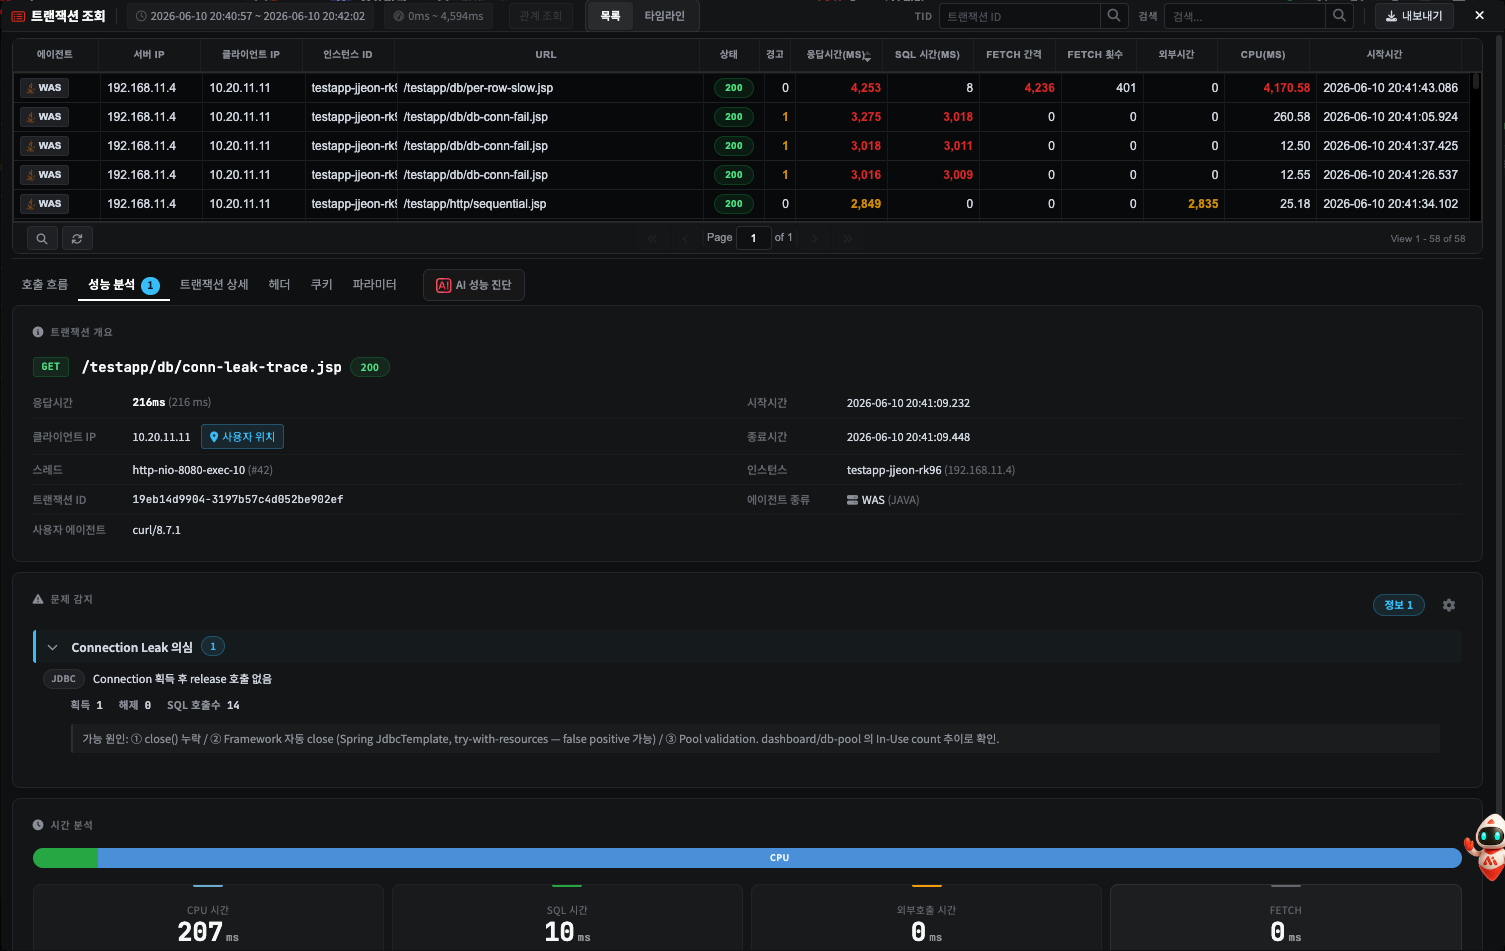
| Item | Pattern 7 Connection Pool wait | Pattern 19 Suspected connection leak |
|---|---|---|
| getConnection time | Slow (hundreds of ms) | Succeeds quickly |
| Meaning | The effect of pool exhaustion (the victim) | The cause of the leak (the culprit) |
- What to check -- the trend in connections in use on the WAS ▸ Datasources pool chart. If it does not come down as traffic falls and keeps climbing, it is a real leak (H8. Diagnosing Database Connection Pool Exhaustion).
- What to do -- automatic close with try-with-resources or a Spring template → an explicit
try-finallyclose → enable Tomcat JDBC abandoned tracking.
Caution This card is off by default -- it shows only once turned on in Settings on the problem detection header. In environments where the framework closes internally, such as Spring
JdbcTemplate, it can false-positive, so it was designed to be visible only when the user knows that possibility. If the in-use trend on the pool chart is normal, it can be ignored.
The Diagnostic Workflow
The practical order once a slow transaction is open.
- On the Performance Analysis tab, check the Tier 1 (red) cards first -- if there is one, that is the cause.
- With several DB-related cards, work from the root: ① If DB connection failure (pattern 1) is there, ignore the other DB cards and recover the connection first → ② SQL object reference error (pattern 3) is a missing migration, and the other cards are likely by-products → ③ DB lock wait (pattern 8) means tracing the lock holder → ④ Connection Pool wait (7) together with Suspected leak (19) means the leak is the root.
- With no Tier 1, start from the Tier 2 (orange) card with the largest cumulative time -- N+1 is the ORM fetch strategy, a hotspot is caching, slow SQL is EXPLAIN, and a slow outbound call is the external service.
- With no Tier 2 either, record Tier 3 as a latent risk signal.
- When the same card repeats across several transactions it is a systemic problem (a code regression or the infrastructure) -- check the frequency in the events and alerts. If it is one transaction only, it is particular to that data or scenario.
When It Does Not Work
| Symptom | What to check |
|---|---|
| Not a single problem detection card | "No problem detected" means a normal transaction -- move to the share per span in the time analysis and to H5. T-Map Patterns |
| Suspected connection leak is not visible | Off by default -- enable it in Settings on the problem detection header (see pattern 19) |
| Pattern 7 appeared but the DB is not slow | That is this pattern working properly -- the problem is the pool, not the DB (see pattern 7) |
| The pattern 7 card has no pool usage or Open Chart | There is no metric for that time (just after the agent starts, an old transaction, and so on), or it is the Suspected card -- pick the period yourself in WAS ▸ Datasources (see pattern 7) |
| The pattern 7 card says "Pool Available" yet the wait was long | Look at new connection creation or the validation query (testOnBorrow) -- or the transaction may have waited on another pool. Only the one pool with the highest usage ratio is shown |
| A card was classified as a different pattern than expected | The absorption rule -- a more specific pattern wins, so an accurately identified N+1 is excluded from the abnormal tree shape |
| Clicking a card does not move anywhere | Try again once the call flow tab has loaded; if it still does not, reopen the dialog |
Related Documents
- T2. Tracing One Slow Request All the Way -- following transaction tracing through
- T3. Analysing a Cause with AI -- AI query diagnosis for slow SQL
- H8. Diagnosing Database Connection Pool Exhaustion -- cross-checking the pool chart for patterns 7 and 19
- H5. Diagnosing with T-Map Patterns -- the response distribution pattern of the service as a whole
- R3. Event Reference -- confirming that the same pattern recurs