T3. Analysing a Cause with AI (CogentAI, SQL, Thread Dumps, Events)
Diátaxis: Tutorial · Audience: operators / administrators ← Back to contents · ← T2 Finding and Tracing from the Dashboard
If T2 found the dashboard red and slow, this exercise follows the four ways of having the AI analyse the cause -- ① the whole system with CogentAI Diagnosis, ② the SQL of a slow transaction with AI Query Diagnosis, ③ the point where things stalled with a thread dump → AI analysis, and ④ the events that have piled up with AI analysis on the spot. It takes about 9 minutes.
Prerequisite The AI buttons are visible only when an administrator has turned them on (Settings ▸ Cogent AI). If they are not visible, ask an administrator. The AI features generally are gathered in H14. Getting AI Analysis of Charts and Events.
Part 1. CogentAI Diagnosis — the Whole System at Once
When the dashboard is slow and you have no idea where the cause is, this is the quickest first step. The CogentAI Diagnosis button in the middle of the top of the screen (the header) checks the whole selected app group.
Step 1 — Choosing the Group to Diagnose
First choose the app group to analyse in the context selector (→ H1). AI diagnosis always looks at the whole group currently selected.
Step 2 — Pressing the AI Diagnose Button
- Click AI Diagnose (the CogentAI icon plus the label) on the right of the header. (Hovering shows "Is anything wrong with the system now -- AI diagnosis".)
- The CogentAI widget opens and automatically asks about the state of the whole group -- "Analyse the current situation and tell me whether there is any problem with the [group name] application and system."
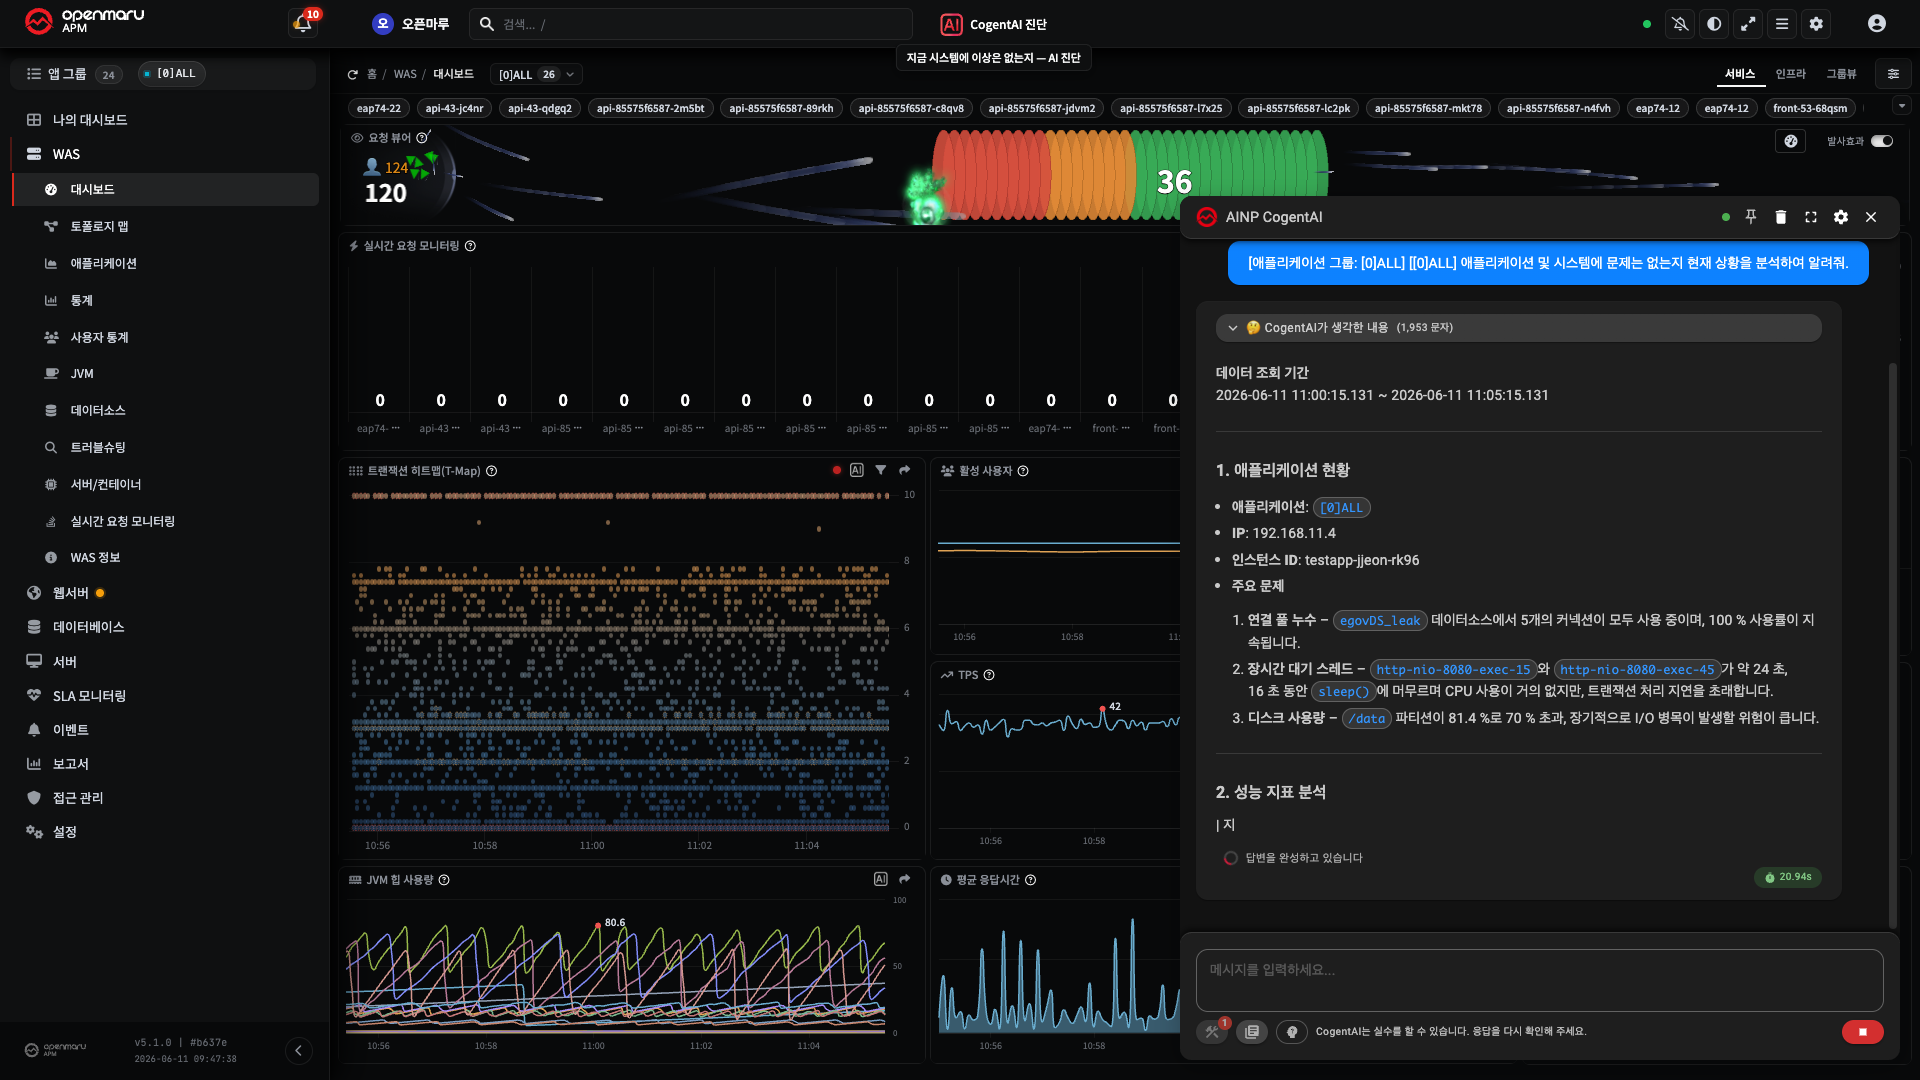
Result -- the AI checks the group overall (application and system) and, as in the screen above, reports the anomalies and where to look next in a structured form: the data retrieval period → the application position → the performance metric analysis. Follow-up questions can be asked in the input box at the bottom of the widget.
Following a Transaction Link in the Answer
When there are delays or errors, the answer comes with links to the transactions themselves. The AI does not merely say "there are slow requests" -- it points at which ones.
Clicking a link opens the transaction detail right there, without leaving the screen (it does not jump to a new tab). The chat panel folds away while the detail is open, and you return to the conversation when you close it.
Note Opening the performance analysis tab in the detail takes you straight to the problem-detection cards -- the shortest path from the AI's estimate to the actual data.
Diagnosing from My Dashboard
You can run the same diagnosis from My Dashboard, where the target is the application group on that screen. If the widget is pinned to one group, that group is what it looks at.
It picks the transactions with the largest delays automatically and analyses them too, so you do not have to decide what to look at first.
Note This button always looks at the whole group, regardless of the tab you are on. To narrow to one chart, use the AI icon on that chart card; for a T-Map pattern, use the AI button on the dot (→ T2 step 4).
Step 3 — Cross-Checking the Answer
An AI answer is a starting point. Confirm the metric it points at against R2. Chart Reference and the actual charts, turning the estimate into fact.
Caution The AI provides estimates. For actions that are hard to undo, such as a restart or a configuration change, a person should confirm the evidence before deciding.
Part 2. Slow SQL → Diagnosing the Query with AI
Going into a slow transaction found in T2 or H6 usually reveals slow SQL inside it. Before a person reads that SQL's execution plan, have CogentAI analyse it first and get a hypothesis for the cause and an index suggestion.
Step 4 — Finding the Slow SQL and Opening the SQL Dialog
- Go into the detail of the slow transaction (→ T2 step 4 · H6. Finding the Cause of a Slow Transaction).
- Pressing the [SQL] button on a database span in the waterfall opens the SQL query dialog.
- In the dialog, check the query as actually executed (with the bind values filled in) and the fetch and execution statistics.
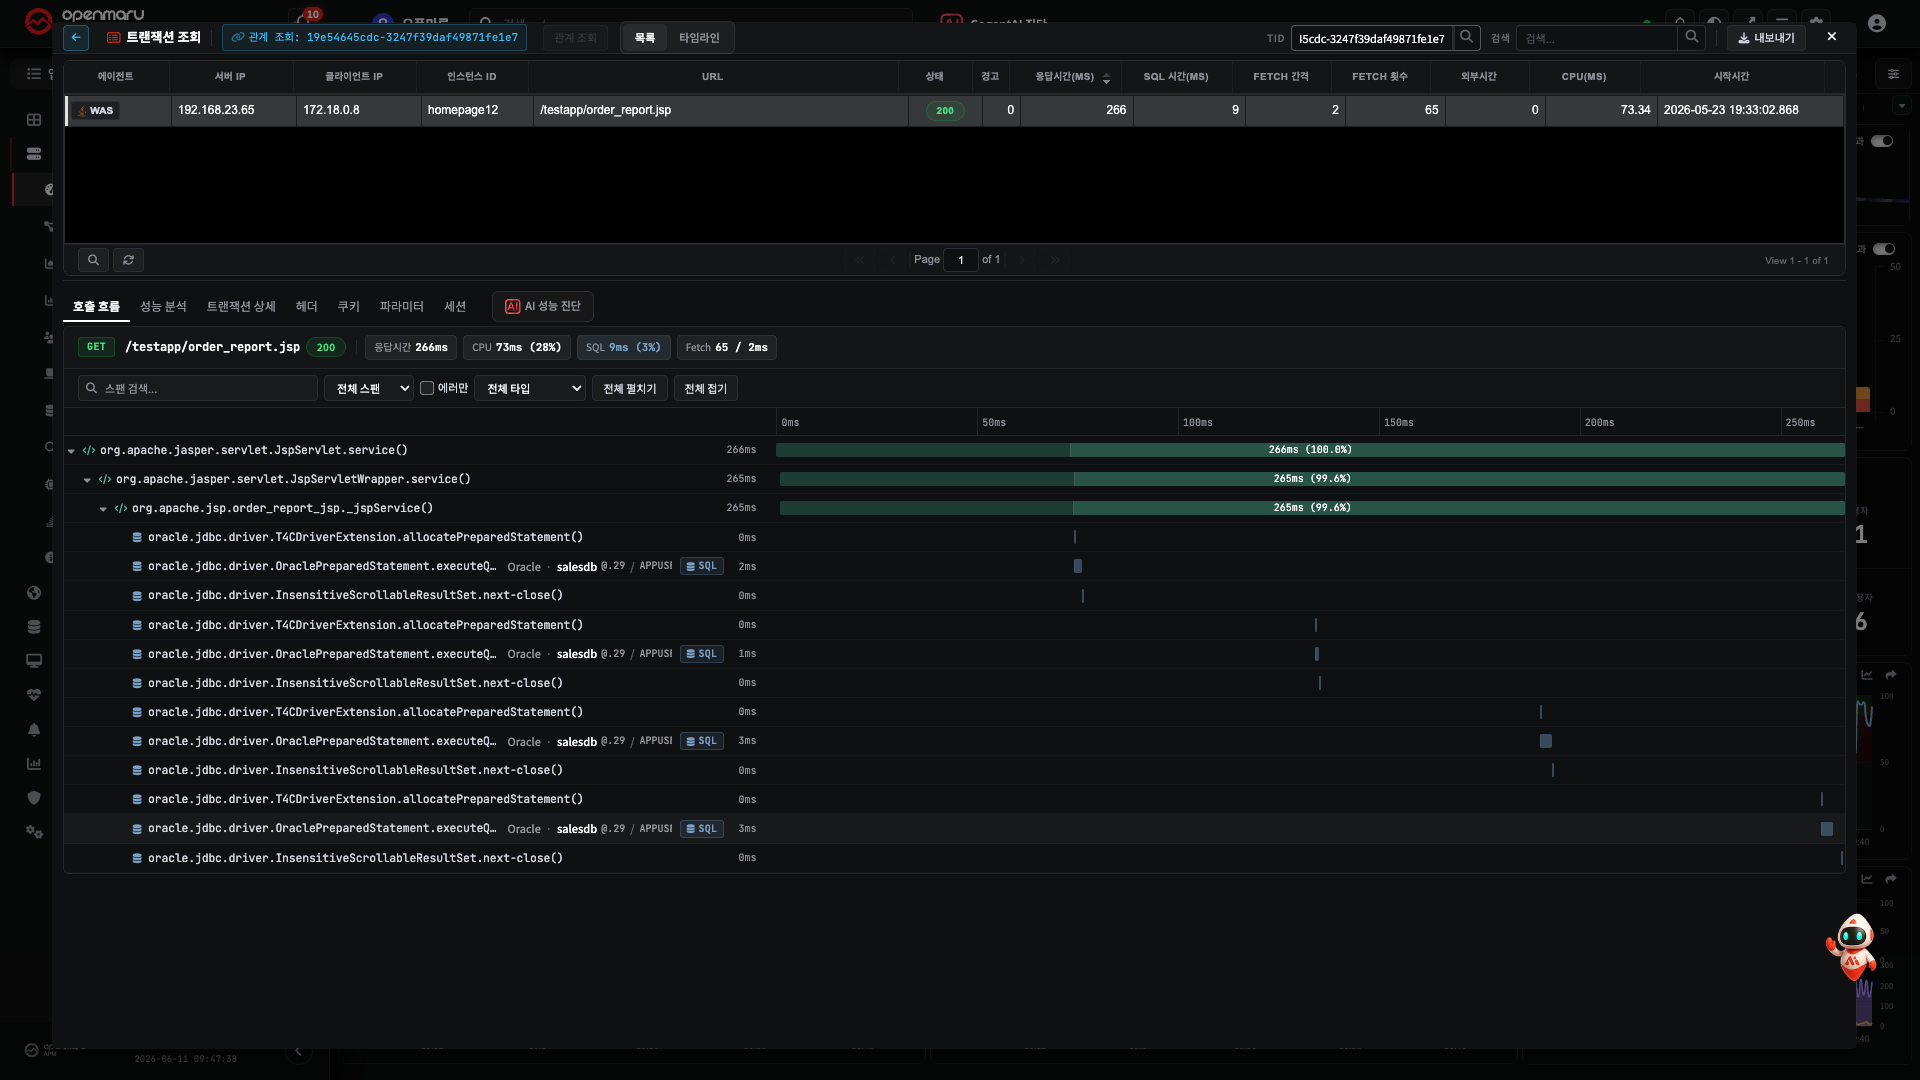
The example above is a screen where one entry has been chosen from the transaction query opened by dragging on the T-Map. Database calls (executeQuery) repeat in the call flow (waterfall), and a [SQL] button appears on the right of each database span -- that button is the entrance to the SQL query dialog.
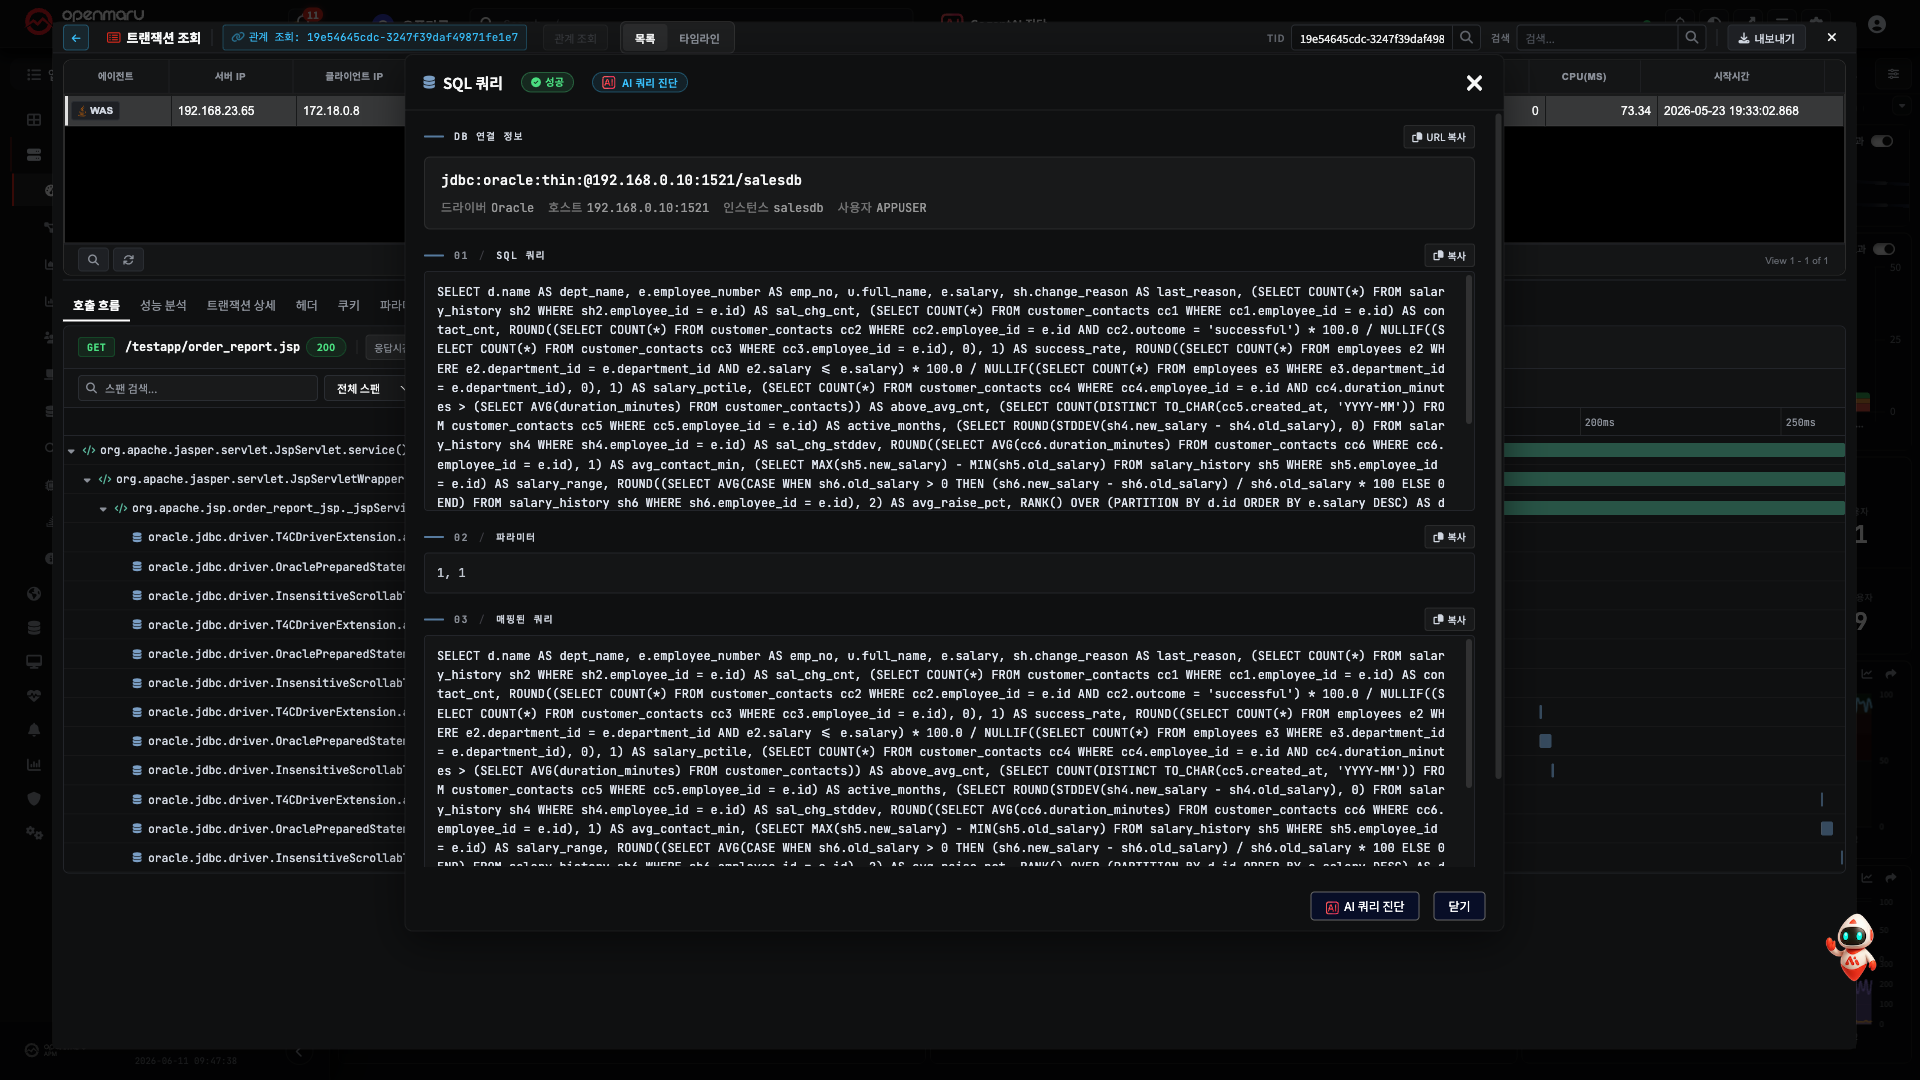
The dialog shows, in order, the database connection details (driver, host, instance, user), the
SQL query (with ? bind variables), the parameters, the mapped query with the bind values
filled in, and FETCH (count and time). The copy button on each block takes the query straight
away.
Result -- one SQL statement is open in the dialog, ready to analyse.
Step 5 — Pressing "AI Query Diagnosis"
- Press the AI Query Diagnosis button (the CogentAI icon) in the dialog header (beside the status badge) or footer (to the left of [Close]).
- That SQL is passed to CogentAI together with the database type and the connection details and comes back with an execution plan analysis plus index recommendations. How the connection details find the database to analyse is described in How the Database Connection Is Chosen below.
- The dialog does not close; the result appears in the CogentAI panel at the bottom right (with a "check the result in the CogentAI panel" toast).
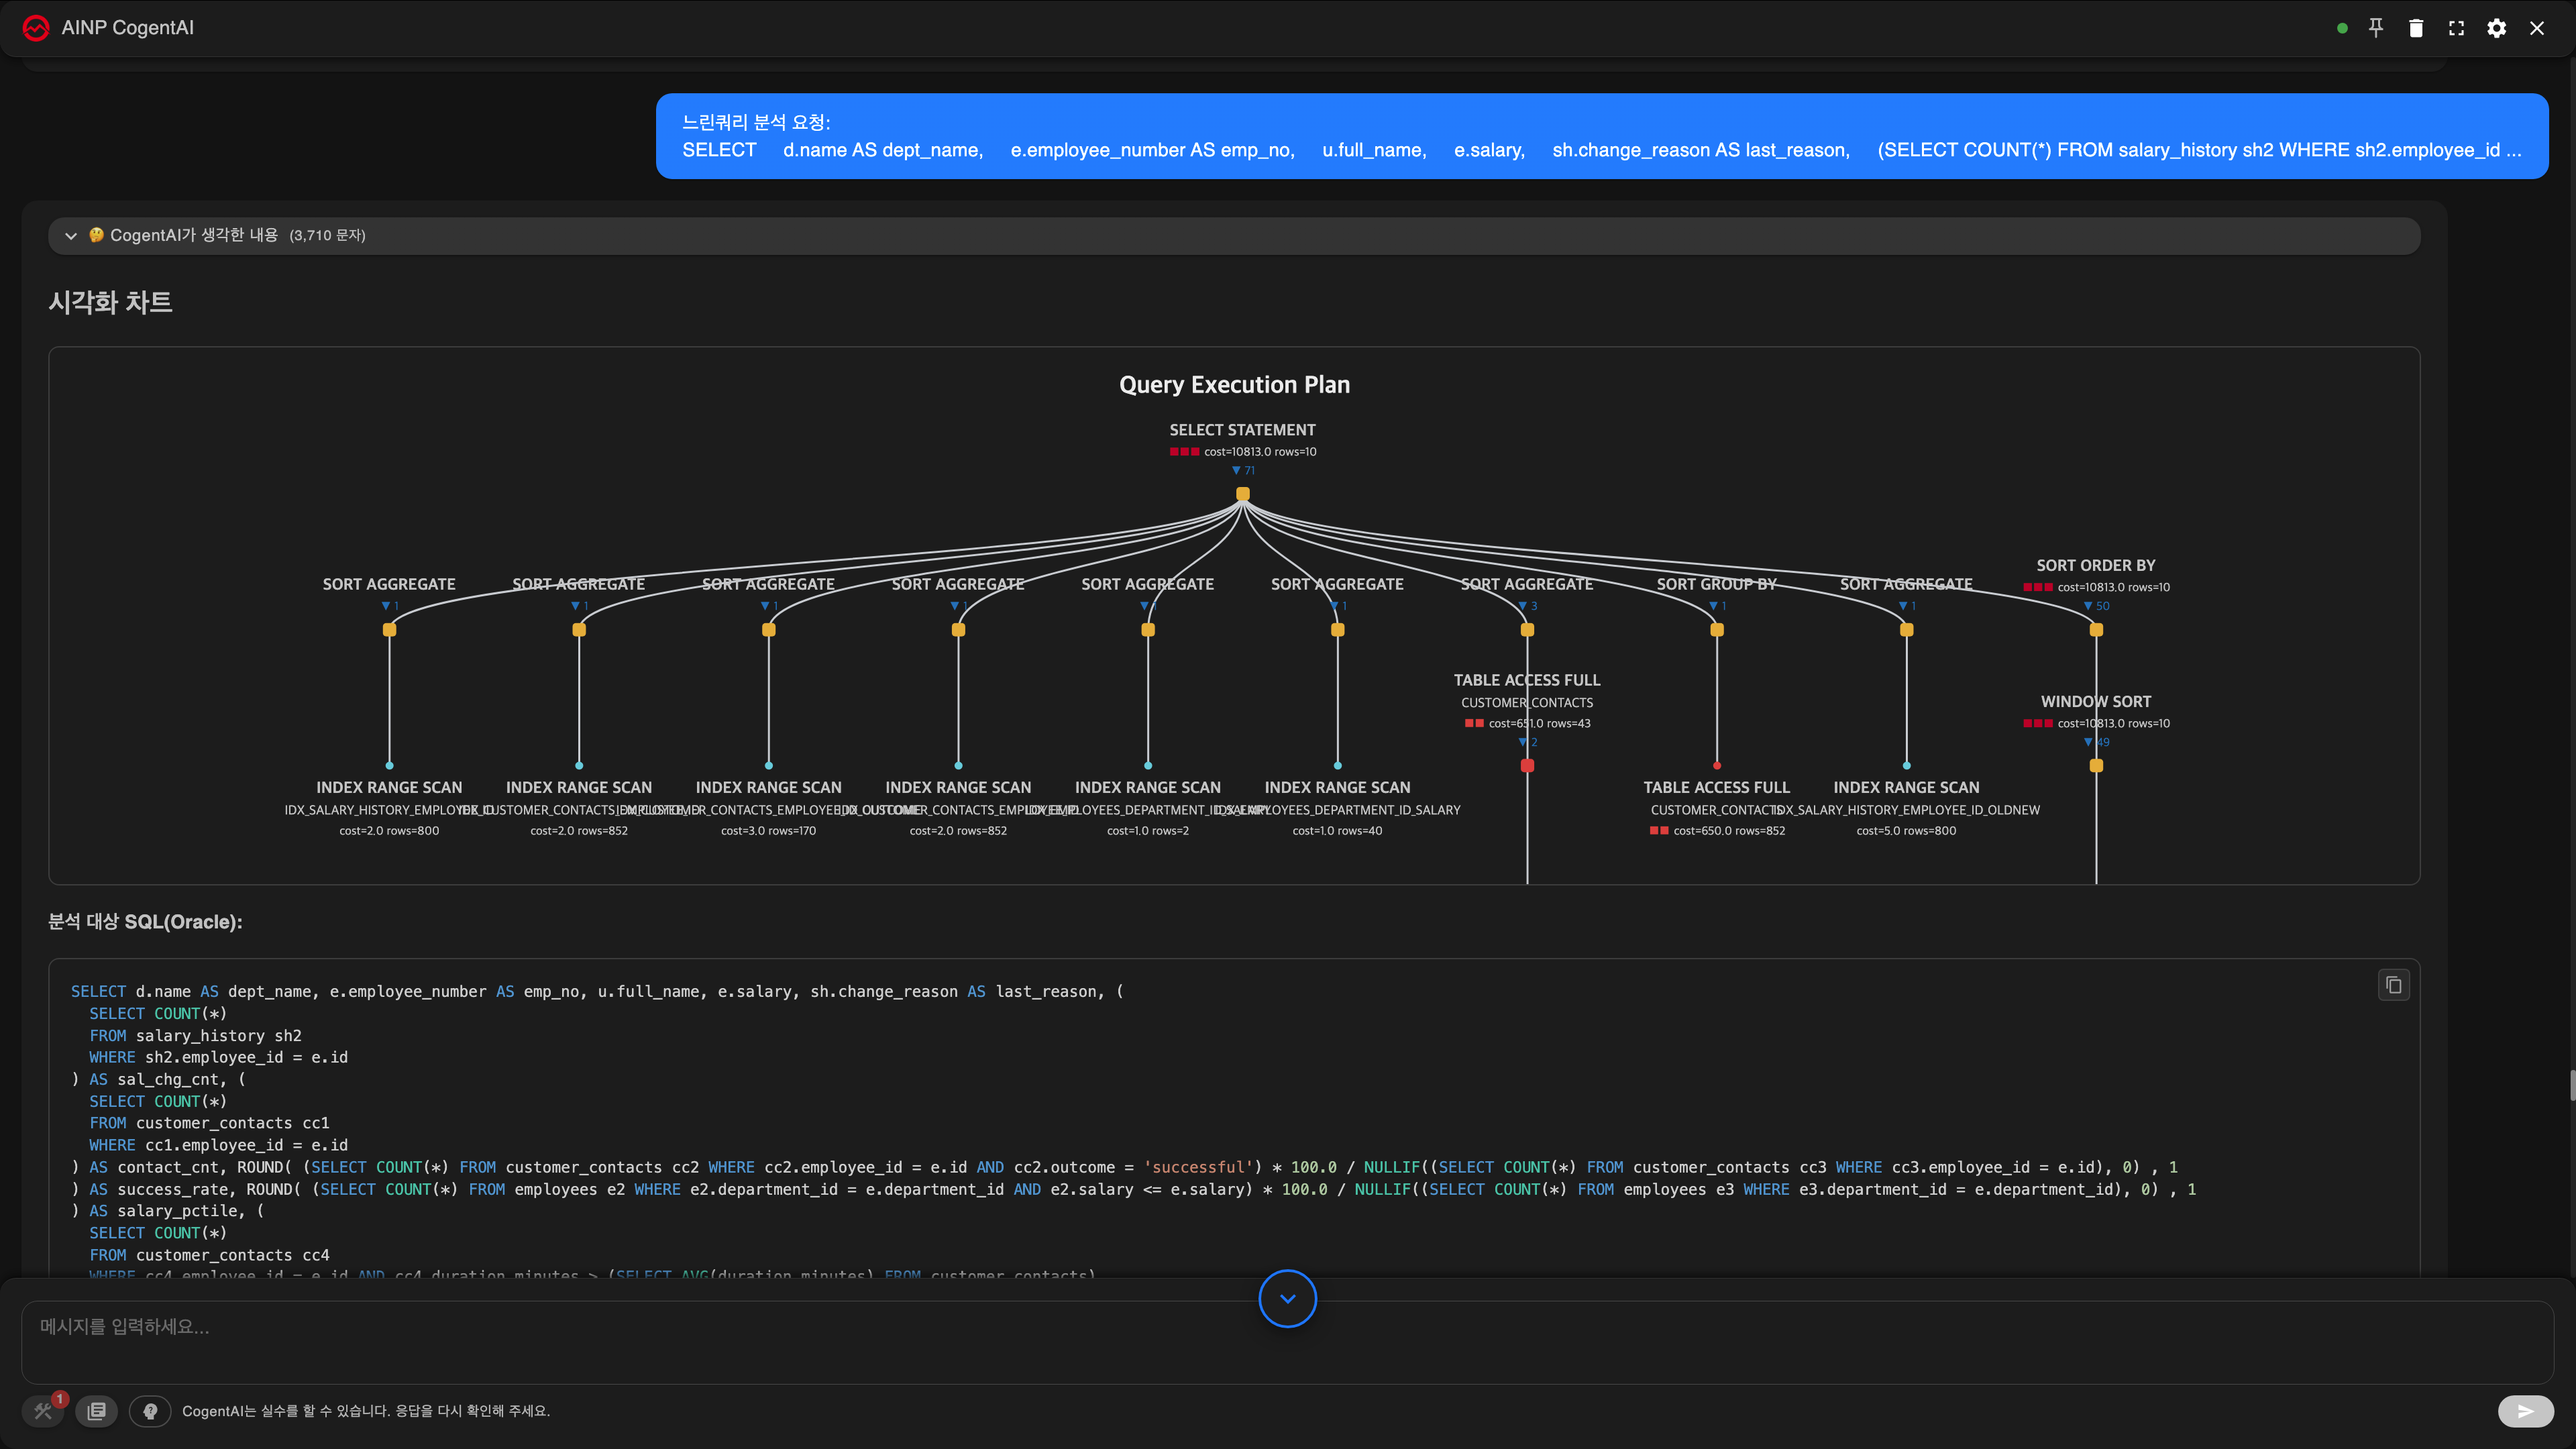
Result -- before interpreting the execution plan yourself, the AI has already picked out why it is slow and how to fix it (indexes and so on).
How to Read the AI Query Diagnosis Report
The report in the CogentAI panel is laid out in the following order. Reading from the top gives you symptom → cause → prescription.
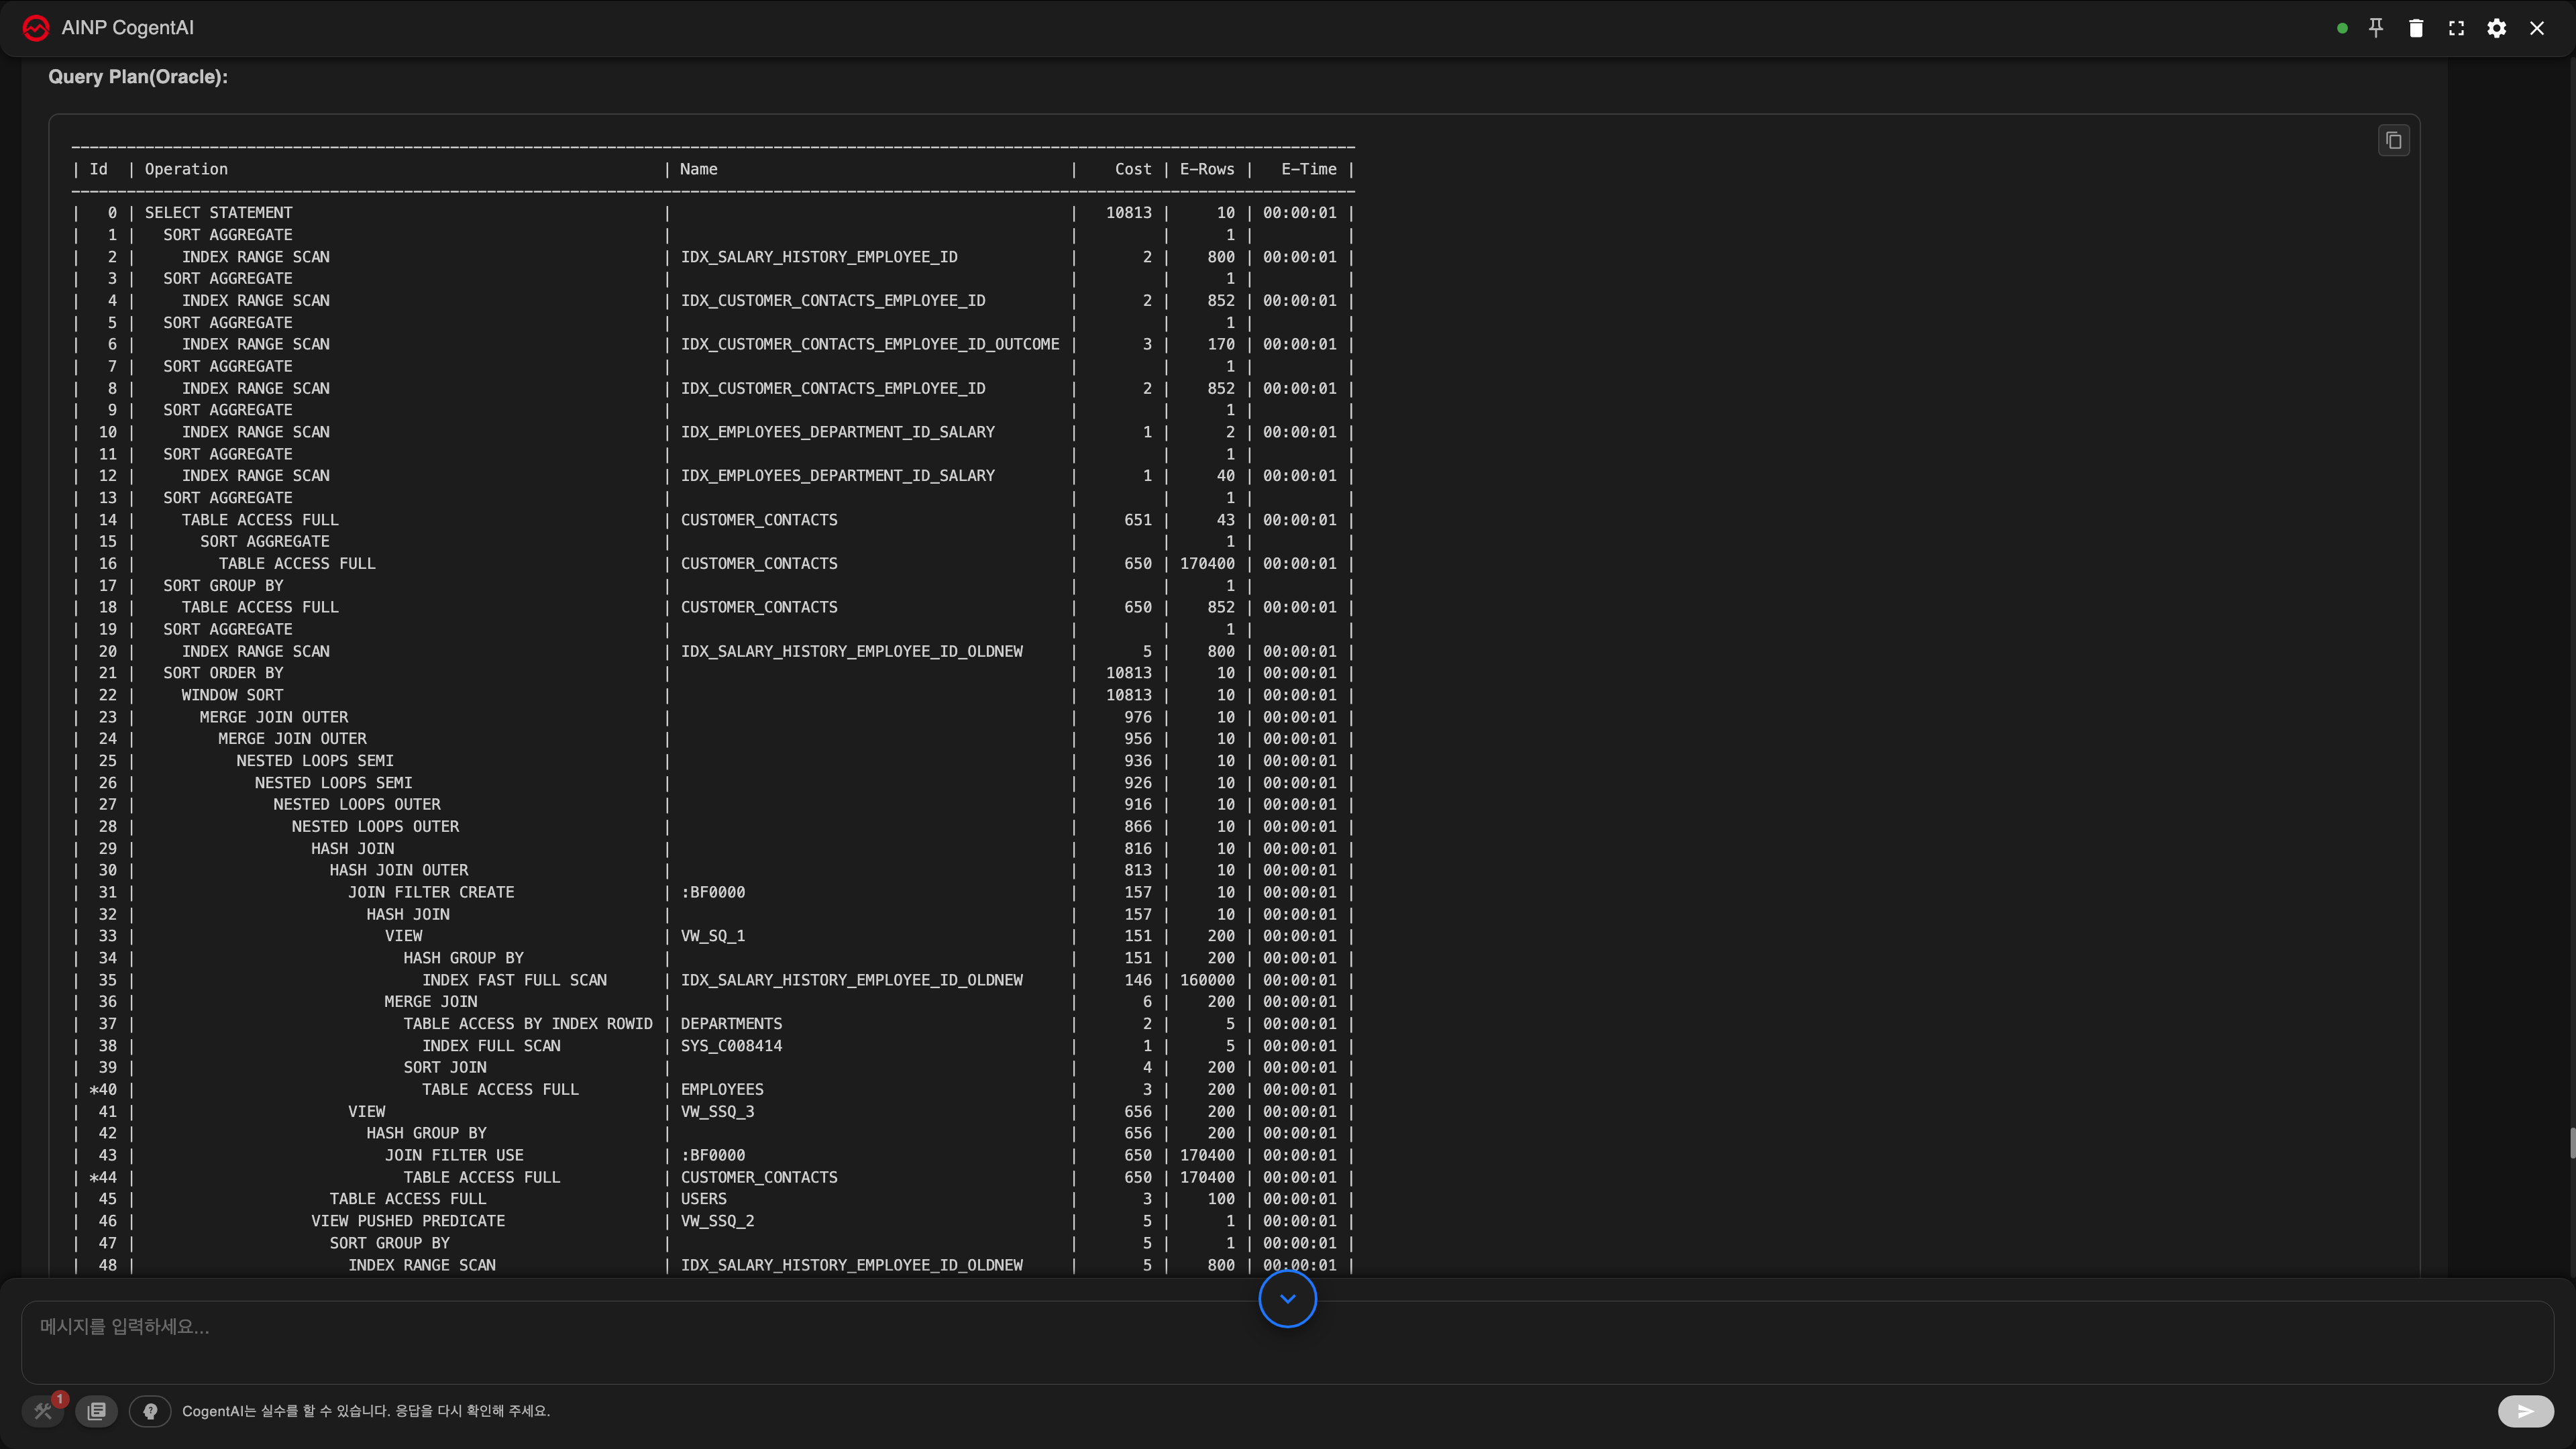
1) The execution plan -- the visualization chart and the table
The Query Execution Plan visualization at the top of the panel shows the execution plan as a tree. Nodes with a high cost are highlighted in colour, and hovering over a node shows its cost, estimated rows, and severity -- TABLE ACCESS FULL (a full scan) or a node with critical severity is the suspect. The same content is also provided as the query plan table (operation, cost, E-Rows, E-Time), so if you are comfortable with EXPLAIN output you can read the table directly.
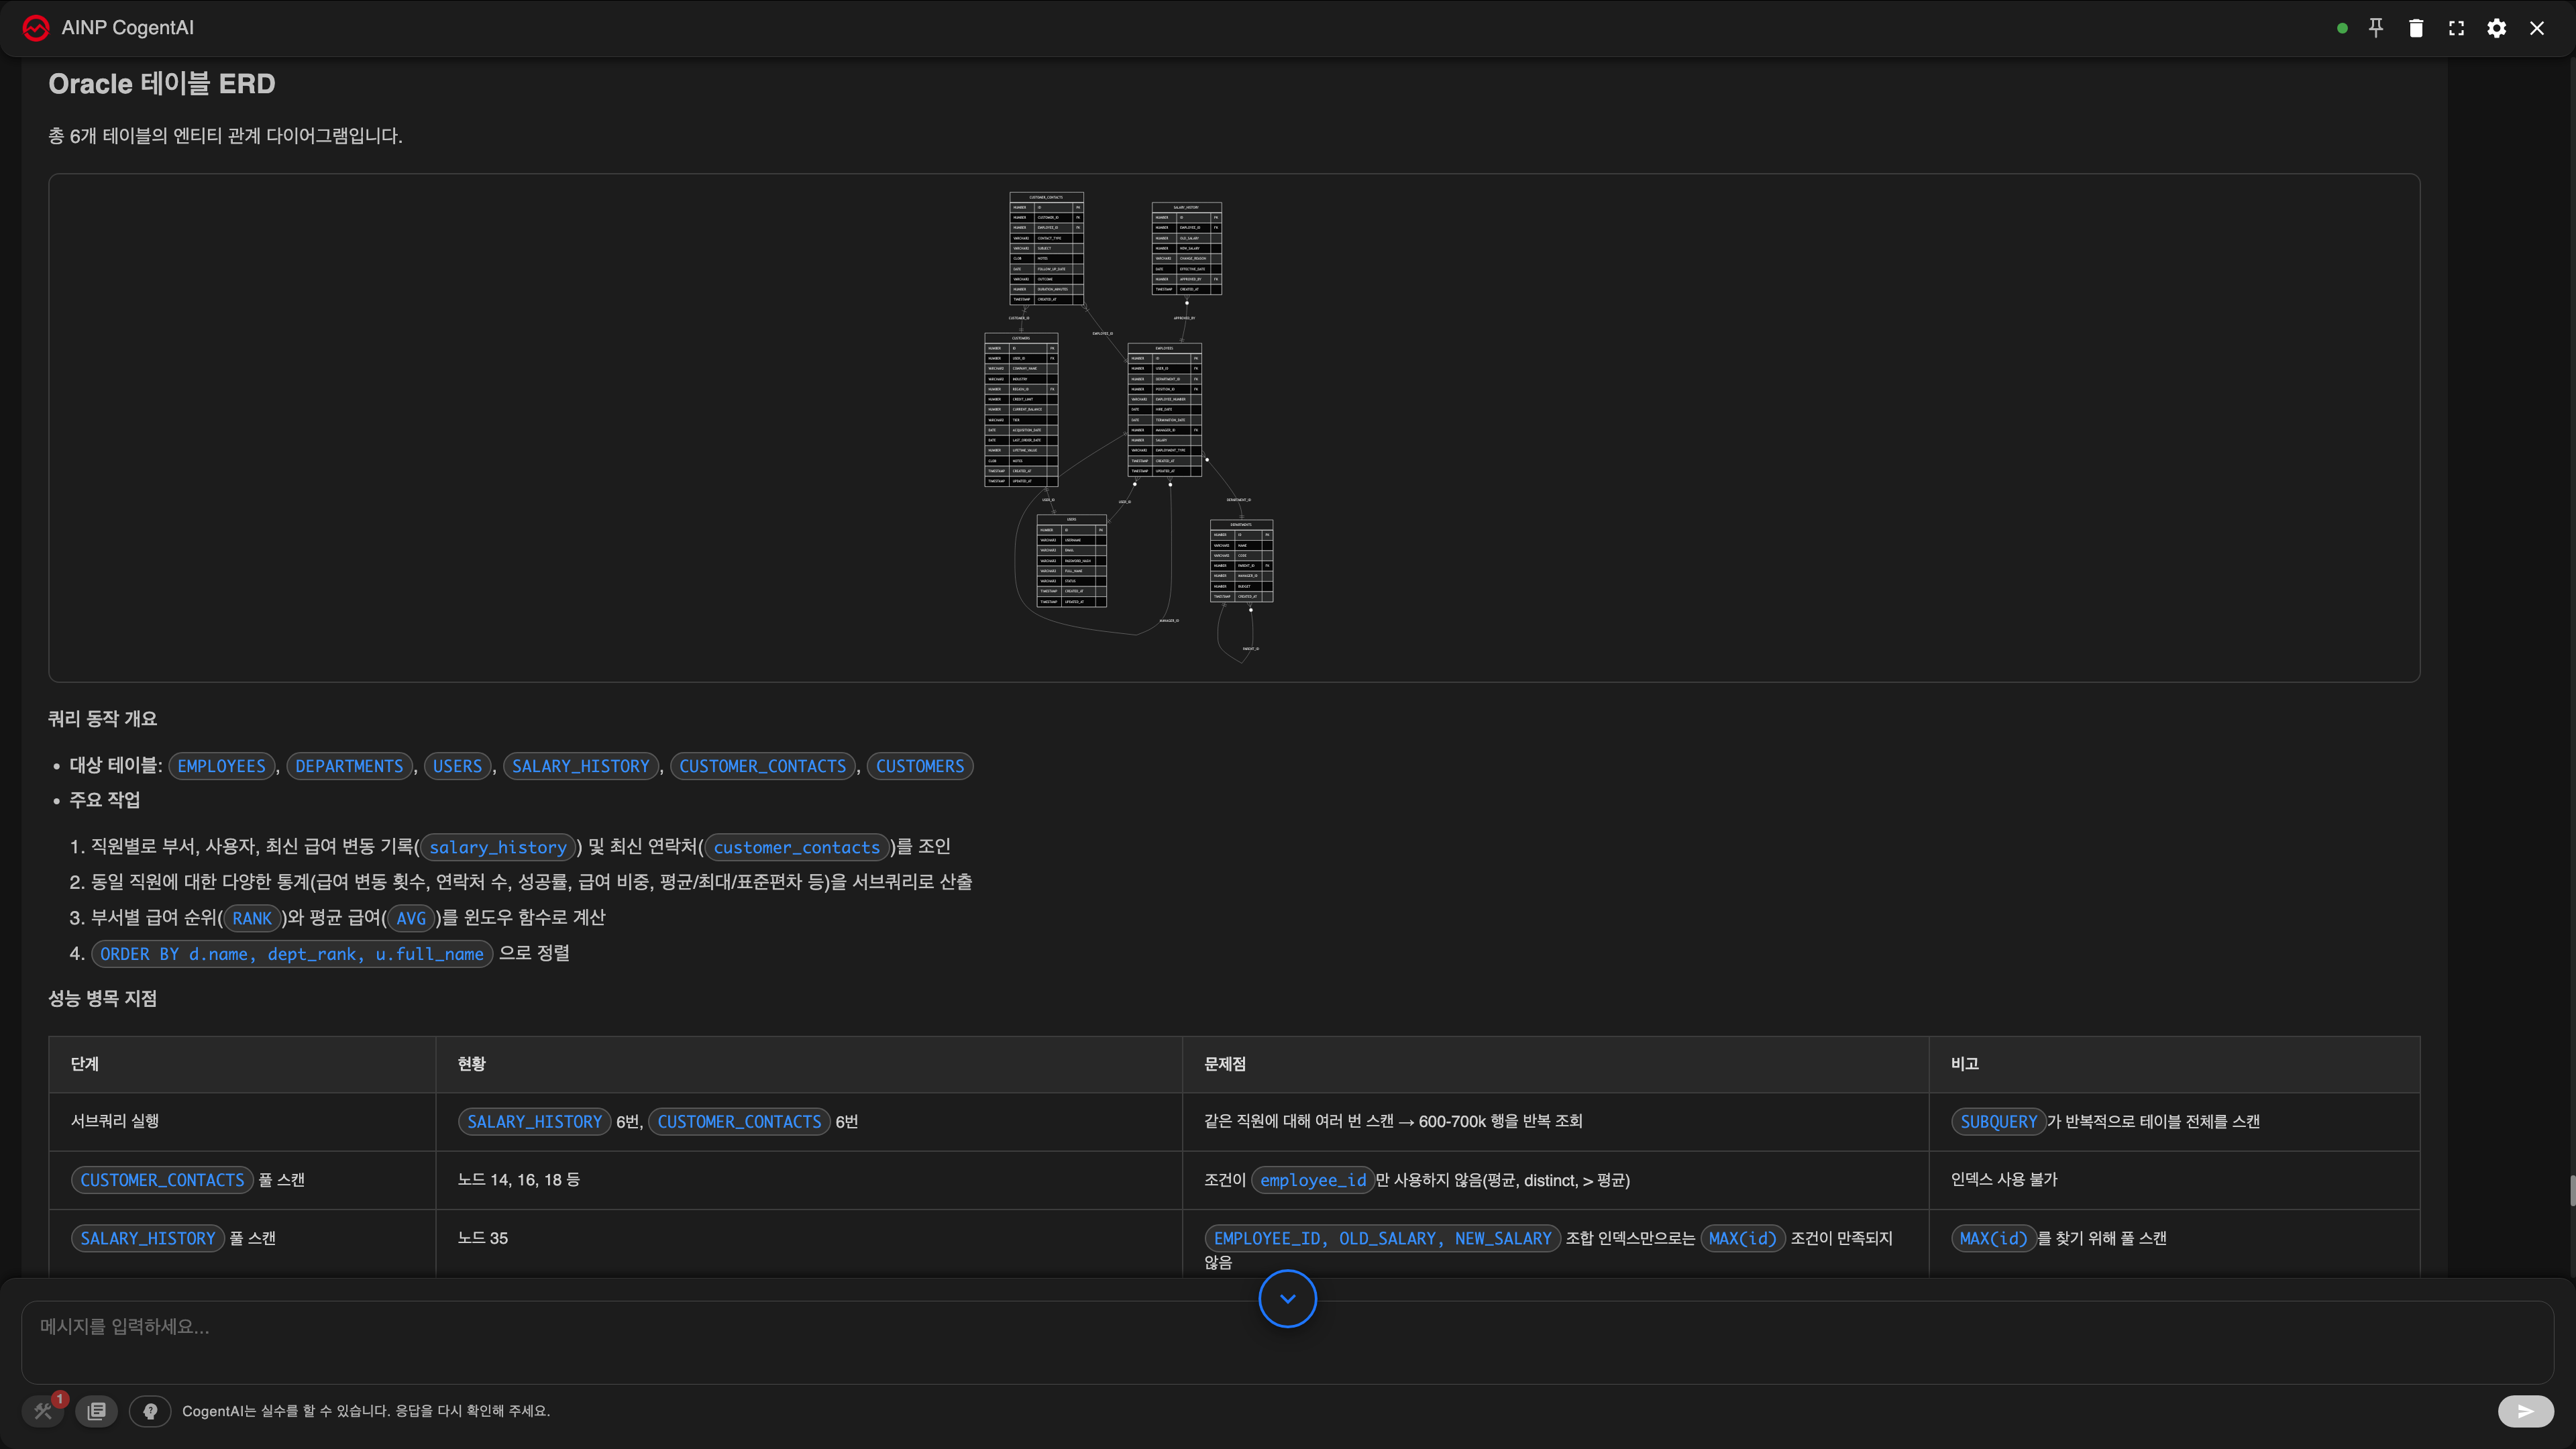
2) The table structure (ERD) and the bottleneck
Together with an entity relationship diagram (ERD) of the tables under analysis, it points out what the query does (joins, aggregation, sorting) and the performance bottleneck in a step-by-step table -- which scan repeats how many times, and why an index is not used, are set out here.
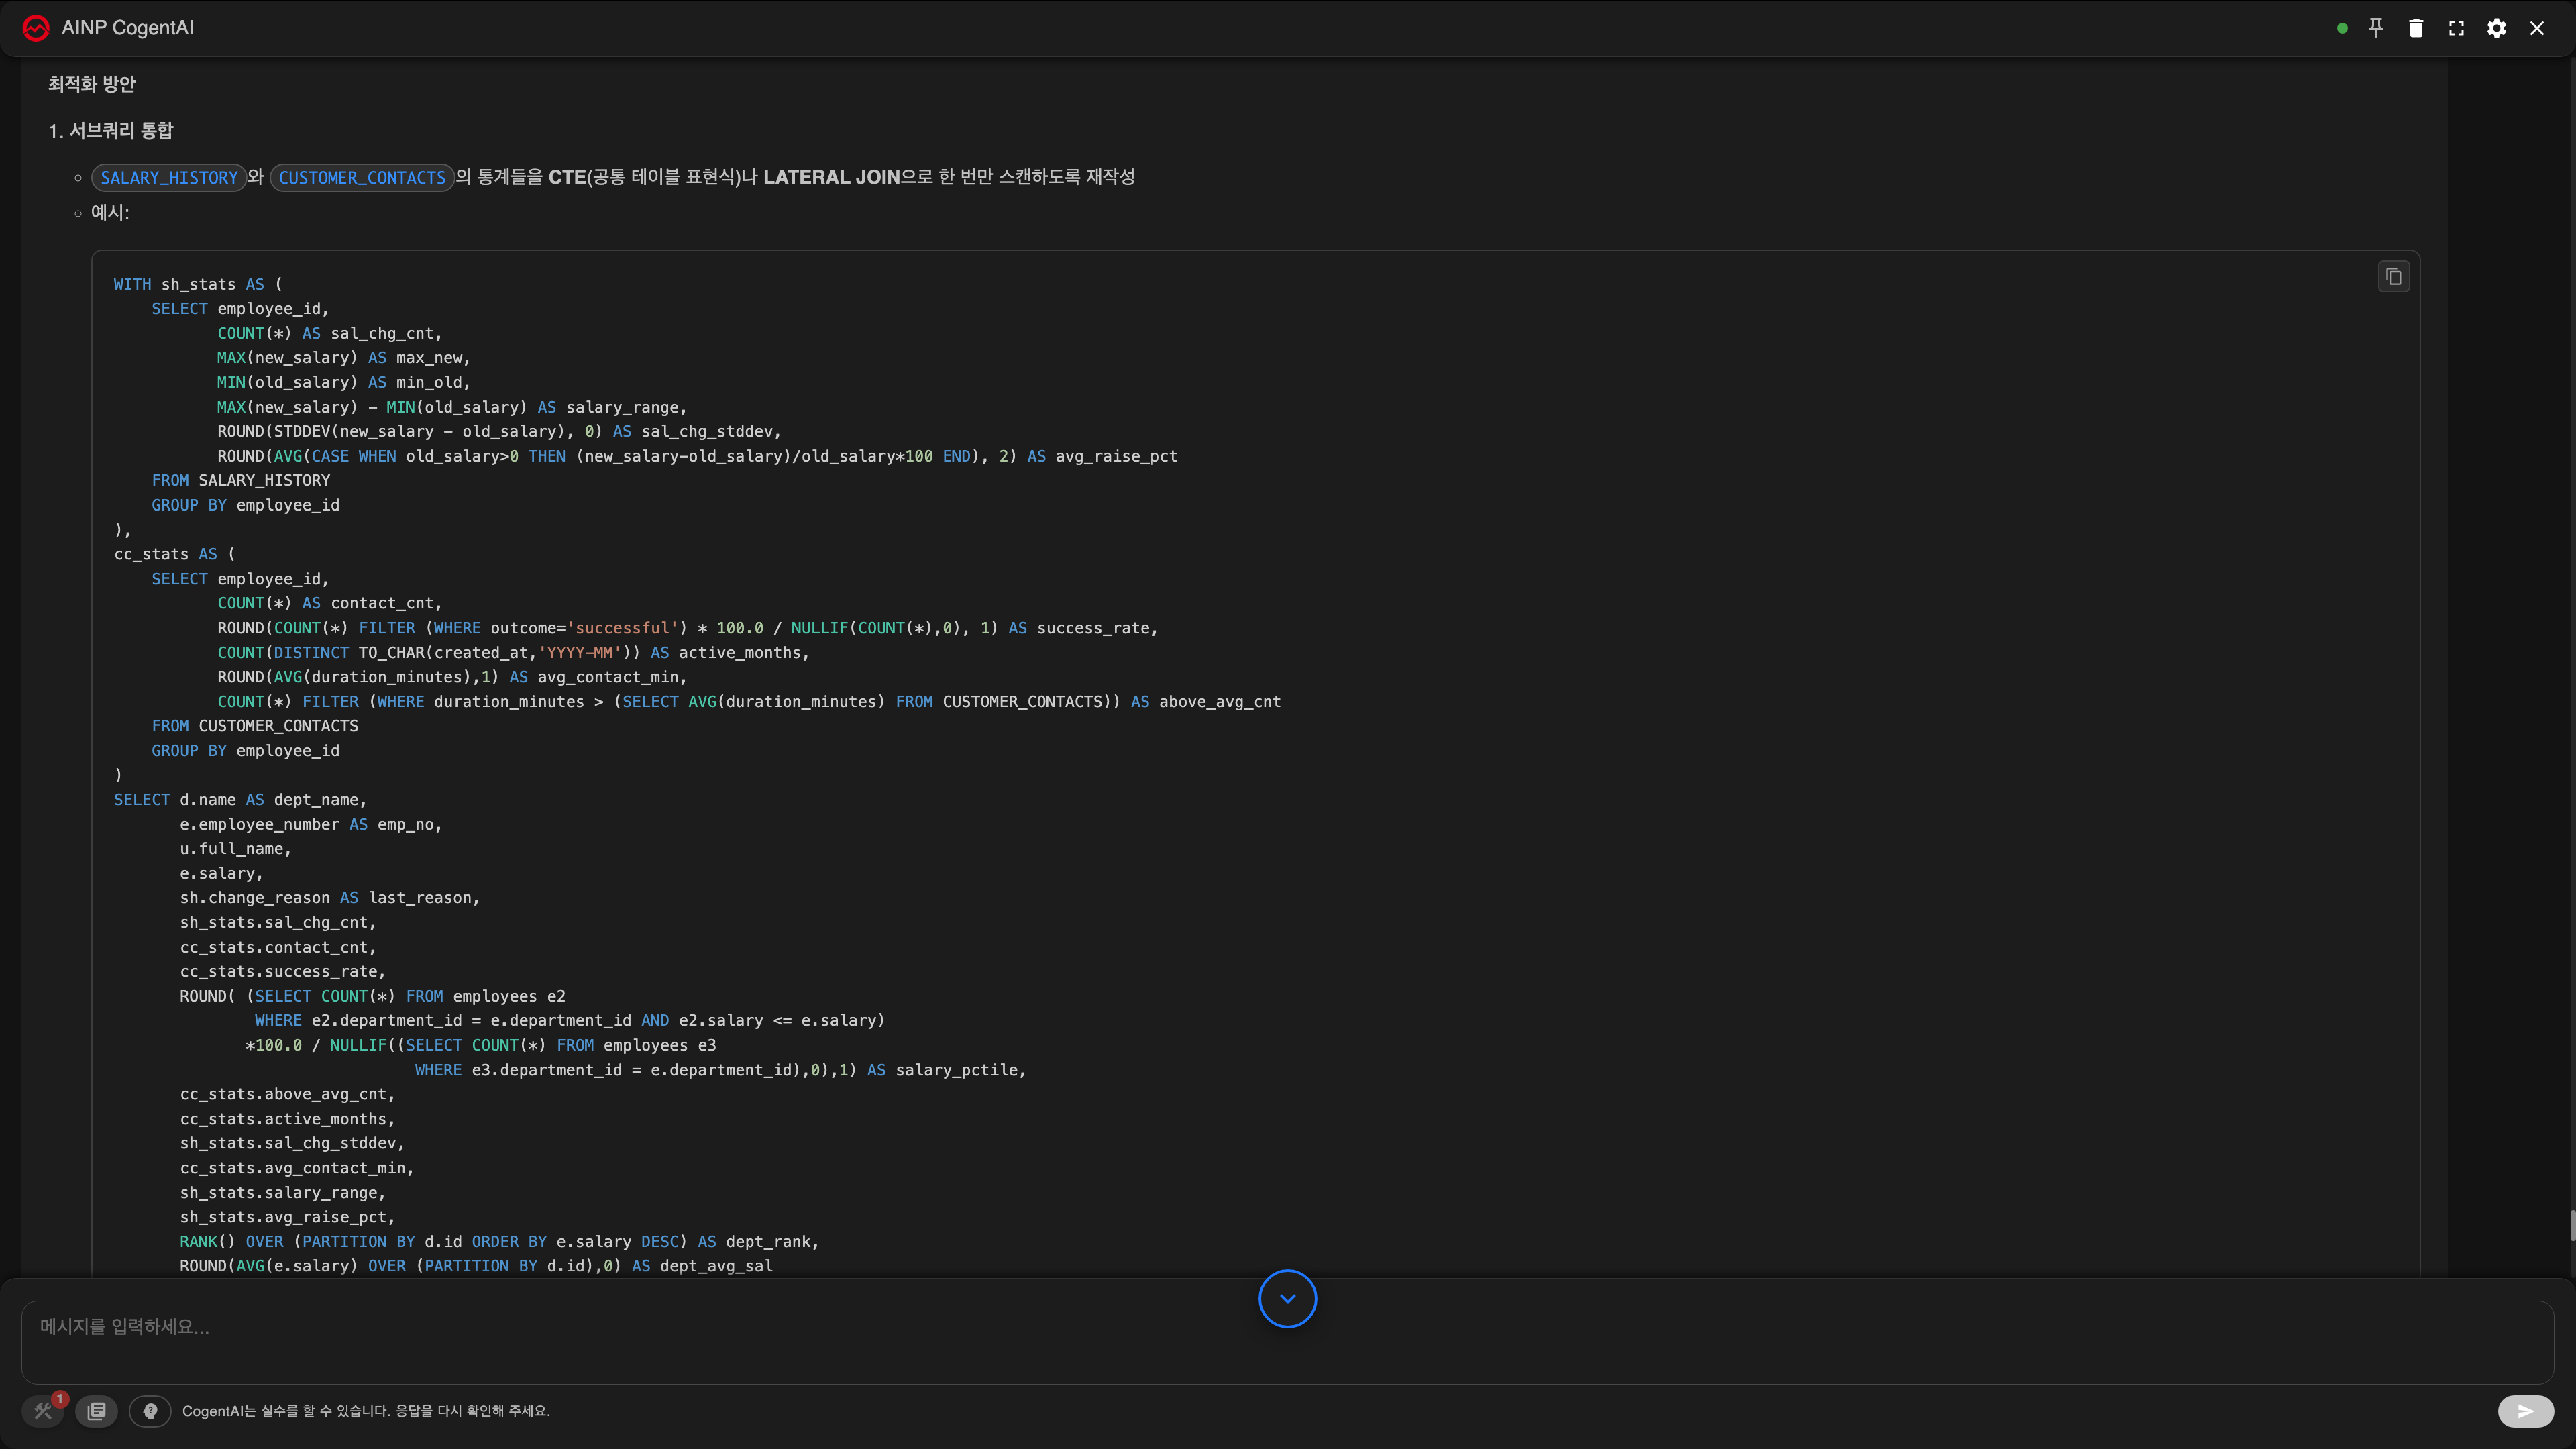
3) The optimization -- an improved SQL statement and index suggestions
Following the bottleneck analysis, it offers a rewritten SQL statement (consolidating subqueries into a CTE, for example), a list of recommended indexes, and the expected improvement from applying them (for example, "currently 3,086 ms → expected to fall to about a fifth").
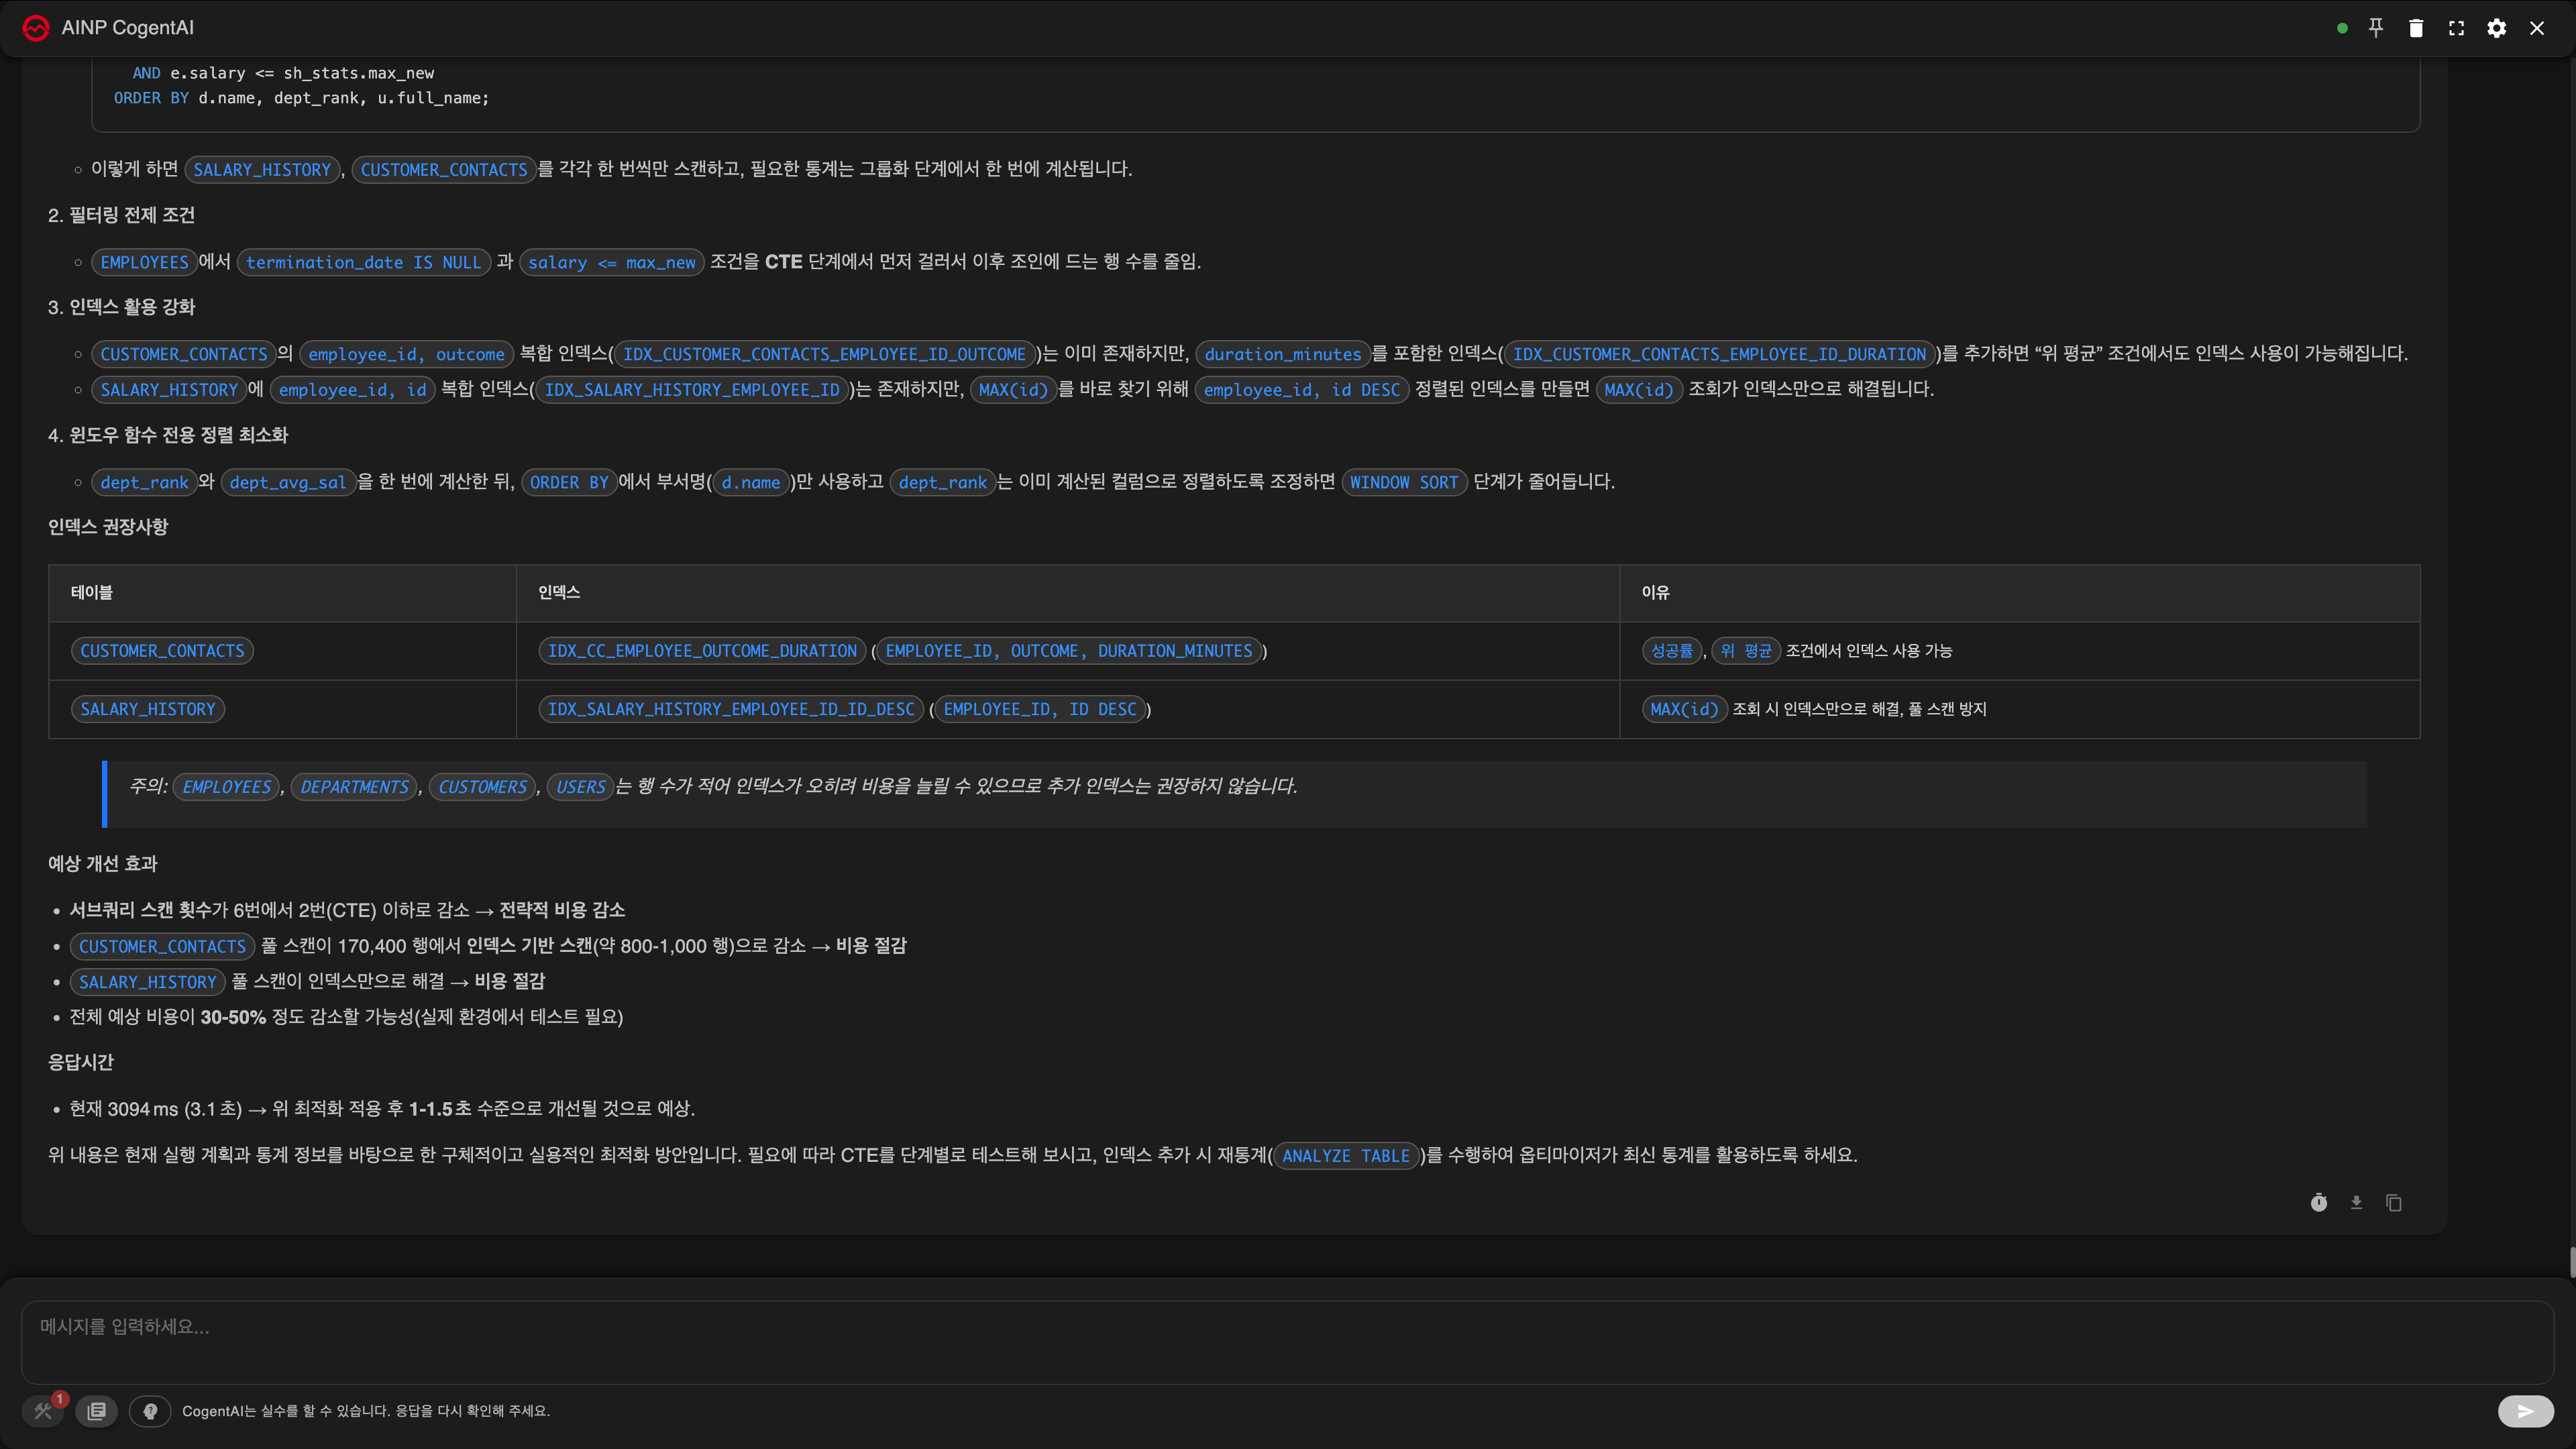
Note On what basis? The AI looks at that SQL's execution plan plus table and index statistics plus issue detection (full scans, missing indexes) and goes as far as suggesting indexes. What is the impact on production? The console's AI Query Diagnosis only runs EXPLAIN (the estimated execution plan) and statistics queries and does not actually run the query, so the burden on the production database is minimal.
Note A SQL statement that failed (with its error message) can be sent for analysis as it is too, so it is also used for diagnosing the cause of an error. However, errors where the table or view does not exist (ORA-00942 and the like) cannot usefully be analysed, so the request is blocked and a notice toast appears.
How the Database Connection Is Chosen
CogentAI gets the execution plan through one connection registered in the DB MCP server (the server that CogentAI uses to connect to databases). OPENMARU APM reads the values needed to find that connection from the DB connection information (the JDBC URL) in the SQL dialog, and sends them with the request.
- Values that are sent: the database type, host, port, and database name. For Oracle, the SID or the service name is also sent. For MS SQL Server, the instance name is also sent.
- URL without a port: the default port for the database type is sent (MySQL and MariaDB 3306, PostgreSQL 5432, Oracle 1521, MS SQL Server 1433, CUBRID 33000).
- Values that are not sent: account details (user name and password) are not sent. The host and port are not put in the AI question text. They are sent only as separate fields.
- How the connection is found: the DB MCP server looks for a connection with the same type, port, and database name, and the same host. If the host is written differently (an IP address and a host name, for example), it uses DNS to check whether the IP addresses are the same.
localhost,127.0.0.1, and short host names without a dot are not compared by IP address. - Result: the analysis runs only when exactly one connection matches. The answer shows the name of the connection that was analysed.
Supported databases: MySQL, MariaDB, PostgreSQL, Oracle, MS SQL Server (including the jTDS driver), and CUBRID.
- A JDBC URL wrapped by log4jdbc or p6spy is read as the URL of the inner driver.
- For a URL with more than one host (MySQL multiple hosts, several ADDRESS entries in an Oracle TNS description), only the first host is used.
- For other databases (DB2 and so on), or when the JDBC URL has no host, the request is not sent and a notice toast appears.
When no connection is found: if no connection matches, or more than one matches, CogentAI does not run the analysis and answers with an error. The error contains the values that APM sent (type, host, port, database) and a list of candidate connections (connection name, host, port, database). Check them in this order.
- In the candidate list, find the connection that points to the same database as the one APM sent.
- Compare the host, port, and database name of that connection (for Oracle, the service name or SID) with the values that APM sent, one by one.
- If a value is different, change the DB MCP connection settings to the same value as the JDBC URL that APM sees.
- If more than one connection points to the same database, keep only one, or register the hosts so that they are different.
Caution In the DB MCP connection settings, register host, port, and database (for Oracle, service or sid) with the same values as the JDBC URL that the application uses. For example, if the application connects with
jdbc:mysql://10.90.0.10:3306/egovdb, register the DB MCP connection with host10.90.0.10, port3306, and databaseegovdb. A short host name without a dot, such as a Kubernetes service name, is not compared by IP address, so it must be exactly the same text.
Note This works with a CogentAI version that finds the connection from the JDBC details. An earlier CogentAI uses the connection registered with the same name as the database type (for example,
mysql).
Caution The AI's suggestions (creating an index and so on) are a starting point. Before applying them, cross-check the DBMS metrics and the execution plan against R2.3 DBMS Charts and a DBA review.
Part 3. Thread Dump → Analysis with AI
When "the instance is alive but there is no response, or it is slow" (a hang or a stall), take a thread dump to see what the threads were doing when they stalled, and have the AI analyse it.
Step 6 — Taking a Thread Dump
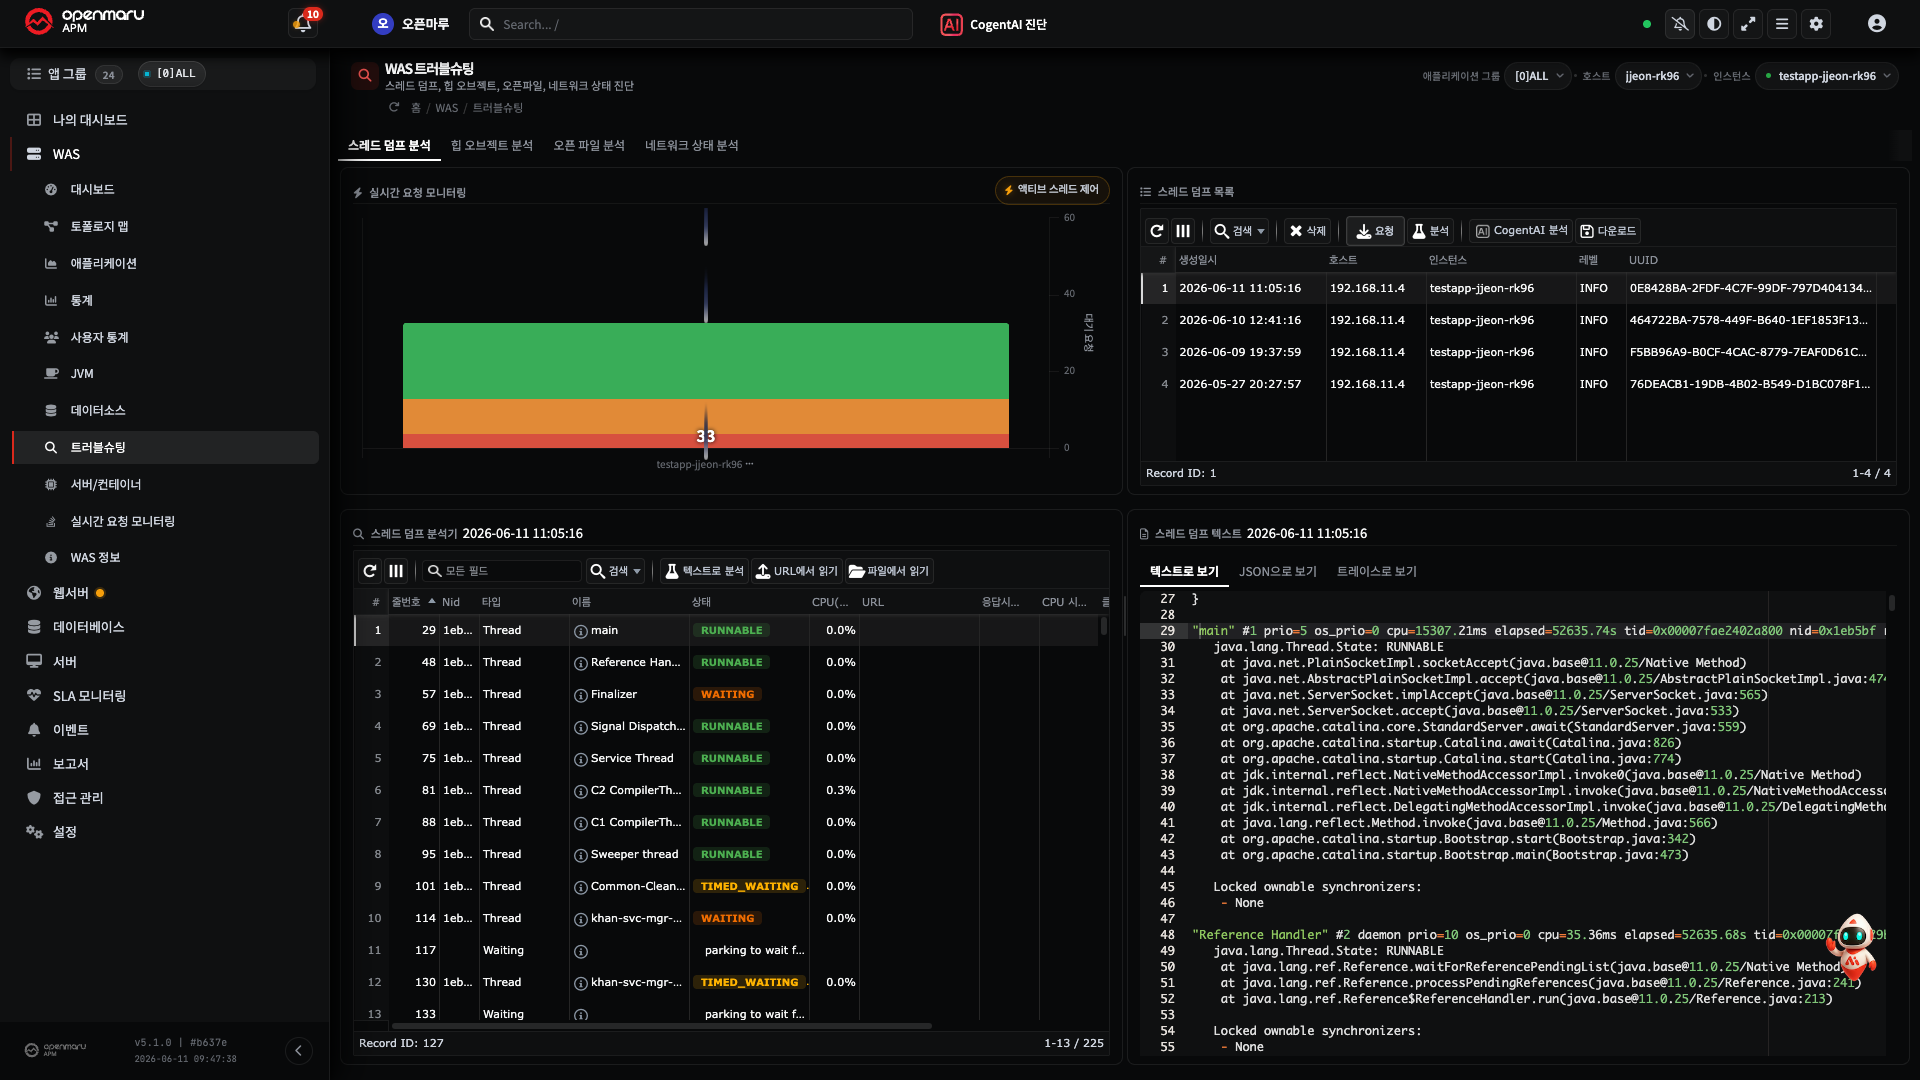
- Go to left menu ▸ WAS ▸ Troubleshooting and open the Thread Dump Analysis tab. Choose the instance to diagnose at the top. (The same screen also has heap object, open files, network state, and active thread control tabs.)
- Choose a dump from the thread dump list (or click the Request button for a new one).
- The thread dump analyser shows the thread list and their states (Runnable, Blocked, Waiting, Timed waiting, and so on). Choosing a thread shows its detailed stack in the thread detail analysis on the right.
Result -- you have the threads that are stalled now and their stacks.
Note Many blocked suggests lock contention, and many waiting suggests thread pool exhaustion (E3.2). A dump is sometimes collected automatically when a deadlock or OOM event occurs (R3).
Step 7 — Analysing the Dump with AI
- Press the CogentAI Analysis button in the thread dump list toolbar.
- The AI summarizes and analyses the dump and points out the common stack, whether there is a deadlock, and the call targets taking a long time.
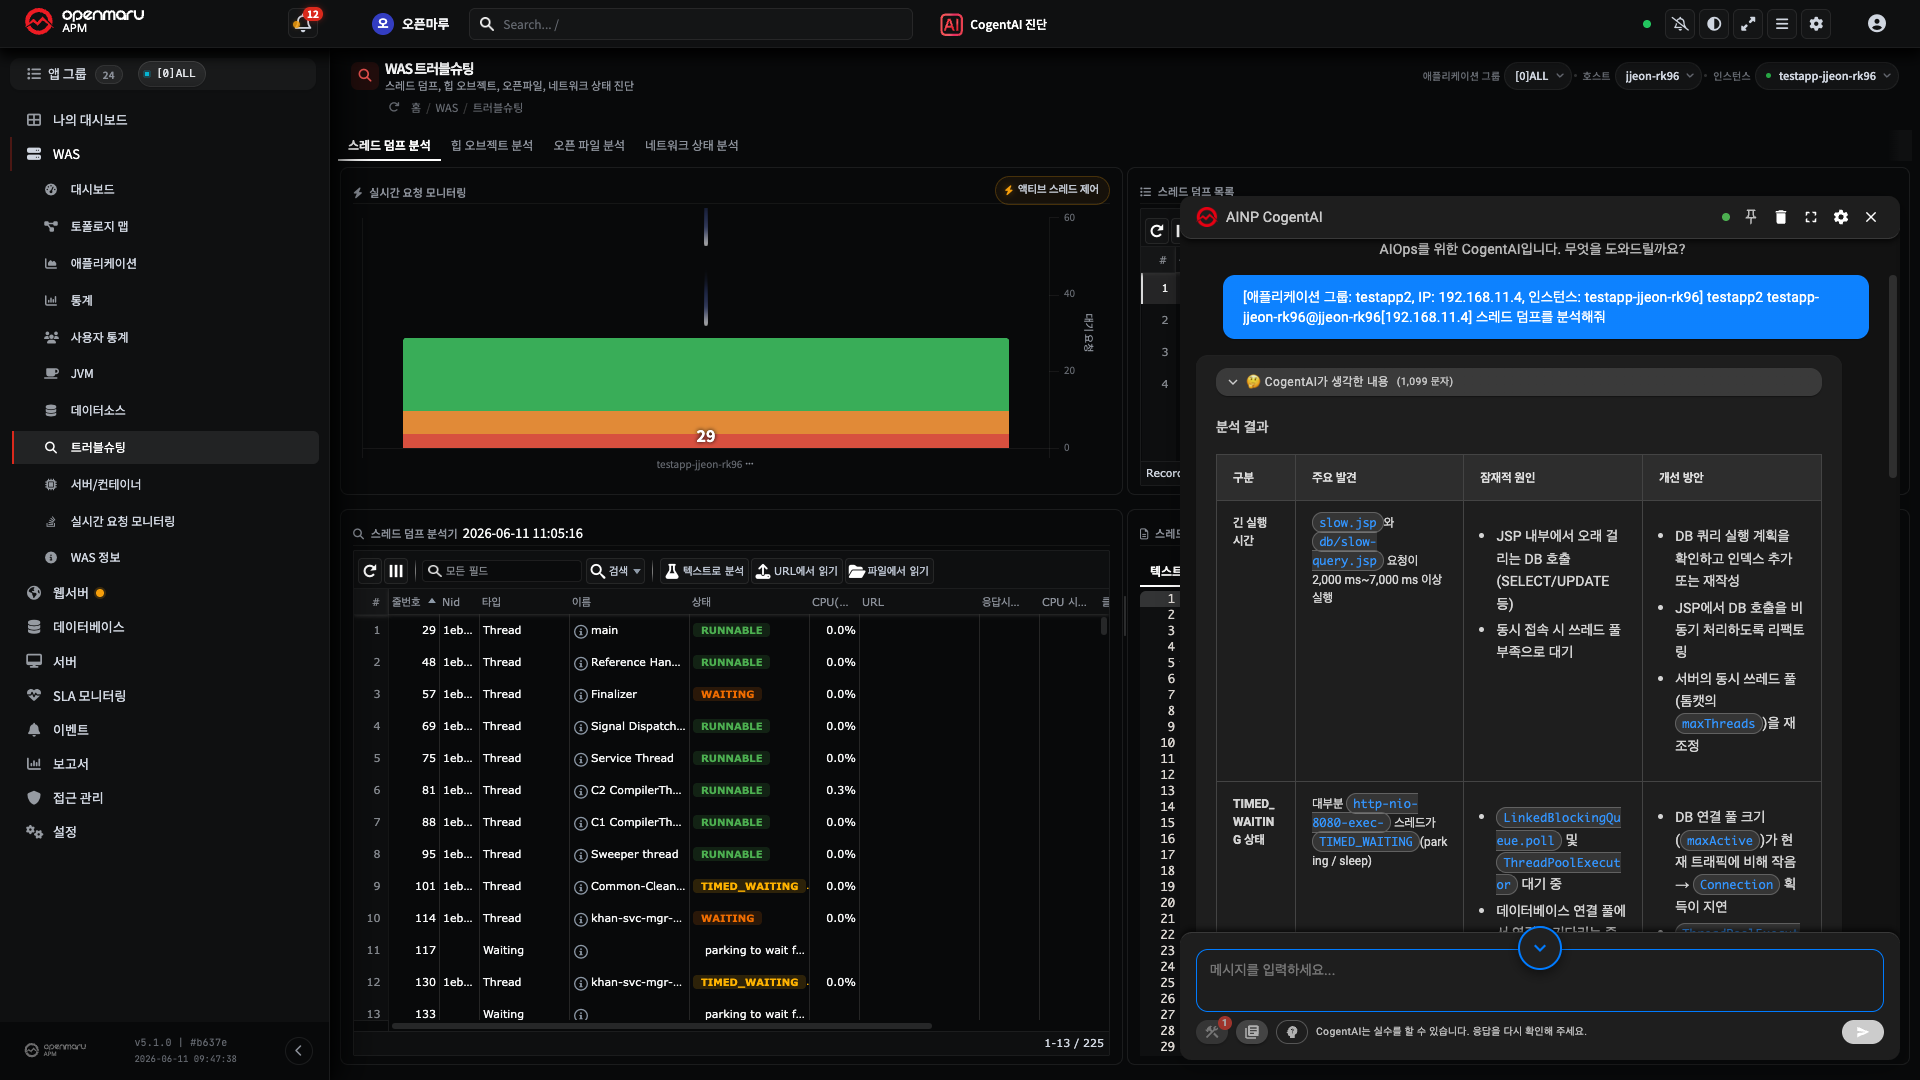
Result -- without reading hundreds of threads one by one, the AI picks out the thread groups by state and the related classes and candidate causes in a table, as in the screen above. Check the common cause of the stall first, then cross-check that thread's stack in the analyser from step 6.
Heap object analysis (for memory leaks) can be obtained the same way → H7. Checking for a Memory Leak · H20. Checking Agents.
Part 4. The Alert Centre and Event List → AI Analysis of an Event
When a threshold is passed or a state changes, the system records that occurrence as an event. When an event leaves you stuck, you can have the AI analyse that one event straight away.
Step 8 — Opening the Alert Centre and the Event List
- The alert centre -- the bell icon on the right of the header quickly shows the critical and warning alerts that have just occurred. (A red badge appears on the bell when there is a critical alert.)
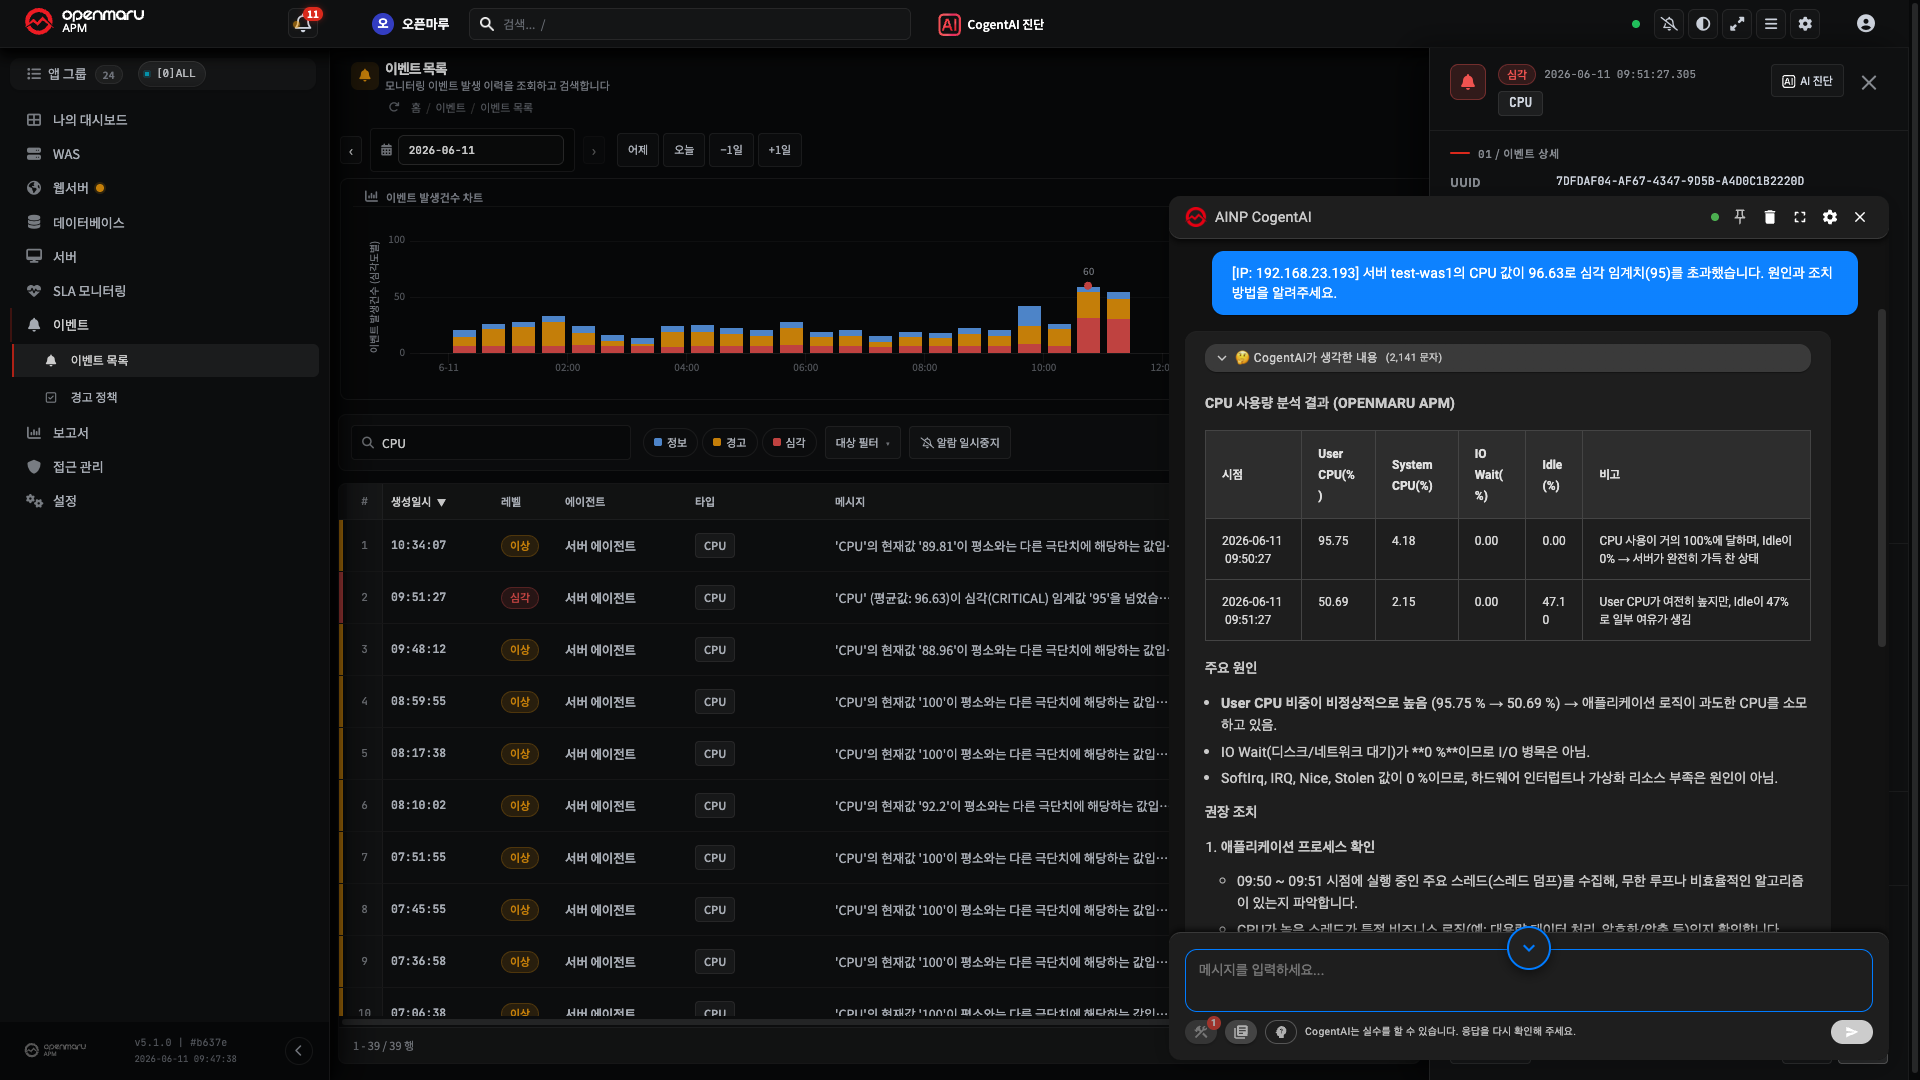
- The event list -- see every event at left menu ▸ Event. It is organized by level (critical, warning, information), time of occurrence, kind, target, and message, with a bar chart at the top showing the volume by time of day.
- Clicking an event row opens a detail drawer on the right showing the kind, target (instance/host), and message together with the what / why / impact / checks description.
Step 9 — Analysing the Event with AI
- Press the AI icon on the right of the event row, or the AI Diagnose button in the detail drawer header.
- That event's kind, level, target, and message (plus any automatically collected thread dump or diagnostic data, as for a deadlock or OOM) are passed to CogentAI together.
- The AI reports a hypothesis for the cause of that event and the next things to check in plain language.
Result -- even a baffling event can be asked, on the spot, "why did this happen and what should I look at first".
Note For an event where a dump was collected automatically, such as a deadlock or an OOM, that dump is analysed too and the answer is more specific. The meaning and points to investigate per kind of event are in R3. Event Reference.
Done — What You Can Now Do
- Have the whole selected group's cause analysed at once with AI Diagnose in the header
- Have the SQL of a slow transaction analysed as far as the execution plan and indexes with AI Query Diagnosis
- Take a thread dump to see the stalled threads, and have CogentAI analyse that dump
- Have one event analysed with AI Diagnose from the alert centre or event list
- Cross-check an AI answer against the charts and reference before deciding on an action
Next Steps
| What you want to do | Guide |
|---|---|
| The full set of AI buttons (header, chart, transaction, event) | H14. Getting AI Analysis of Charts and Events |
| Diagnosing a memory leak (heap, GC, heap dump) | H7. Checking for a Memory Leak |
| Checking an unresponsive agent or its connection | H20. Checking Agent Status |
| The 20 slow transaction patterns | H6. Finding the Cause of a Slow Transaction |