H14. Getting AI Analysis of Charts and Events (CogentAI)
Diátaxis: How-to · Audience: operators / administrators ← Back to contents
OPENMARU APM can hand the charts and events on the screen to CogentAI and get, in plain language, what is wrong and what to look at next. Where H5 to H8 are "how a person reads it", this document is how to hand that judgement to the AI first.
Prerequisite The AI buttons are visible only when an administrator has turned them on (the
cogent.ai.usesetting). If a button is not visible it is disabled, so ask an administrator.
The AI buttons are in different places depending on what is analysed. Decide what you want to diagnose first and use the matching button.
| Button location | What is analysed | The question it asks |
|---|---|---|
| "AI Diagnose" on the right of the header | The whole selected app group | "Is the system generally all right now?" |
| The AI icon on a chart card | The metric of that one chart | "Why does this chart look like this?" |
| The AI button in the transaction detail | One transaction | "Why was this request slow, or why did it fail?" |
| The AI icon on an event row | That one event | "What caused this event and what should be done?" |
Opening the AI Assistant from the Header — a Comprehensive Diagnosis of the Whole System
This is the widest-reaching button. Press "AI Diagnose" (the CogentAI icon plus the label) on the right of the top of the screen (the header).
- Click the AI Diagnose button in the header. (Hovering shows "Is anything wrong with the system now -- AI diagnosis".)
- The CogentAI widget opens and automatically asks about the operating state of the whole app group currently selected -- "Analyse the current situation and tell me whether there is any problem with the [group name] application and system."
- The AI checks the group overall (application and system) and reports the anomalies and its recommendations in plain language.
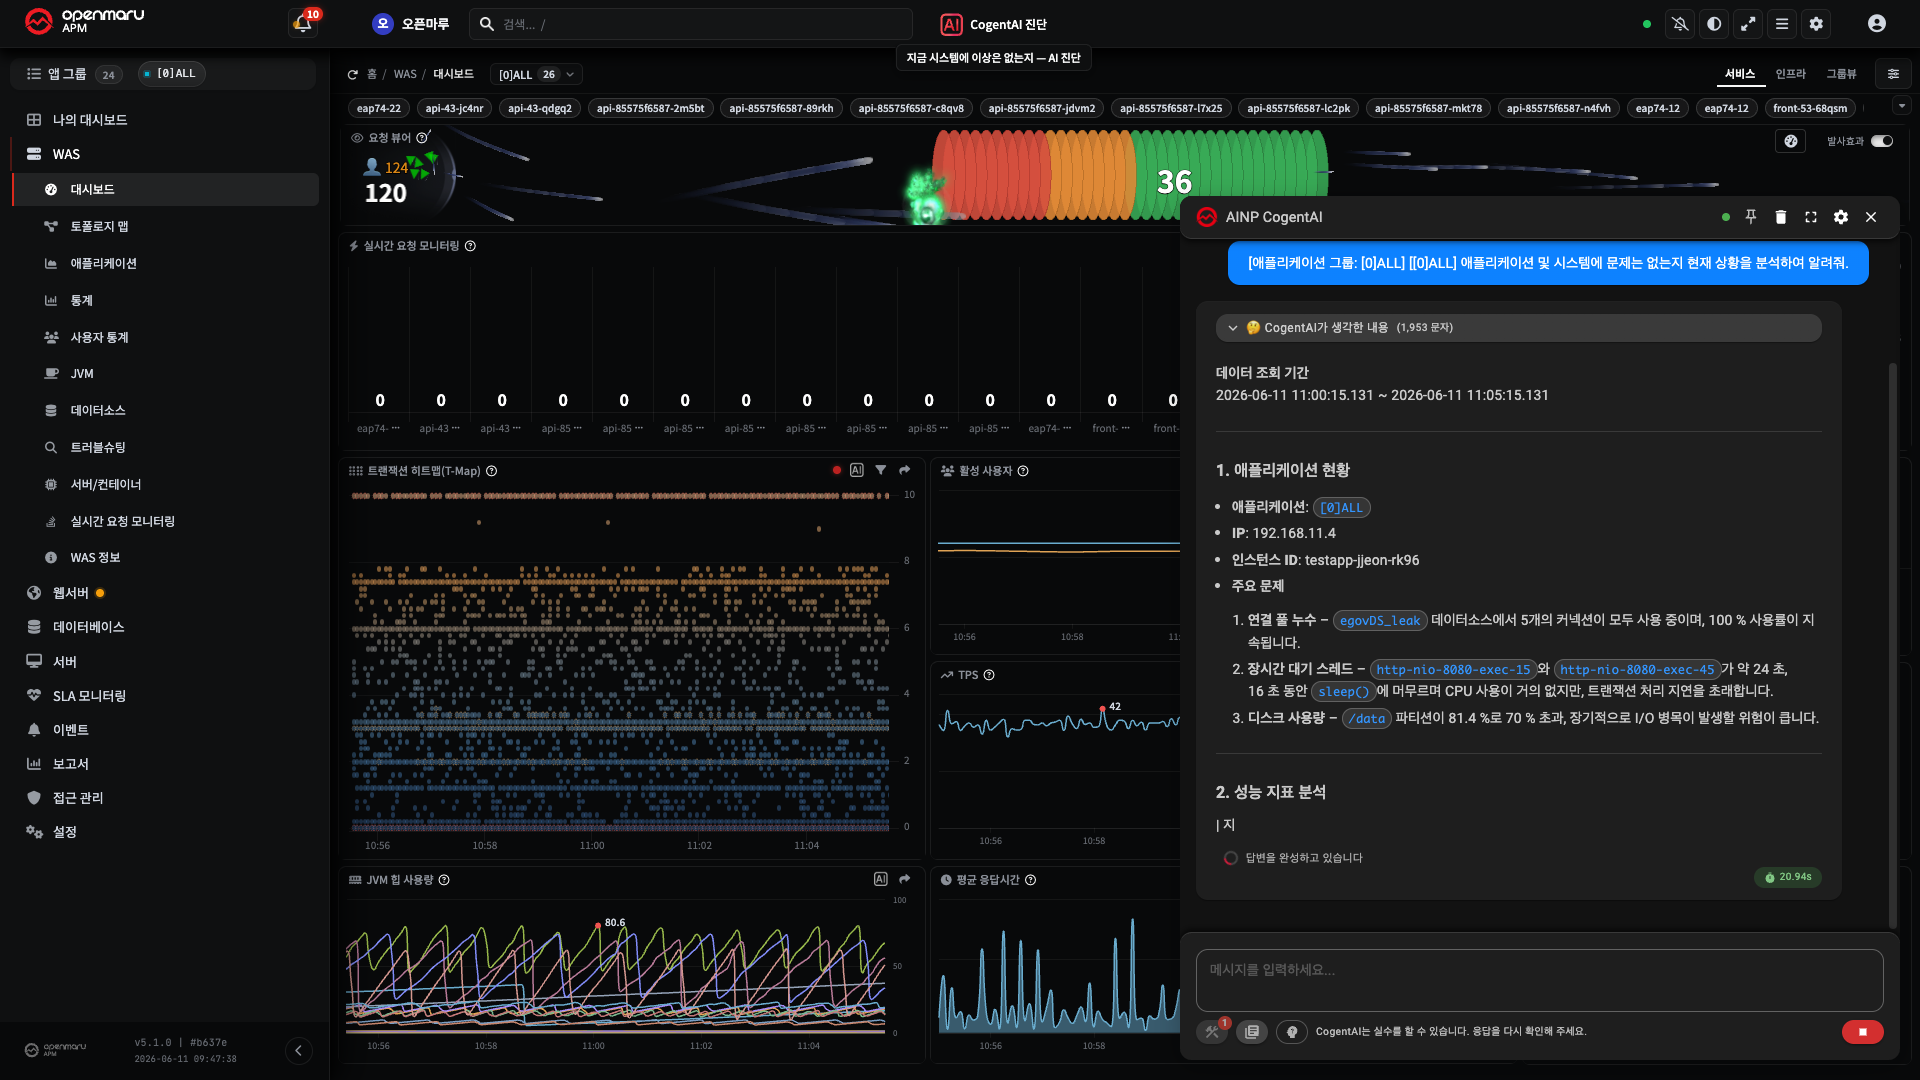
Note This button always looks at the whole selected app group, regardless of the tab you are on. To look at one chart only, use the chart card AI button below.
To change the group being analysed, choose the group in the context selector first → H1.
The AI Button beside a Chart — Analysing a Metric on the Spot
When an individual chart looks wrong, pressing the AI icon inside that chart card analyses that chart alone closely.
- Click the AI icon at the top right of the chart card to analyse. (Hovering shows "CogentAI Analysis".)
- That chart's title, metric data, target (host/instance), and chart image are passed to the AI together. (Past and daily intervals are summarized as 10-minute averages before sending.)
- The AI offers an interpretation and the next checks, along the lines of "this chart is in a … state; check … as well".
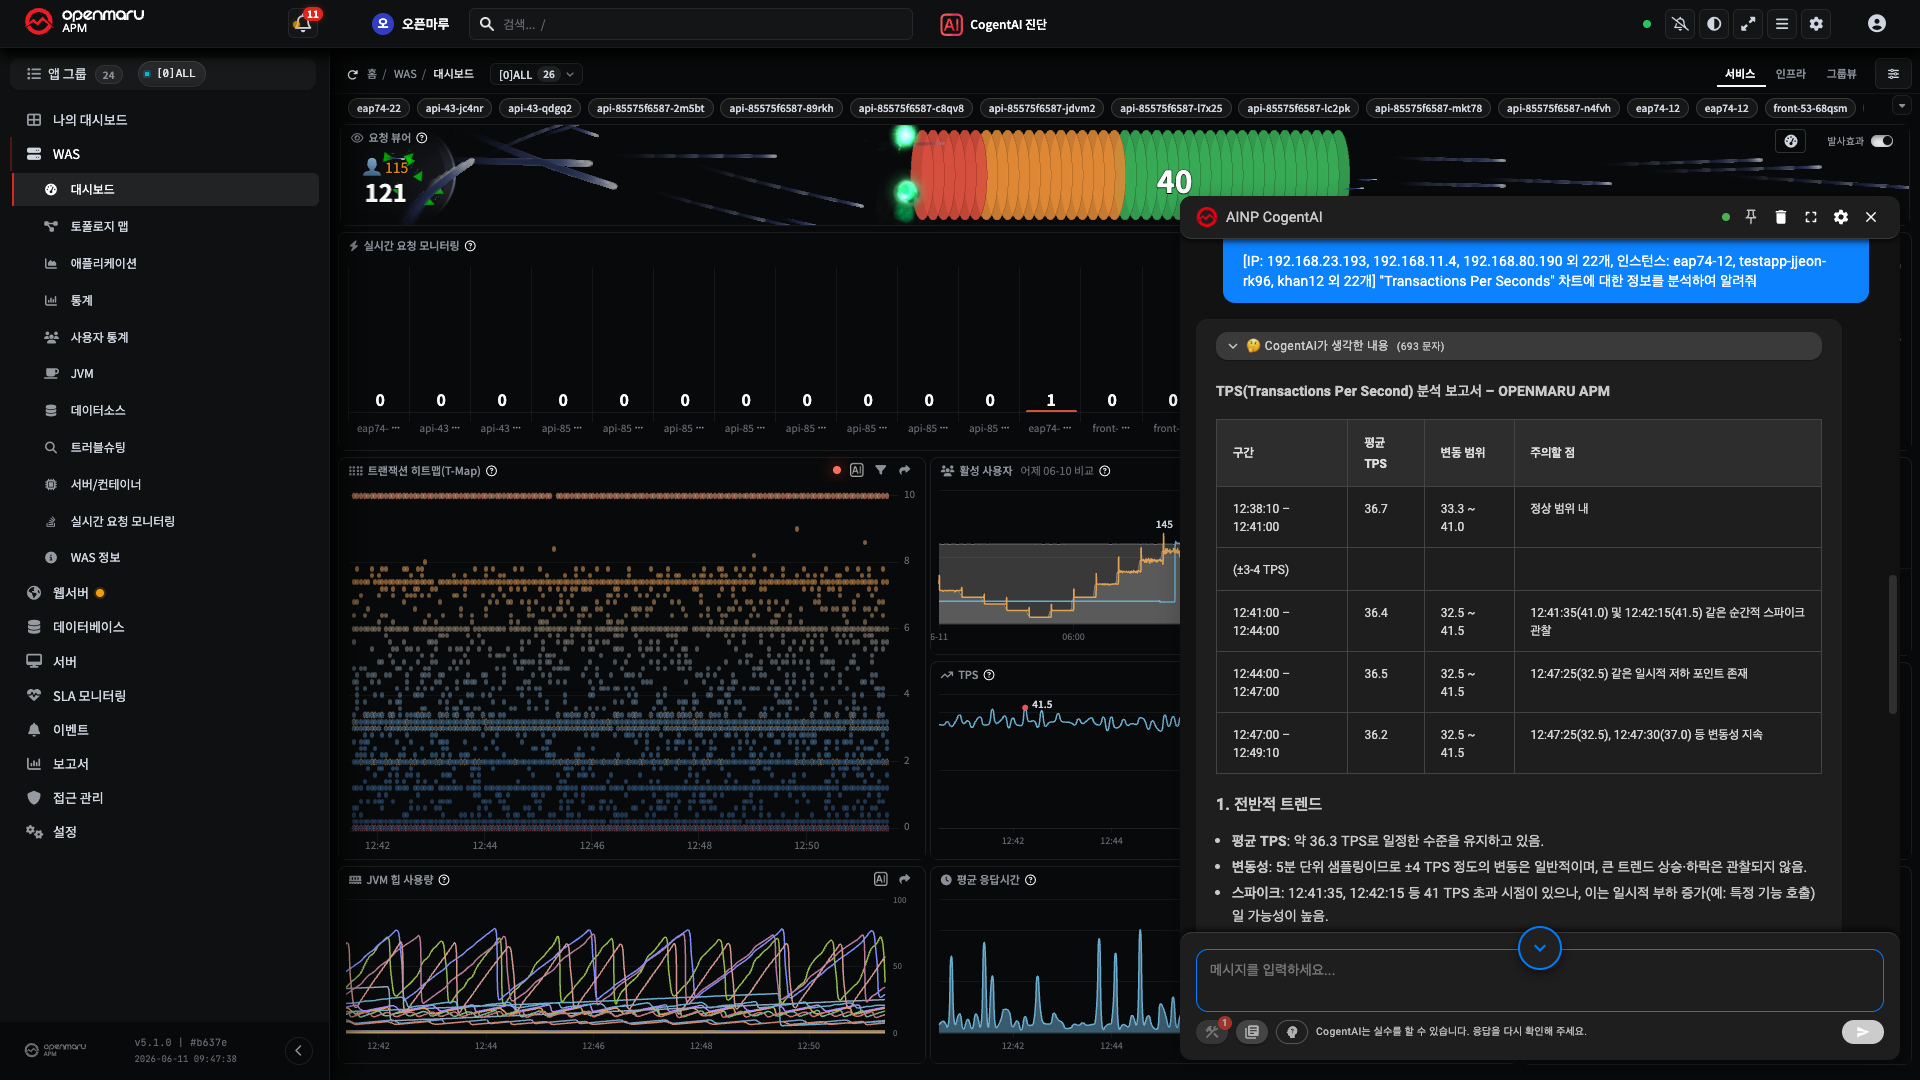
Note It is particularly useful on charts where interpreting the shape is the point, such as the JVM heap chart in H6 and the CPU and disk charts in H8. Use it as a first screening by AI before a person confirms against the R2 thresholds.
AI Analysis of an Event
When the cause of an event is not obvious, have that one event analysed with the event's AI icon.
- Press the AI icon on the event row in the event list, or open the event and use the AI analysis in the detail drawer.
- That event's kind, level, target, and message (and any additional data such as a thread dump or a diagnostic response) are passed to the AI together.
- The AI offers an estimate of the cause and a direction for action.
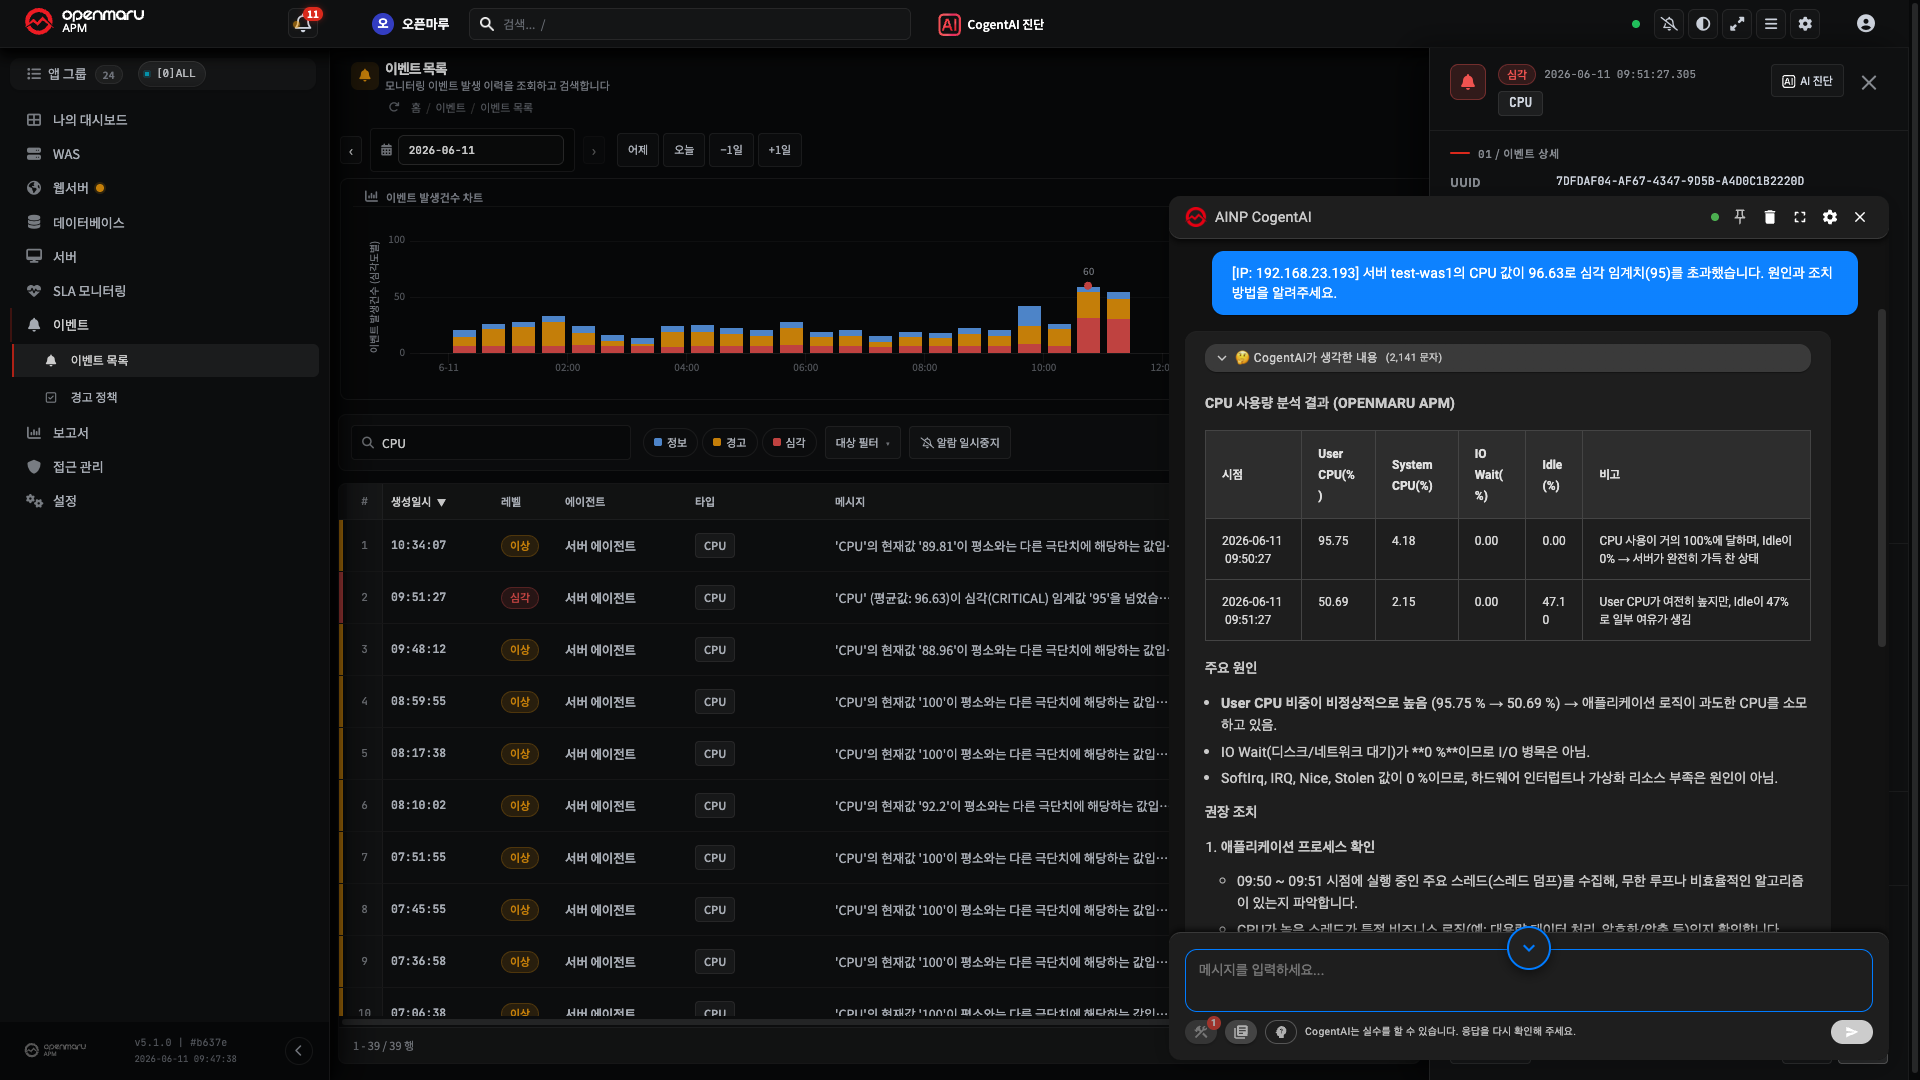
For an event where a dump was collected automatically, such as a deadlock or an OOM, that dump is analysed too and the answer can be more specific. For the meaning of each kind of event, see R3. Event Reference.
Tips and Limits of Using the AI
How to use it well
- Treat an AI answer as a starting point and cross-check the metrics it suggests against the R2 reference and the actual charts.
- Wide then narrow: look at the whole with AI Diagnose in the header, then narrow with the chart AI button for the area it points at.
- If the answer needs following up, continue with the human diagnostic procedures of H5 to H8.
Limits and cautions
- Caution -- the AI provides estimates. For actions that are hard to undo, such as a restart or a configuration change, a person should confirm the evidence before deciding.
- Guardrails and filters are applied to the AI to prevent risky or sensitive information being exposed -- some queries are deliberately restricted.
- If a button is not visible, an administrator has turned the feature off (
cogent.ai.use).
Related Documents
- H6 · H7 · H8 · H10 -- the procedures for diagnosing it yourself
- R2. Chart Metric Reference -- the thresholds for cross-checking an AI answer
- R3. Event Reference -- the meaning of events and the points to investigate