H13. Responding to Web Server (Apache) Worker Shortage and LB Outage
Diátaxis: How-to · Audience: operators / administrators ← Back to contents
On a web server (Apache and the like), requests are handled by workers. When every worker is busy, new requests wait or are refused, and when a load balancer (LB) worker group stops altogether, every request on that path fails (5xx). This document is the order for separating the two situations and responding, using the worker metrics on Web Server ▸ Web Performance / Dashboard and the LB events.
The thresholds per item on the web server charts are in R2.2 Web Server Charts, and the worker and LB events in R3.5 Web Server Load Balancer. If a WAS-side delay is suspected, see H6. Finding the Cause of a Slow Transaction.
How to open it -- left menu ▸ Web Server ▸ (choose the host) ▸ Web Performance · Dashboard
Reading the Worker States (Active/Idle) — a Worker Shortage
The worker states chart shows the number of active (handling) and idle (waiting) workers. Whether idle approaches 0 is the point.
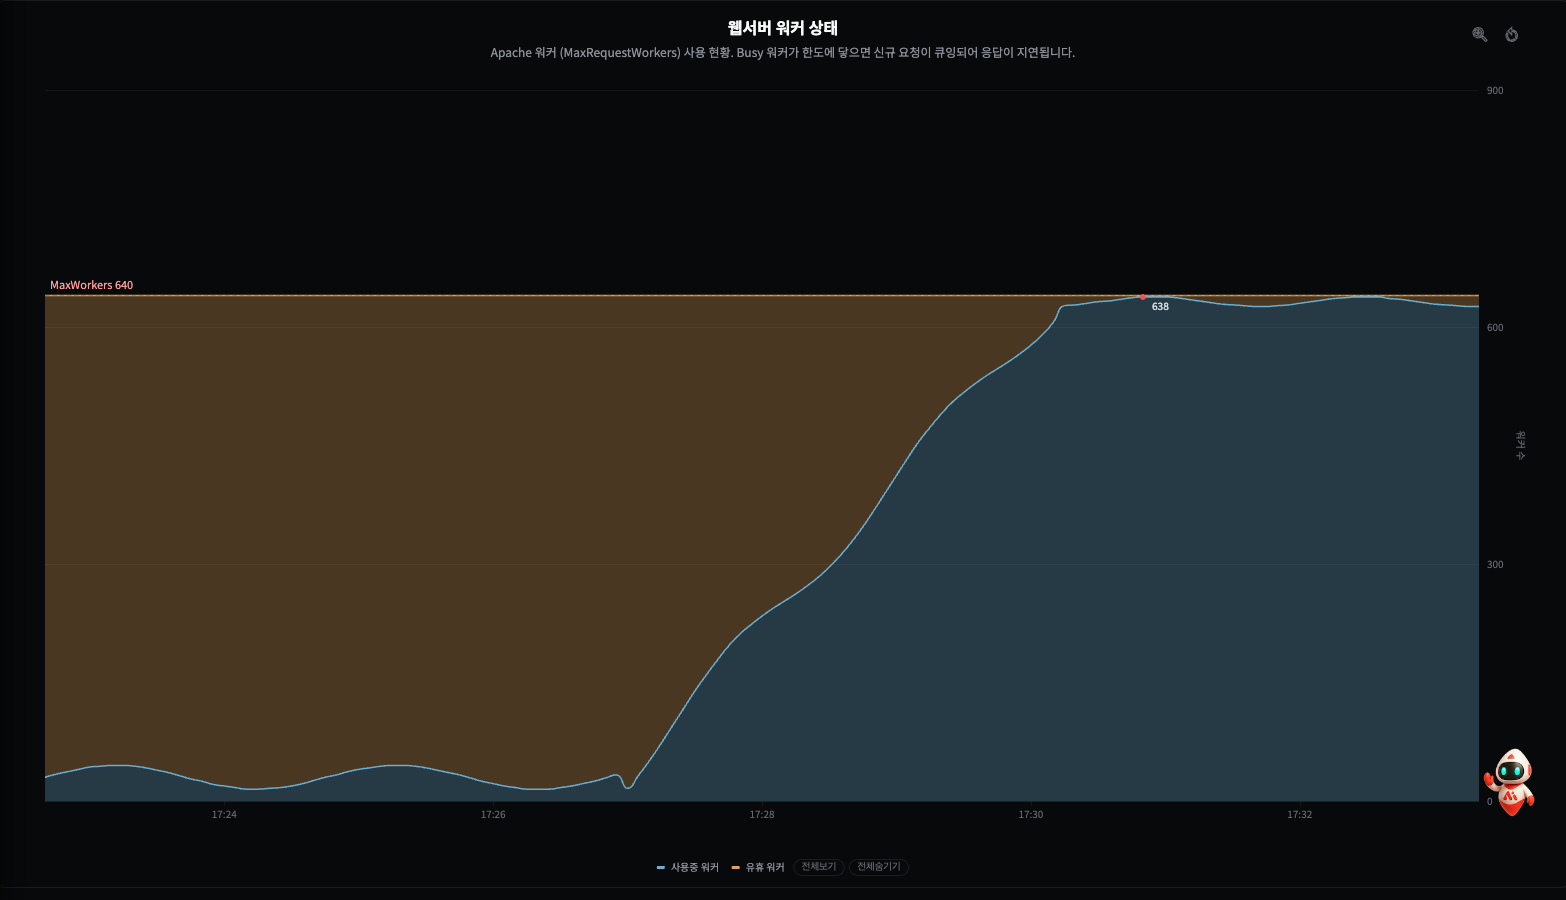
The screen above is worker exhaustion -- as traffic piles in, the workers in use (blue) climb like a staircase and stick to MaxWorkers (640, the red dotted line), and the idle workers fall to 0 by the same amount. From that point, new requests have no worker to take them and wait in the queue, arriving late or being refused.
| Shape | Interpretation |
|---|---|
| Plenty of idle workers left | Normal -- there is headroom to take a new request immediately |
| Idle often touches 0 (active near MaxWorkers) | Watch -- the workers are tight. Waiting and refusals are close |
| Active is flat, stuck to MaxWorkers, idle 0 | Danger -- worker exhaustion. New requests cannot be taken and connections fail |
A web worker utilization event (threshold exceeded) appears alongside it.
Key point Worker exhaustion is usually caused not by there being too few workers but by workers being held for a long time waiting on a backend (WAS or database) response. While one worker waits on a slow backend response, it cannot take another request. That is why the backend response time has to be read alongside it.
The Order of Diagnosis
- On the worker states chart, look at the active/idle ratio and their position against MaxWorkers.
- Read the connection states chart (Reading/Writing/Keep-alive) alongside it -- many in Writing means a slow backend (the worker is waiting while writing the backend response), and many in Reading means slow clients.
- If the backend is the cause, move to the WAS side → H6 · H8. Database Pool.
LB Worker Group Stopped — Diagnosing a Service Outage
A load balancer bundles worker members per backend and distributes traffic. When a member or a group stops, it is reported through the R3.5 events.
| Event | Meaning | Impact |
|---|---|---|
| Whole group stopped | Every worker in the LB group has stopped | Every request to this group fails (5xx) -- a service outage |
| Member stopped | A particular member's worker stopped (the backend is down, or the health check failed) | Redistribution to the remaining members → a risk of overload |
| Group/member recovered | An available worker exists again | It has resumed, but the effect of the outage window remains |
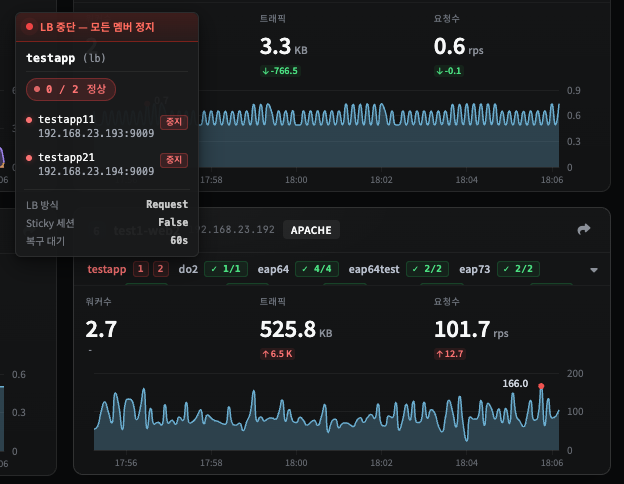
The screen above is a whole group stopped -- the testapp LB group is 0 / 2 healthy (both
members stopped), with testapp11 (192.168.23.193:9009) and testapp21 (192.168.23.194:9009) both shown
in red as stopped. Requests to this group have no backend to take them and all fail (5xx).
- A whole group stopping is the most serious -- every backend member has dropped out at once, so the cause is commonly a deployment just before, a bulk restart, or a shared dependency (database, authentication) failing. Check the deployment history immediately.
- When member stops follow one after another, traffic piles onto the remaining members and can bring those down too, spreading into a cascade. Watch the load on the remaining members alongside it.
What to Do
| What was confirmed | First action |
|---|---|
| Worker exhaustion with a slow backend | The root cause is the backend -- check slow SQL, external calls, and the database pool (H6 · H8). Adding workers alone is a stopgap |
| The backend is fine but the workers are too few | Raise MaxWorkers (MaxRequestWorkers) -- review it together with the memory headroom |
| An LB member stopped | Check that backend (WAS) is up and its health check state → H20. Checking Agents. Watch the load on the remaining members |
| The whole LB group stopped (a service outage) | Check the deployment history immediately plus the shared dependencies (database, authentication). Roll back if it is a deployment regression; recover the dependency if it is that |
| Putting out the fire | Divert traffic to a healthy backend and recover the members in turn to restore capacity |
Caution Worker and connection thresholds also arrive as event alerts. When worker exhaustion repeats on the same web server, treat it with backend capacity and the alert policy rather than a one-off response (H15. Alert Policies).
When It Does Not Work
| Symptom | What to check |
|---|---|
| No data on the Web Server tab | The web server agent (Apache module) connection state -- H20. Checking Agents |
| The workers have headroom but it is slow | Not a worker problem -- check the client side (Reading) and the network (H11) |
| The cause of the LB event is not visible | Cross-check against the WAS transactions, database, and deployment history at the same time of day -- R3 |