H15. Creating and Tuning Alert Policies
Diátaxis: How-to · Audience: administrators -- the alert policy menu is visible only to accounts with administrator rights ← Back to contents
This document sets out how to create an alert policy and shape it to your operation -- creating it, thresholds and severity, recipients and channels, prediction and anomaly detection, where an alert goes when no policy was made for it (the default policy fallback), and how to test that the alert path is alive.
How to open it -- left menu ▸ Event ▸ Alert Policies (/event/alert-policies, administrators only)
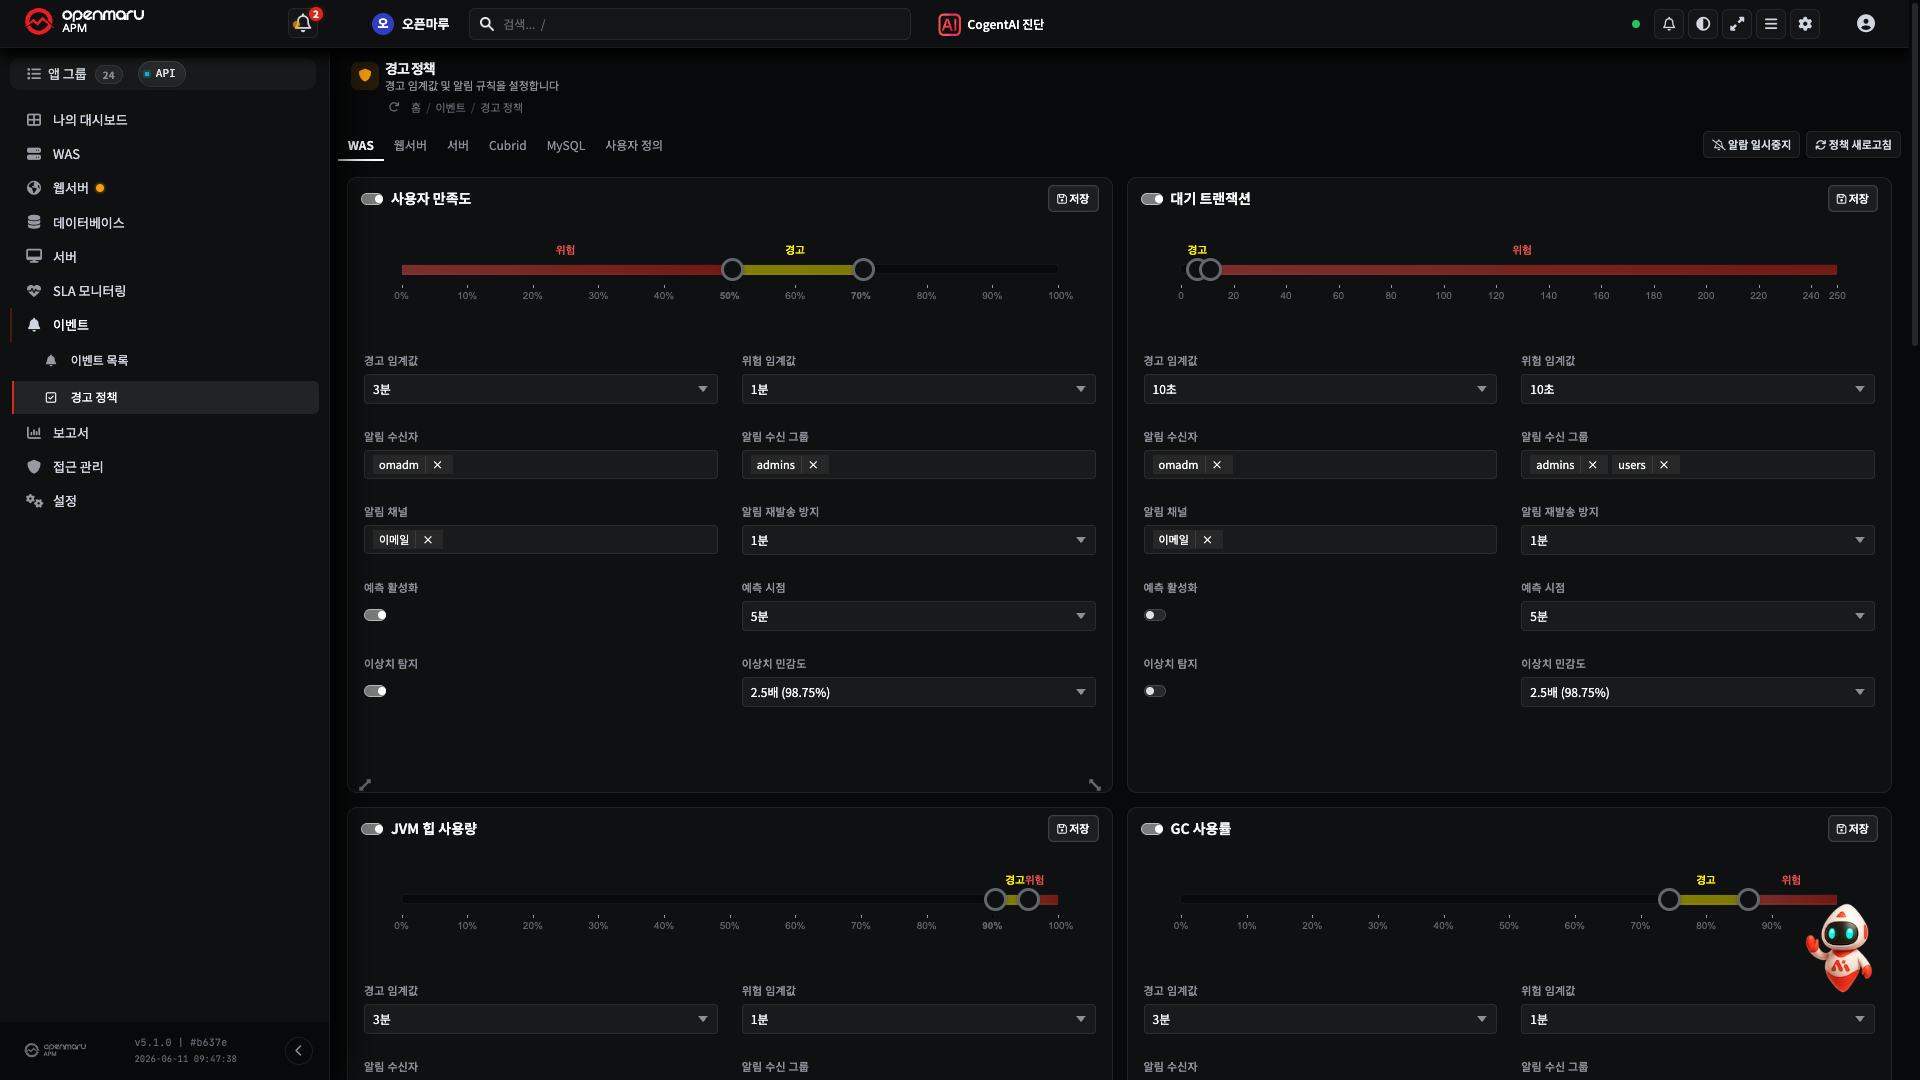
"What an event is" is in E2.3.
Creating and Editing a Policy
A policy is added after choosing three types -- they settle "what, by which metric, about whom" is to be watched.
- Event source type -- for example
WAS·SYS(server) ·WEB· DBMS - Event stream type -- the metric to watch. For example
ApdexStream(satisfaction) ·HeapStream(heap) ·CPUStream - Event target type -- for example
User Defined Group - Press Add.
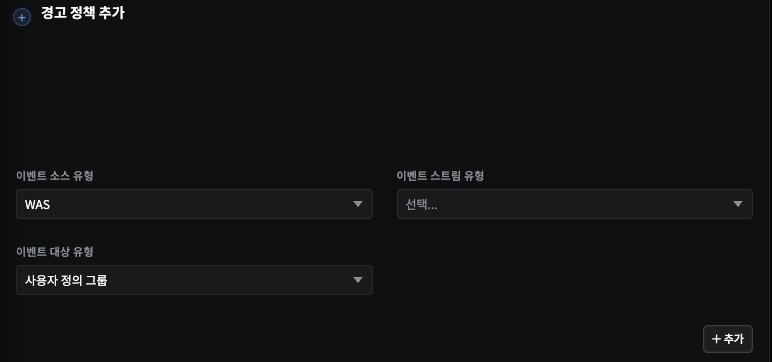
Note The creation area above is on the User Defined tab. On other tabs such as
WASandServerthe default policies are already laid out as cards, so this add form on the User Defined tab is what you use to make a new combination.
Caution All three items are required. If any one is empty it is not added.
Clicking an added policy expands its detailed settings. Set the thresholds, recipients, channels, and options here and Save. Existing policies are expanded and edited the same way.
Setting Thresholds and Severity
Events are raised at two levels of severity. Adjust the sliders and input boxes to values that suit the stream.
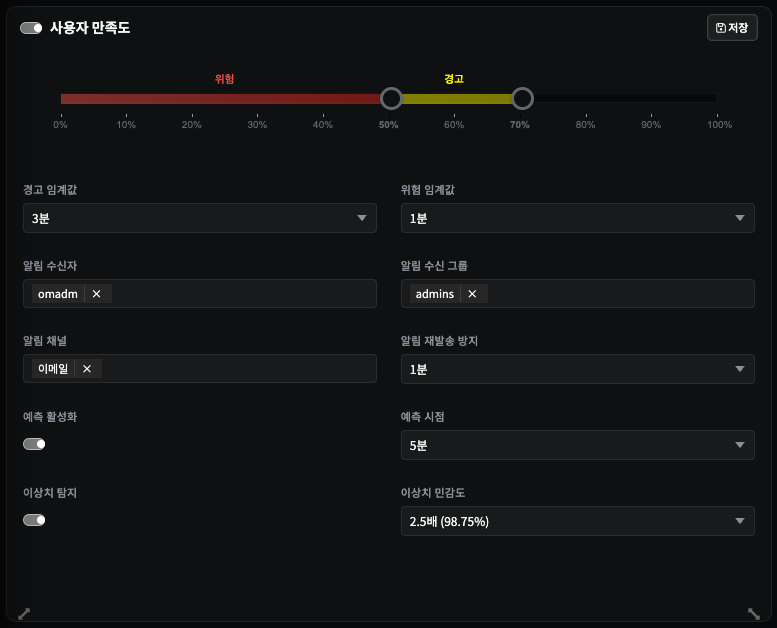
That one card holds everything from this section (thresholds and severity) down to recipients and channels and prediction and anomaly detection below -- the slider sets the warning (yellow) and critical (red) bands, and below it you settle the threshold (duration), the recipients and groups, the channels, duplicate prevention, prediction, and anomaly detection, and then Save.
| Severity | Meaning | Recommended use |
|---|---|---|
| Warning (WARN) | A level that needs attention | A low threshold, to see the trend |
| Critical (CRITICAL) | A level that needs an immediate response | A high threshold, close to an actual failure |
Note Set the threshold too low and alerts come often enough to dull you to them (alert fatigue); set it too high and you learn late. Look at the everyday values with H2. Changing the Period first, then set it slightly above the everyday maximum -- that is a reasonable starting point.
Prediction and anomaly detection (optional) -- besides the fixed threshold, you can turn on prediction, which catches a trend in advance, and anomaly detection, which catches values that depart from the usual pattern.
Caution Prediction and anomaly detection work properly only once data has built up. On a target just connected, or in an interval with very little traffic, they can produce false positives, so watch for a while and adjust them together with the threshold.
Specifying Recipients and Channels
Settle who to send to, and by what route, when the threshold is passed.
- Specify the alert recipients or an alert recipient group.
- Choose the alert channel (email, for example).
- To stop the same alert repeating, turn on Prevent Duplicated -- it suppresses repeat sending while the same state persists.
- Save.
If the same alert comes too often and you want to reduce it, see H16. Reducing an Alert Flood (muting, pausing, duplicate prevention).
Understanding the Default Policy Fallback
An alert for which no individual policy was made does not disappear -- it follows the recipients and channels of the default policy.
| Where the alert comes from | The default policy it follows |
|---|---|
| WAS | The all-target (ALL) recipients and channels of the Heap policy |
| Server (SYS) | The all-target (ALL) recipients and channels of the CPU policy |
Caution So if you leave the all-target recipients and channels of the Heap and CPU policies empty, WAS and server alerts with no individual policy may go to nobody. Be sure to fill in the default recipients of these two policies. (The same is shown on the guidance banner at the top of the alert policies screen.)
Testing the Alert Path — the Test Event
After creating a policy, check quickly that the path by which an alert actually arrives is alive.
Key point This test event does not fire the policy you made. Regardless of any policy, it raises one fixed test event (an APDEX CRITICAL for
justTestEvent@0.0.0.0) purely to confirm that the event recording and alert delivery path work.
- Open left menu ▸ Event ▸ Event List.
- From the more menu (⋮) at the top right of the list, choose Send test critical event.
- In the confirmation window ("Send a test event to the administrator?"), press Send.
- If the test event you just sent (APDEX CRITICAL, instance:
justTestEvent) appears in the event list and the alert arrives on the channel you specified, the path is sound.
Caution The
justTestEvent@0.0.0.0event is for testing, so do not mistake it for a real failure. This menu is visible only to administrators. The policy you made actually fires when its metric passes the threshold.
When It Does Not Work
| Symptom | What to check |
|---|---|
| The alert policy menu is not visible | Check the account has administrator rights -- alert policies are visible only to administrators |
| The policy exists but no alert comes | Whether the recipients and channels are empty, and whether the channel (email and so on) setup is alive |
| Not sure whether the path is alive | Testing the Alert Path — the Test Event above |
| Alerts come too often | Raise the threshold and turn on duplicate prevention → H16 |
Related Documents
- H16. Reducing an Alert Flood -- muting, pausing, duplicate prevention
- R3. Event Reference -- what each stream and event type means
- E3. What the Metrics Mean -- the metric concepts to refer to when setting thresholds