H21. Building a Status Board with the TV Wallboard
Diátaxis: How-to · Audience: operators and administrators -- viewing needs no special permission, and the groups you can see follow your own permissions ← Back to contents
The TV wallboard puts the monitoring status on a TV or a large monitor for a room full of people to watch together. Where the console is a screen you go into and search, the wallboard is a screen read from three metres away, in passing. So it does not crowd the space with numbers -- it says the state with one large number and movement.
How to open it -- press the TV icon in the top header. It is visible on every screen.
-
It opens in a new window (not a tab). If your browser blocks pop-ups, it opens in a new tab.
-
The view it opens in depends on the screen you pressed it from.
Screen you pressed it from View it opens in Value added to the address A screen under Server in the left menu Server view -- CPU, memory, and disk of a server group per tile ?view=sysEvery other screen Application view -- transactions of an application group per tile ?view=app -
The application view carries over the application group you are currently viewing in the console.
-
The view value in the address wins over the saved view. So even if you switched the wallboard to the server view, pressing the TV icon outside the Server menu opens the application view. The address value is not saved.
-
To leave it up on an unattended TV, start the browser in kiosk mode (
--kioskor--app=<address>) so the screen is filled without an address bar.
Note The wallboard is dark only. It is a screen that stays up on a TV, and a bright background causes monitor burn-in. It stays dark regardless of the console's theme setting.
What Is on the Screen
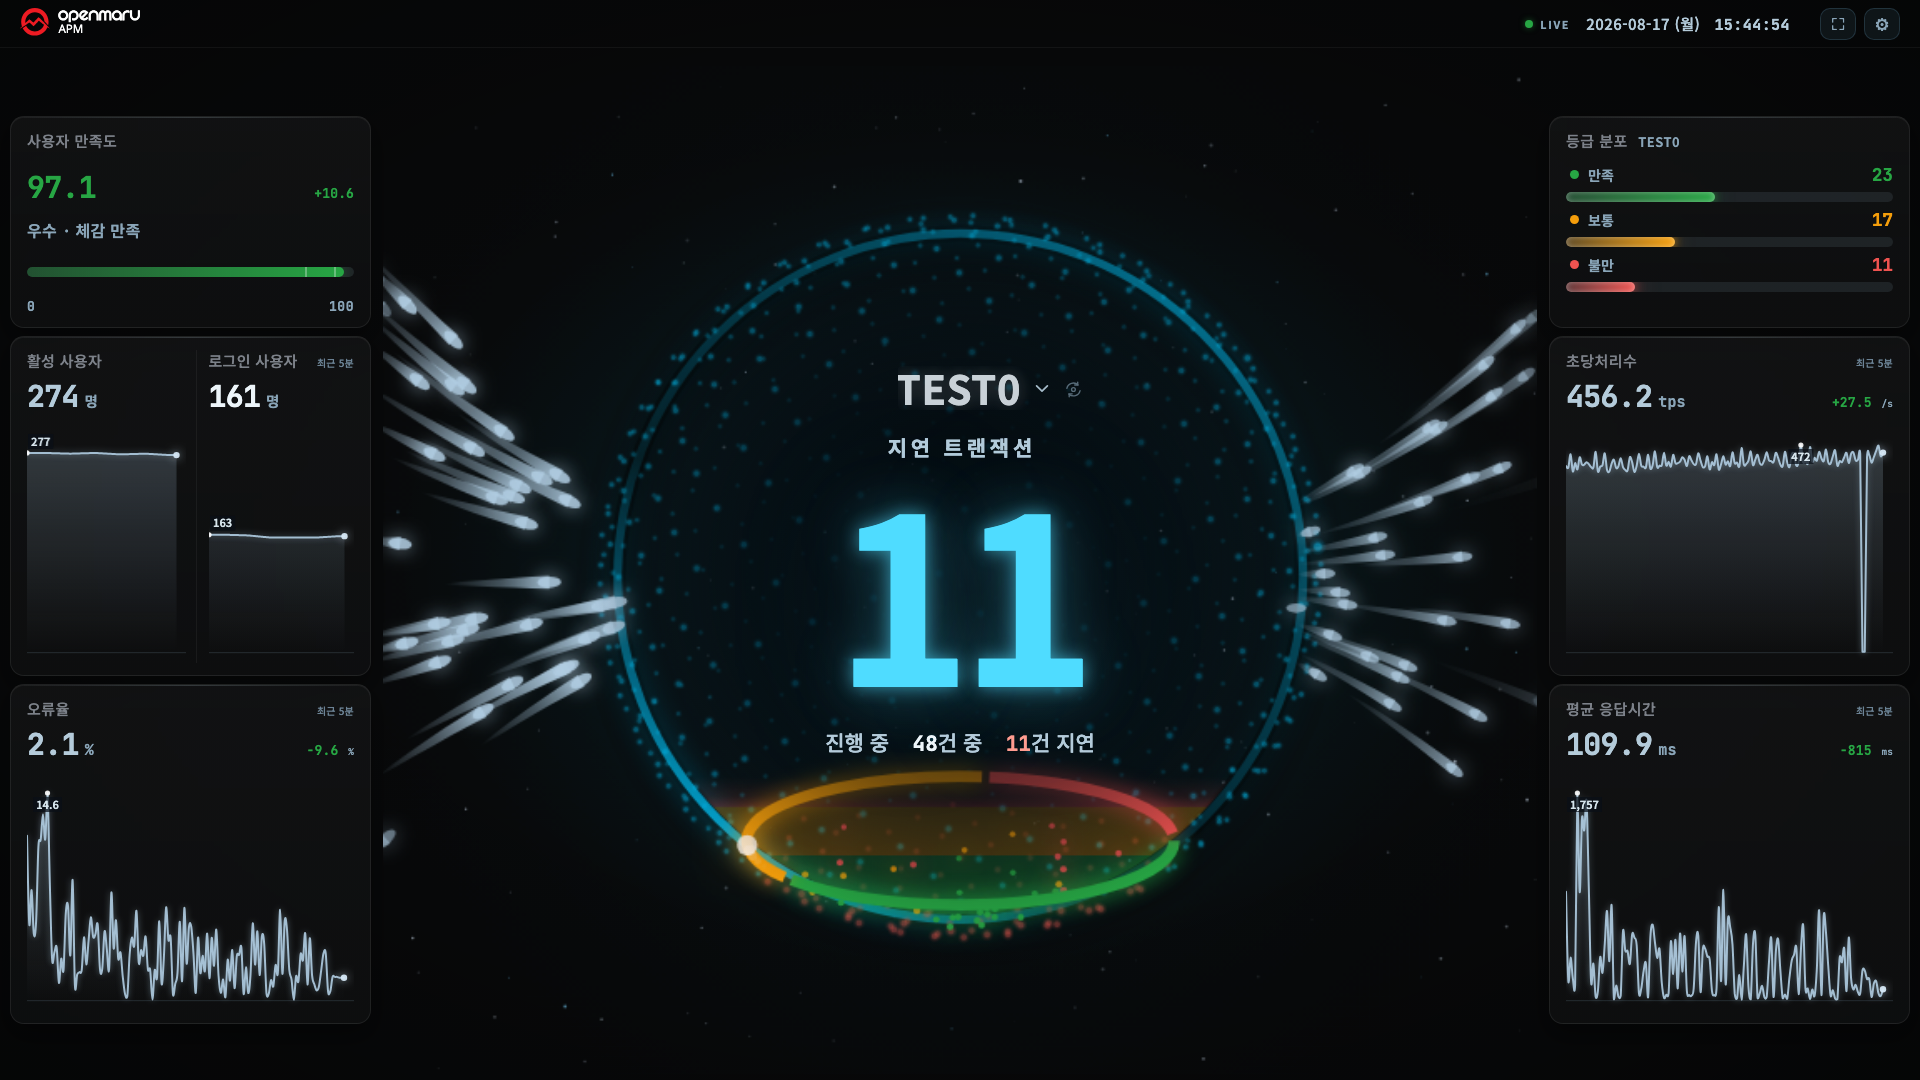
One tile shows one application group. In the server view, one tile shows one server group or one server. You can set the view per tile, so one screen can mix both views. The table below is for the application view. For the server view, see Server View.
| Area | What it is |
|---|---|
| Centre (the hero) | A large number and a moving figure -- this is the heart of the screen |
| Title | The application group being shown. Press it to switch to another group |
| Summary under the hero | One line, such as 48 active, 11 delayed |
| Left side panel | APDEX · active users · login users · error rate |
| Right side panel | Apdex distribution · TPS · average response time |
| Top bar | LIVE indicator · clock · full screen · settings (gear) |
As tiles get smaller (6 splits and up) the side panels fold away and only a one-line summary remains. The hero number and that summary survive to the end -- they are what has to be readable from three metres away.
Reading the Hero Number -- Look Here First
By default, the large number in the centre is the count of delayed transactions. It shows the worst state within the group.
Choose what the large number counts under Settings ▸ Appearance ▸ Center number.
| Center number | Label above the number | Text under the number |
|---|---|---|
| Delayed (default) | Delayed Transactions | 48 active, 11 delayed (with no delays, Normal · 48 active transactions) |
| Active | Active Transactions | 11 delayed |
Its colour tells you the state. The colour always comes from the delayed count, whichever you
choose. So with Active selected, 62 can show in red. The delayed count in the text underneath is
the reason.
| Colour | Meaning | Default threshold |
|---|---|---|
| Green | Normal | Below the warning threshold |
| Amber | Warning | 30 or more |
| Red | Critical | 50 or more |
Important These thresholds should differ per workload. If a service normally runs with 40 in the queue, the defaults leave the screen permanently amber, and then nobody notices when it actually gets worse. A warning that becomes the background is not a warning. Set it above that service's normal level.
The Three Colours Appear Twice -- and Mean Different Things
Green, amber, and red show up in two places, and they say different things. This is easy to mix up.
| Where | What it splits |
|---|---|
| The arc around the hero | Transaction state -- normal / delayed / pending |
| The "Apdex distribution" card in the right panel | How it felt to users -- satisfied / tolerating / frustrated |
The arc around the hero grows in proportion to the count while counts are small, and switches to proportion past a certain point. That way you never get "a full green bar at zero" -- when there is nothing, the arc is short.
The Apdex distribution card splits responses by how fast they felt to a person. If the delayed count is low but "frustrated" is high, the count is small but slow requests are mixed in.
Hero Objects -- Which to Choose
An application tile uses one of the six below. The numbers and the verdict are identical whichever you pick. The only difference is how the state is expressed as movement.
| Name | How it looks |
|---|---|
| Core Reactor | Particles orbit a central sphere and grow fierce as things worsen |
| Orbital Gate | Flow passing through a ring. When it jams the ring brightens and ripples spread |
| Pulse Field | Dots ripple up and down. As delays pile up the centre freezes while the outer ripples speed up |
| Flood Field | A rising surface of water. As delays pile up the level climbs and the waves quicken |
| Pulse Core | Particles flow inward from all sides. When they back up a band forms around the rim |
| Heartbeat | It beats like a heart, and motes scatter outward on the beat |
| Hive | Server tiles only. Draws one hexagon per server in the tile. See Server View |
A server tile offers five: Hive (default), Heartbeat, Pulse Core, Pulse Field, and Flood Field. Core Reactor and Orbital Gate are not in the server tile list. Those two draw incoming requests as particles, and server values cannot say what is coming in. When every server tile on the screen is a mini tile, Hive is the only choice. Your choice is kept, so the hero returns when the tile grows again.
Read the Movement, Not the Colour
This is the most important reading habit on this screen.
The worse it gets, the faster, bigger, and less regular it becomes. Colour is only the final confirmation.
- Speed -- unhurried when healthy. As delays grow it visibly speeds up.
- Size and quantity -- the more that is backed up, the more particles and the larger the form.
- Regularity -- steady when calm. As it worsens it wobbles and jumps.
Why it was built this way If colour did all the talking, the screen would be just as busy when healthy, and trouble would not stand out. What a passer-by three metres away has to catch is not "there is red" but "this is not how it usually looks." So the healthy state was made deliberately quiet.
Server View -- CPU, Memory, and Disk of a Server Group
The server view shows, per tile, the server metrics that SYS agents send. There are three metrics: CPU, memory (MEM), and disk (DISK). Network is not shown.
How to Open It
| Method | Scope |
|---|---|
| Press the TV icon on a screen under Server in the console's left menu | All tiles |
| Settings (gear) ▸ Layout ▸ View ▸ Servers | All tiles |
| Press a tile title and choose → Server view in the Switch view set at the top of the list | That tile only |
?view=sys in the address | All tiles (not saved) |
To turn a server tile back into an application tile, choose → Application view in the same place.
What a Tile Shows
A server tile shows one of the following. Press the tile title to choose. For the sets in the list, see the table in Splitting the Screen.
| Target | Servers in the tile |
|---|---|
| A server group | Every server in that server group |
| All | Every server you can see |
| No group | Servers that are in no server group |
| An application group | Servers whose IP matches a WAS server IP of that application group |
| A server | The one server you chose |
- The server count in a tile matches the count on the Access Management ▸ Server Groups screen. A server is identified by its IP and host name together, so two servers with the same IP count as two.
- A server that has not reconnected since the collection server restarted stays in the tile as Stopped.
- A server in more than one server group can show in more than one tile.
- The wallboard reads the server group settings again every 10 minutes. If a change does not show right away, wait 10 minutes or refresh the wallboard.
Note If there are no server groups, the wallboard groups tiles by application group. It treats servers whose IP matches a WAS server IP of the application group as that group's servers. In that case the line "No server groups — grouping by application group" shows under Settings ▸ Server thresholds. In container environments the WAS IP and the server IP differ, so most servers land in No group. Create server groups with H22. Grouping Servers into Server Groups.
Reading the Large Number
The large number in a server tile is the worst metric value of the worst server in the tile.
93%                          <- large number: worst metric of the worst server
▲ CPU was-prod-11            <- metric name and server name (partition name too, for disk)
Critical · on this screen 3 min  <- grade, and time since this screen first saw that grade
- It picks from servers that have values. The order is critical → warning → normal; within a grade, the higher metric value wins. Stopped and no-data servers are not candidates. So one stopped server does not hide another server's high disk usage. Stopped and no-data servers still show in the summary counts and as grey hexagons in the hive.
- If every server in the tile is stopped or has no data, the number area shows
StoppedorNo datawith the last-seen time. - With no critical or warning server, it shows only the highest value in the tile, without a server
name (for example
52%CPU). Showing a server name large while healthy makes that server look like a problem. - "on this screen n min" counts from when this wallboard screen first saw the grade. The server does not send a grade start time, so different TVs can show different values.
- The tile background and border colour also follow the servers that have values.
The Summary Under the Number
| Row | Content |
|---|---|
| First row | Servers n · Stopped n · No data n · Critical n · Warning n |
| Second row | CPU max · MEM max · DSK max -- the highest value per metric across the tile |
No data is a server whose agent is running but whose metric values do not arrive. It is not counted as 0%.
The Hive Hero
The default hero for a server tile is Hive. It draws one hexagon per server in the tile.
| Hexagon | Meaning |
|---|---|
| Pale green | Normal |
| Amber / red, border pulsing | Warning / critical. The higher that server's CPU, the faster it pulses |
| Grey fill | Stopped |
| Dashed grey | No data |
| Hexagon with extra outer glow | The server the large number points to |
- When a hexagon is large enough, the server name shows inside it. For long names it drops the prefix the servers in the tile share and keeps the end (the number).
- When new values arrive (every 10 seconds), one ring spreads out from the hexagon of the server the large number points to (or from the centre if there is none). A server whose grade changed moves its hexagon to the new position.
- With reduced motion (
prefers-reduced-motion) turned on in the operating system, there is no movement.
Mini Tiles -- When Tiles Are Small
When a server tile is smaller than 460×360 (for example 16 splits at 1080p), it becomes a mini tile. A mini tile draws a small hive and one summary line under it.
20 hosts · Critical 1 · CPU 58% · MEM 73% · DSK 88%
Stopped, no data, critical, and warning appear only when not zero. CPU, MEM, and DSK are the highest values in the tile.
Server Thresholds
Server tile colours come from Settings ▸ Server thresholds. There is one set for the whole screen, not one per tile. Values move in steps of 5.
| Metric | Warning (default) | Critical (default) |
|---|---|---|
| CPU % | 80 | 90 |
| MEM % | 90 | 95 |
| DISK % (highest partition) | 85 | 95 |
The warning defaults match the console's server dashboard cards. This set shows in Settings only when there is a server tile.
Note The alert band works in the server view too. On a screen with only server tiles, it shows every alert it receives without filtering by application group (see The Alert Band).
Splitting the Screen -- Several Groups at Once
Divide one screen into 1 / 2 / 3 / 4 / 6 / 8 / 12 / 16 tiles and put a different group in each (an application group or a server group).
- Settings (gear) ▸ Layout ▸ Screen split, and choose the number of tiles.
- Press the title of each tile to choose the group it shows. Long lists can be searched.
- The gear on a tile changes the hero for that tile alone.
The list under a tile title starts with the Switch view set. An application tile shows → Server view, a server tile shows → Application view, and choosing it switches only that tile. In an application tile, the application group list follows.
A server tile's list is split into the sets below. Set names are separators and cannot be chosen.
| Set | Choosing an item |
|---|---|
| Switch view | → Application view -- turns only that tile into an application tile |
| Server groups | Puts All, a server group, or No group in the tile. The number in brackets is the server count |
| Application groups | Puts the servers whose IP matches a WAS server of that application group in the tile |
| Server assignment (conditional) | Spreads the servers in the chosen scope across tiles, one per tile, worst first. The count that does not fit shows in the header as +n off screen |
| Servers | Pins one server to that tile |
- With no server groups, a server tile's list has no Server groups set; application groups take its place (see the note in Server View).
- The Server assignment set appears only when a tile is already in server assignment. Opening
with, for example,
?g=hosts:전체puts a tile in server assignment, and then the set appears.
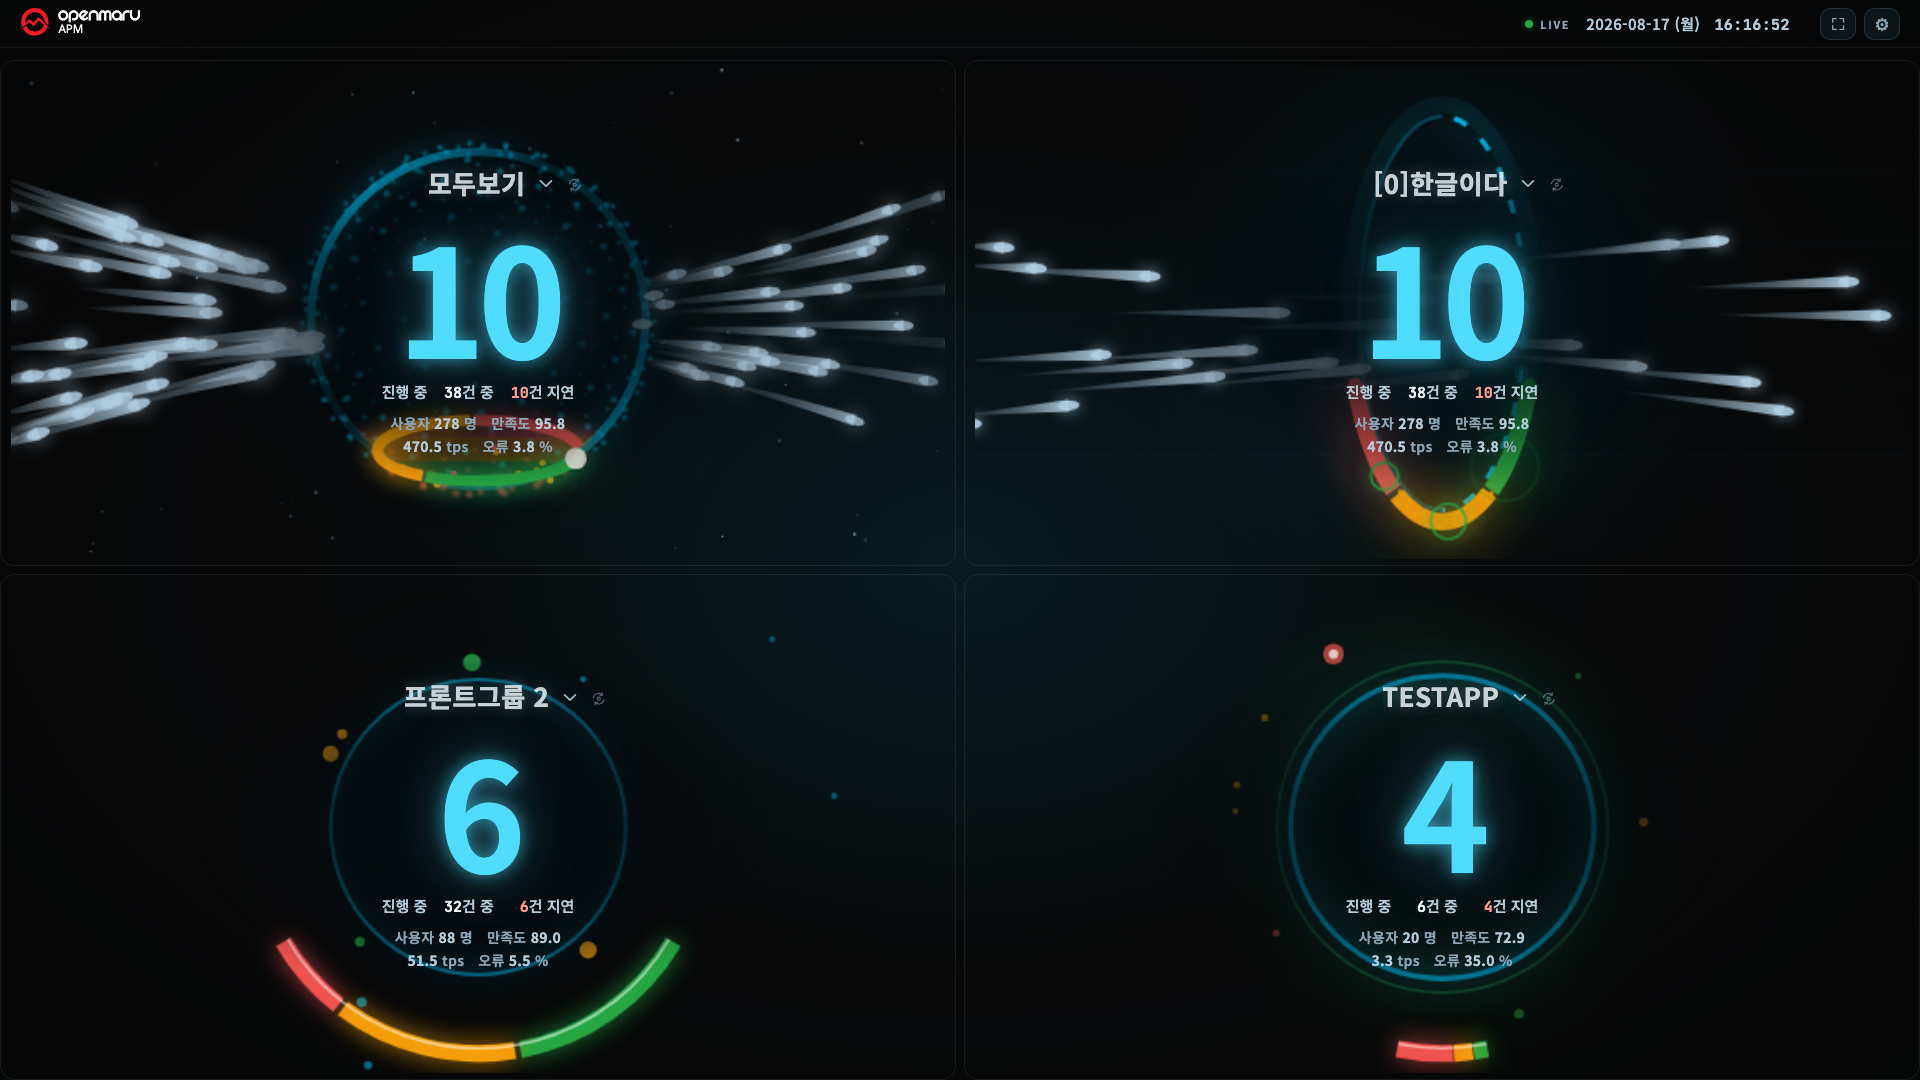
Your choices are saved per tile and restored the next time you open it.
Note The split cannot be chosen, or is reduced automatically, in these cases.
- The tiles would be too small for the screen -- it tells you so. A size that cannot be read from three metres away is never produced.
- There are not enough application groups -- it splits only as far as the groups you have. 16 tiles need at least 16 groups. When every tile is a server tile, it counts server groups (servers, in server assignment). Hover over a locked button to see the reason.
- 12 and 16 tiles need a large screen -- 16 opens at 4K (3840×2160), 12 at QHD (2560×1440); 1080p stays at 8. If a 4K TV still locks them, check that the PC display scaling is 100% (at 150% or 200% the browser sees a smaller screen).
- When every tile is a server tile, the minimum tile size is 233×150, so 16 tiles open even at 1080p.
Even when it is reduced automatically, your choice is not erased. Open it again on a large TV and it returns to the number of tiles you picked.
Specifying It by URL
When an unattended TV has to come up on a fixed layout, put the conditions in the address.
| Parameter | Meaning |
|---|---|
?split=N | Number of tiles |
?view=app · ?view=sys | All tiles in the application view / server view |
?group=<name> | The group to show when there is one tile |
?groups=<v1,v2,…> · ?g=<v1,v2,…> | Target per tile (comma separated). g is the short name for groups |
?hero=<name> · ?heroes=<n1,n2,…> | Hero selection. hero sets all tiles, heroes goes in tile order |
?sysThr=<CPU warn/crit,MEM warn/crit,DISK warn/crit> | Server thresholds. Example: ?sysThr=80/90,90/95,85/95 |
?ticker=off · ?ticker=flip · ?ticker=crawl | Alert band Off / Rotate / Scroll |
A prefix on a per-tile value makes that tile a server tile. A plain name follows the view value.
| Value | What the tile shows |
|---|---|
<name> | An application group (application tile) or a server group (server tile) |
appg:<name> | An application group, in a server tile |
host:<IP> | One server |
hosts:<scope> | Server assignment. The scope is 전체 (all) or a server group name |
Hero names are orb (Core Reactor) · gate (Orbital Gate) · pulse (Pulse Field) · flood (Flood
Field) · pulsecore (Pulse Core) · heartbeat (Heartbeat) · hive (Hive).
Example: a tile for the server group "payment" next to a tile for one server. Add it after the wallboard address.
?view=sys&split=2&g=payment,host:192.168.23.193
- Address values win over saved values and are not saved. For an unattended TV, change the link.
- Setting thresholds with
sysThrlocks the server threshold buttons in Settings.
The Alert Band -- One Line of Events at the Bottom
The band at the very bottom shows events created by the console's alert policies, one line at a time. The band says what happened; the hero keeps saying how bad it is.
[CRITICAL] 14:19  payment-WAS · was03   JVM heap usage over 96%            1/3
 ^grade     ^time  ^target               ^message                         ^index
- It shows critical and warning only. Informational events do not appear.
- An item stays for 1 minute after it last occurred. When the same event comes again, only the time and message change.
- With several items, critical comes first, then newest first. The right end shows an index such
as
1/3. - When an agent starts again, the stop alert for the same target leaves the band.
- With no alerts, the band is empty. It does not say "no alerts". The band keeps its space, so tile sizes do not change as alerts come and go.
- It shows alerts for the application groups that application tiles are viewing, plus alerts that belong to no group. It does not filter when a tile views the all-groups rollup or when every tile is a server tile.
- On a split screen, the group name comes before the message.
Settings
Two rows under Settings ▸ Alert thresholds. When a server tile is on the screen, they appear below the server thresholds (DISK %).
| Item | Values | Default |
|---|---|---|
| Alert band | Off -- removes the band's space too · Rotate -- the line stays still and changes to the next item every 6 seconds · Scroll -- the line moves from right to left | Scroll |
| Levels | Critical · Critical + Warning | Critical + Warning |
With reduced motion turned on in the operating system, Scroll shows as Rotate.
When the Band Is Empty -- Check the Receive Status
The screen alone cannot tell "no alerts" from "not receiving alerts". Check the small text beside the Alert band row in Settings.
Registered · Last event 14:21 · Showing 2
| Text | Meaning |
|---|---|
| Connecting / Connected / Registered / Disconnected | State of the event connection. Registered is normal |
| Last event HH:MM | When the last event arrived |
| No events received | Nothing has arrived since connecting |
| Showing n | Items in the band now |
Important The wallboard receives events with the permissions of the signed-in account. If that account is not a recipient of the alert policies, no events arrive and the band stays empty. Add the status board account to the policy recipients (H15. Creating and Tuning Alert Policies).
Settings
Pressing the gear opens the settings, in the sets below.
| Set | Items |
|---|---|
| Layout | Screen split · View (Application / Servers) · Sidebar (Overview / Details / None) · Sidebar position · Login Users |
| Alert thresholds | Warning at · Critical at -- adjusted in steps of 10 |
| Server thresholds | Warning and critical for CPU % · MEM % · DISK % -- adjusted in steps of 5. Only when there is a server tile |
| (under the thresholds) | Alert band (Off / Rotate / Scroll) · Levels (Critical / Critical + Warning) |
| Appearance | Center number (Delayed / Active) · Chart color · Transaction balls (show, size, color) · Center view (choosing the hero) |
-
View switches all tiles at once. When tiles mix both views, neither button is lit.
-
When every tile is a server tile, the rows used only by application tiles (Sidebar, Sidebar position, Login Users, Alert thresholds, Center number, Chart color, Transaction balls) are hidden.
-
When the settings panel is taller than the screen, it is shown in two columns.
-
Thresholds move in steps of 10 only. This is the verdict line for a screen read from three metres away, so single-unit precision means nothing, and two buttons are enough to adjust it standing in front of an unattended TV.
-
Transaction balls (the animation of requests flying) turn off automatically at 6 splits and up -- once tiles are that small the balls cannot be seen anyway and only cost drawing time.
-
Reset to defaults keeps the screen split, the view, the sidebar, and the group arrangement per tile. Losing the screen you set up would be more trouble than help. Everything else returns to its default: alert thresholds, server thresholds, alert band, levels, center number, chart color, transaction balls, hero, sidebar position (Fit), and login users (Show). Server thresholds set by the address (
sysThr) are not reset.
When the Connection Drops
The wallboard stays up for a long time, so it does not hide a dropped connection.
- On a drop it keeps the last screen and merely stops updating. The screen does not blank or fall to zero -- that would read as an outage.
- The LIVE indicator at the top changes, and pressing it reconnects.
- If your login expires, a bar appears with a Refresh button to bring it back.
Note A display that has stopped is not the same as a value that is genuinely zero. Check the LIVE indicator first.
Language and Names
- It follows the display language (Korean or English) chosen in the console.
- If you have set display names (aliases)
on groups or instances, the wallboard shows those names too. On a screen a room watches together,
a business name reads far better than
prod-order-was-01.
When It Does Not Work
| Symptom | What to check |
|---|---|
| Pressing the TV button opens nothing | Check the browser's pop-up blocker -- when blocked it opens in a new tab |
| The split you want cannot be chosen | Either the screen is too small for tiles that size, or there are not enough application groups |
| The screen looks frozen | Check the LIVE indicator at the top and press it to reconnect. If a login-expired bar is showing, press Refresh |
| The number is always amber or red | The thresholds sit below that service's normal delay count -- raise them under Settings ▸ Alert thresholds |
| A group is missing from the list | Whether your account has permission for that group → H18 |
| Text is small on a large screen | Reduce the number of tiles. The larger the tile, the larger the text |
| Transaction balls are not visible | They turn off automatically at 6 splits and up. Check the state under Settings ▸ Appearance |
| 12/16 tiles are locked on a 4K TV | Set the PC display scaling to 100%; innerWidth in the browser console must be 3840. They also lock when there are fewer than 16 groups |
| The TV icon does not open the server view outside the Server menu | This is expected. Outside the Server menu, the TV icon always opens the application view. Switch with Settings ▸ View ▸ Servers |
| Server tiles are grouped by application group; most servers are in No group | There are no server groups. Check for "No server groups — grouping by application group" in Settings, and create server groups with H22 |
| A server tile shows "No servers in this group" under the number | That group has no servers right now. Check in H22 that the server group pattern matches your servers |
| A new server group does not show on the wallboard | The wallboard reads server groups every 10 minutes. Wait, or refresh |
| The same server shows in two tiles | That server is in two server groups. Check "Server Groups of This Server" in the server list on Access Management ▸ Server Groups |
| Core Reactor and Orbital Gate cannot be chosen in a server tile | They are not in the server tile list. When every server tile is a mini tile, only Hive is offered |
| The alert band is always empty | Check the receive status beside Settings ▸ Alert band. If it is not Registered, it is a connection problem; if No events received persists, check that the wallboard account is an alert policy recipient |
| Center number set to Active, and the number is red | The colour always comes from the delayed count. Read n delayed under the number |
Related Documents
- H19. Bundling Targets into Application Groups -- creating groups and display names
- H22. Grouping Servers into Server Groups -- the server groups that set server view tiles
- H15. Creating and Tuning Alert Policies -- the policies and recipients behind alert band events
- H18. Managing Users, Groups, and Permissions -- the scope of groups you can see
- R4. Common UI Elements -- where the TV button sits in the top bar
- T2. Tracing a Slow Request -- digging into the console after spotting something on the wallboard