H3. My Dashboard — Gathering Only the Charts You Want
Diátaxis: How-to · Audience: operators ← Back to contents
My Dashboard is the feature for laying out only the charts you look at often, on one screen, picked from those scattered across the various screens. It is not a matter of "registering" existing screens as favourites but of building your own dashboard by adding widgets (charts) to a blank screen. Below is an example of a My Dashboard built from widgets.
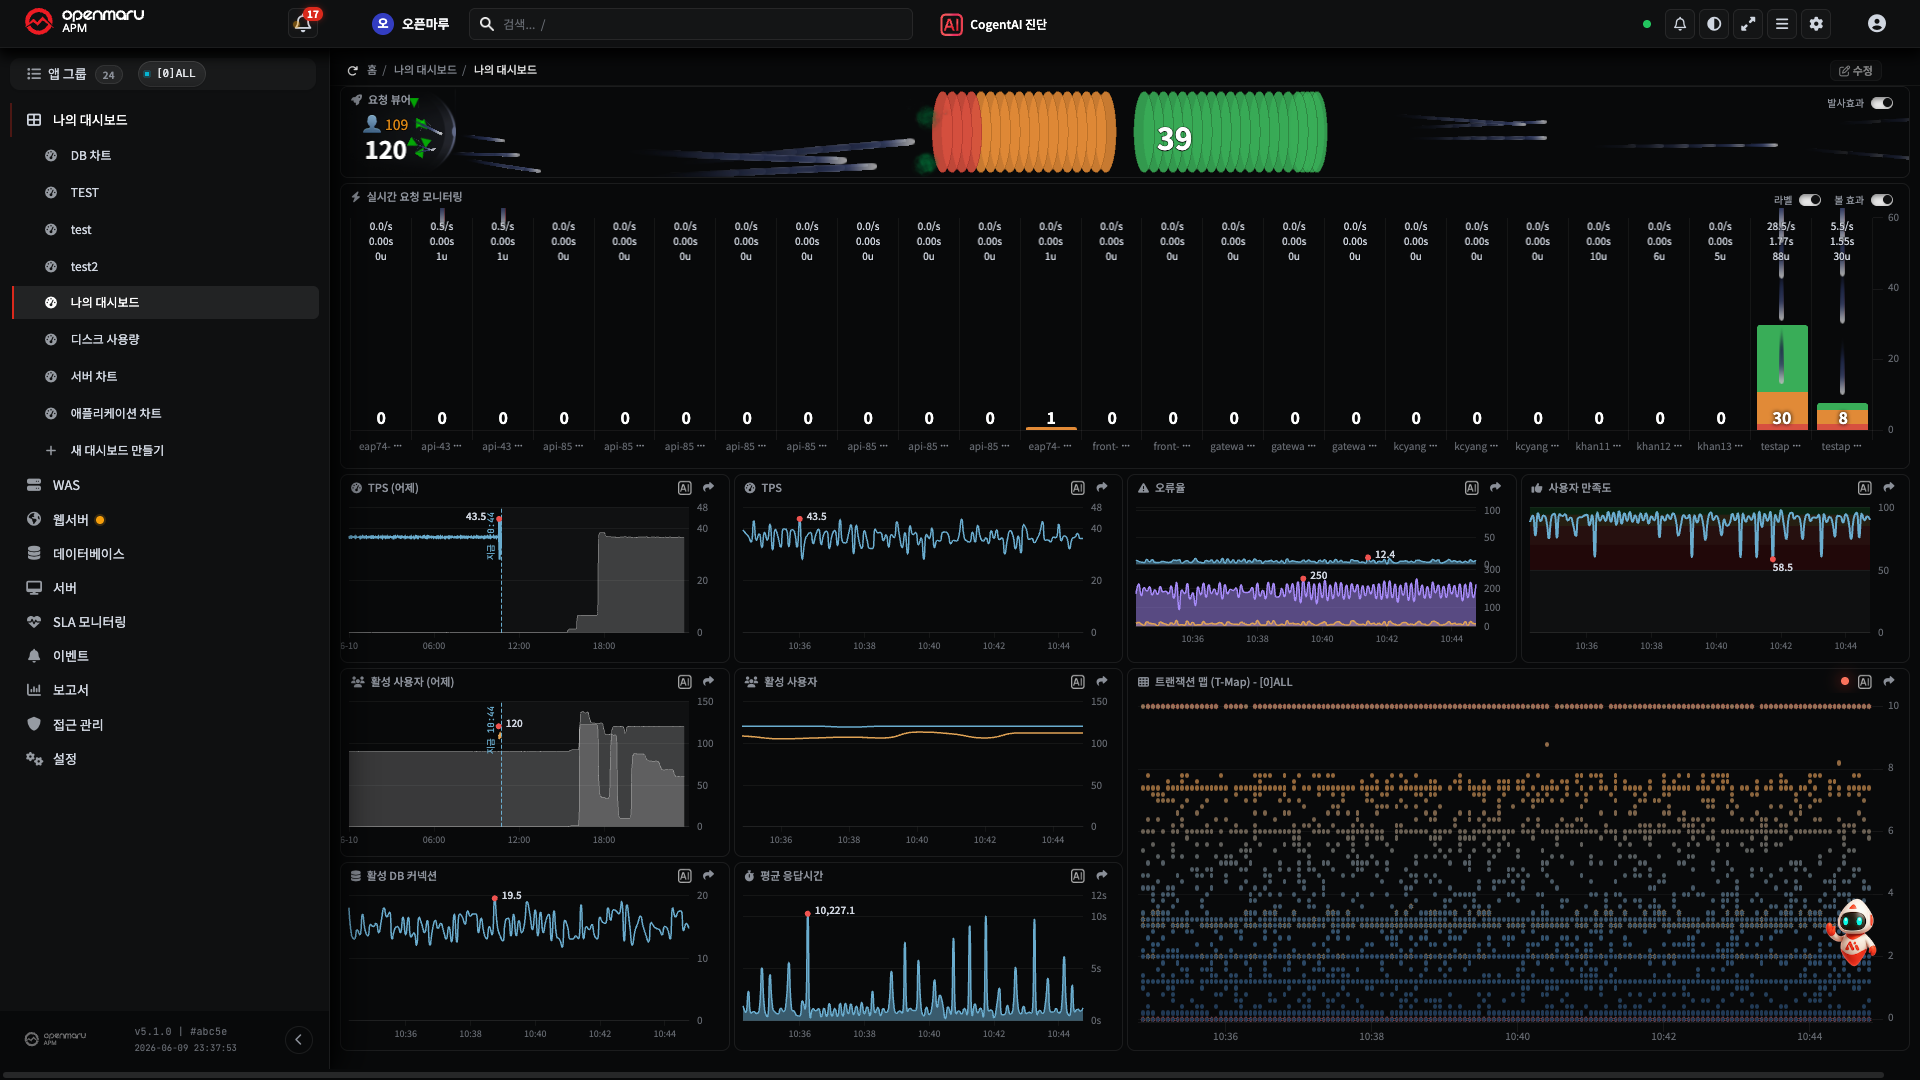
For what a chart means, see R2. Chart Metric Reference; for choosing the target and period, see H1 and H2.
Where to Start
Unfolding My Dashboard at the top of the left menu shows the list of dashboards you have made, with a Create new dashboard item at the bottom.
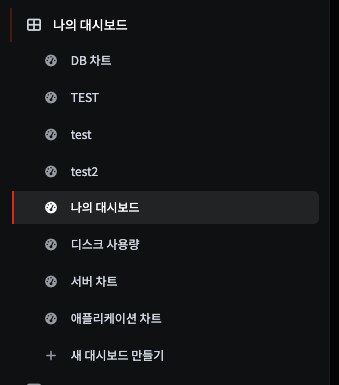
- Click a dashboard you made → that dashboard opens.
- Create new dashboard → the edit screen opens (a blank canvas plus the composition panel on the left).
Goal 1 — Creating a New Dashboard
- Press left menu My Dashboard ▸ Create new dashboard.
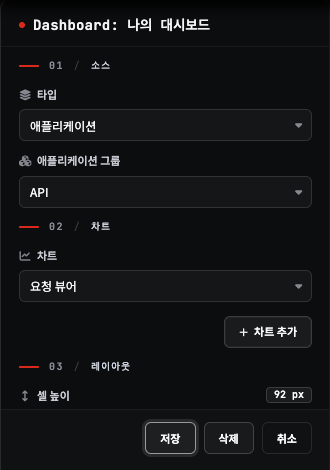
- The edit screen opens. At the top of the composition panel on the left ("Create my dashboard"), where the menu was, are the widget kind tabs Chart and Text. The Chart tab (the default) has three steps. For the Text tab, see Goal 2-1.
| Step | What you do |
|---|---|
| 01 Source | Choose the type the chart comes from (application, WAS, server, web server, database, database cluster) and the target |
| 02 Chart | Choose the widget (chart) to add and press Add chart |
| 03 Layout | Adjust the cell height (the row height) |
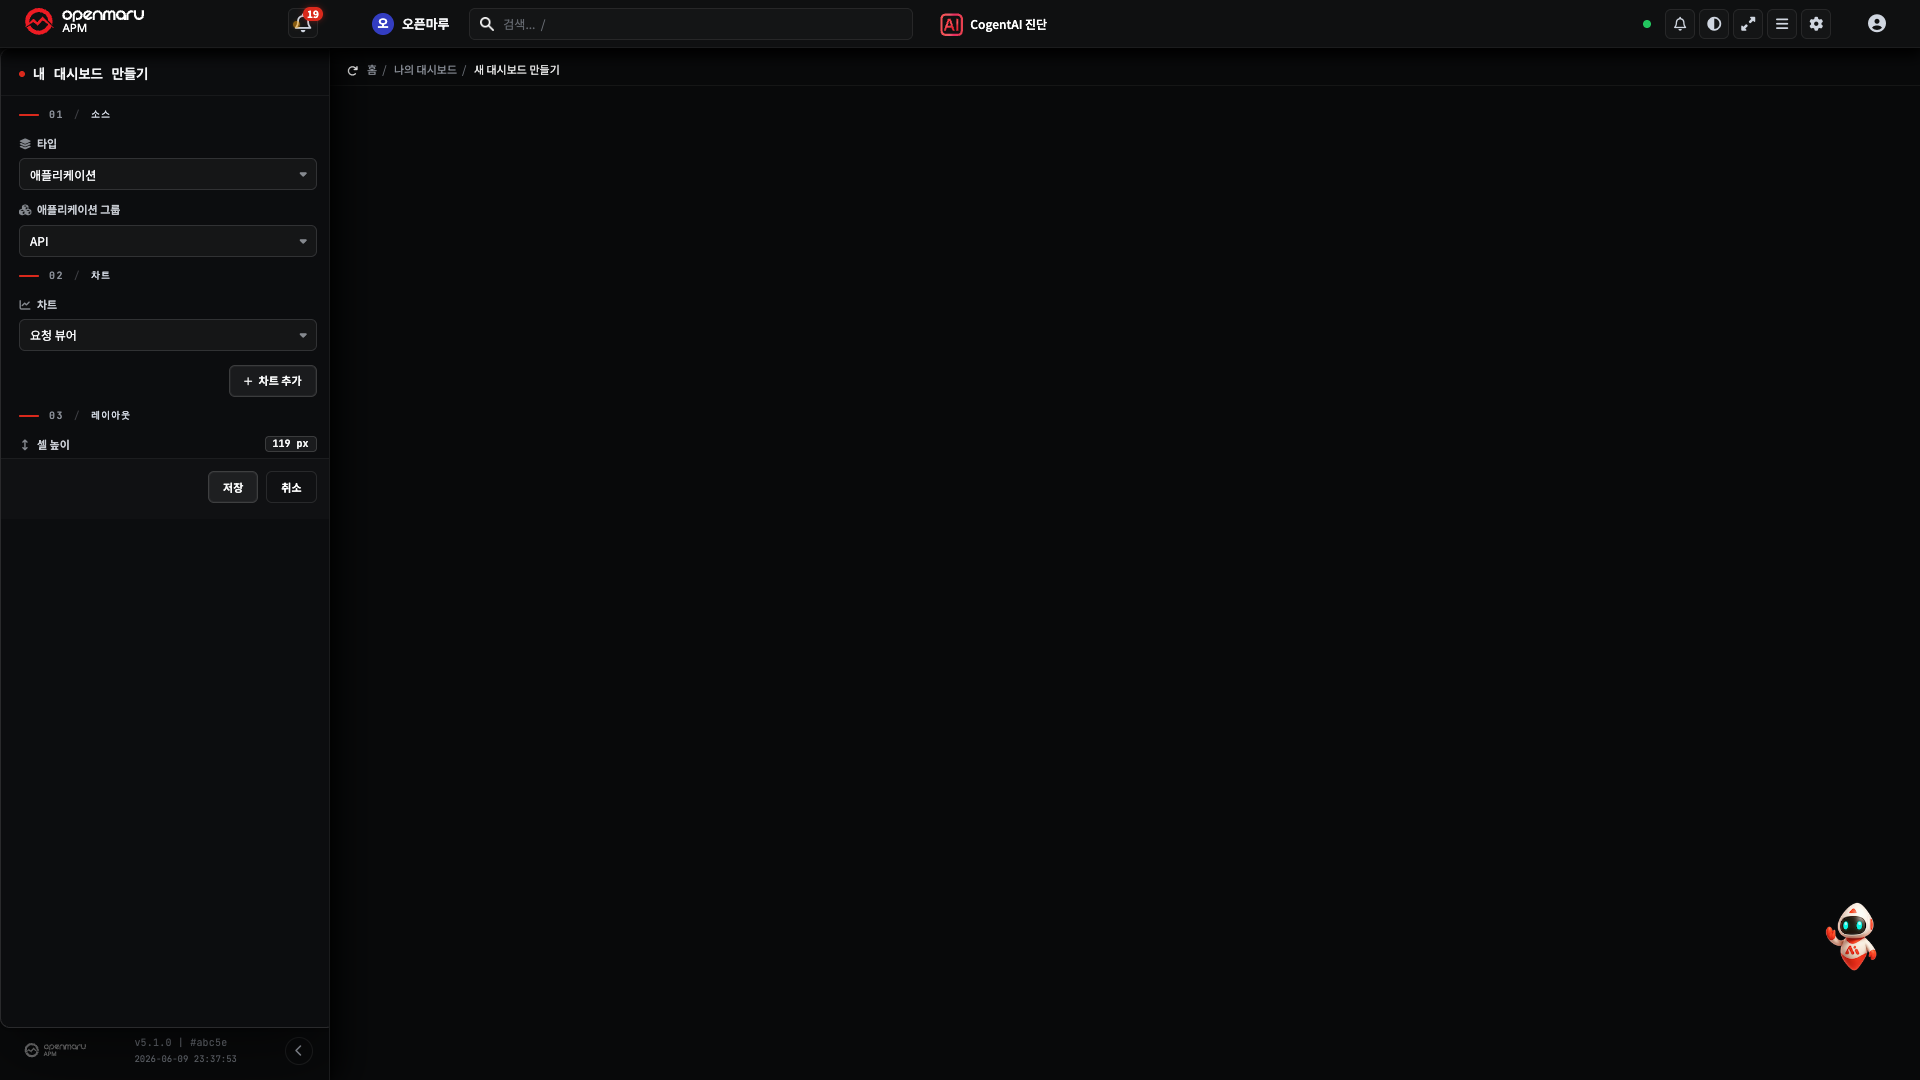
Result -- once the edit screen is open, you are ready to add widgets.
Goal 2 — Adding a Widget (Chart)
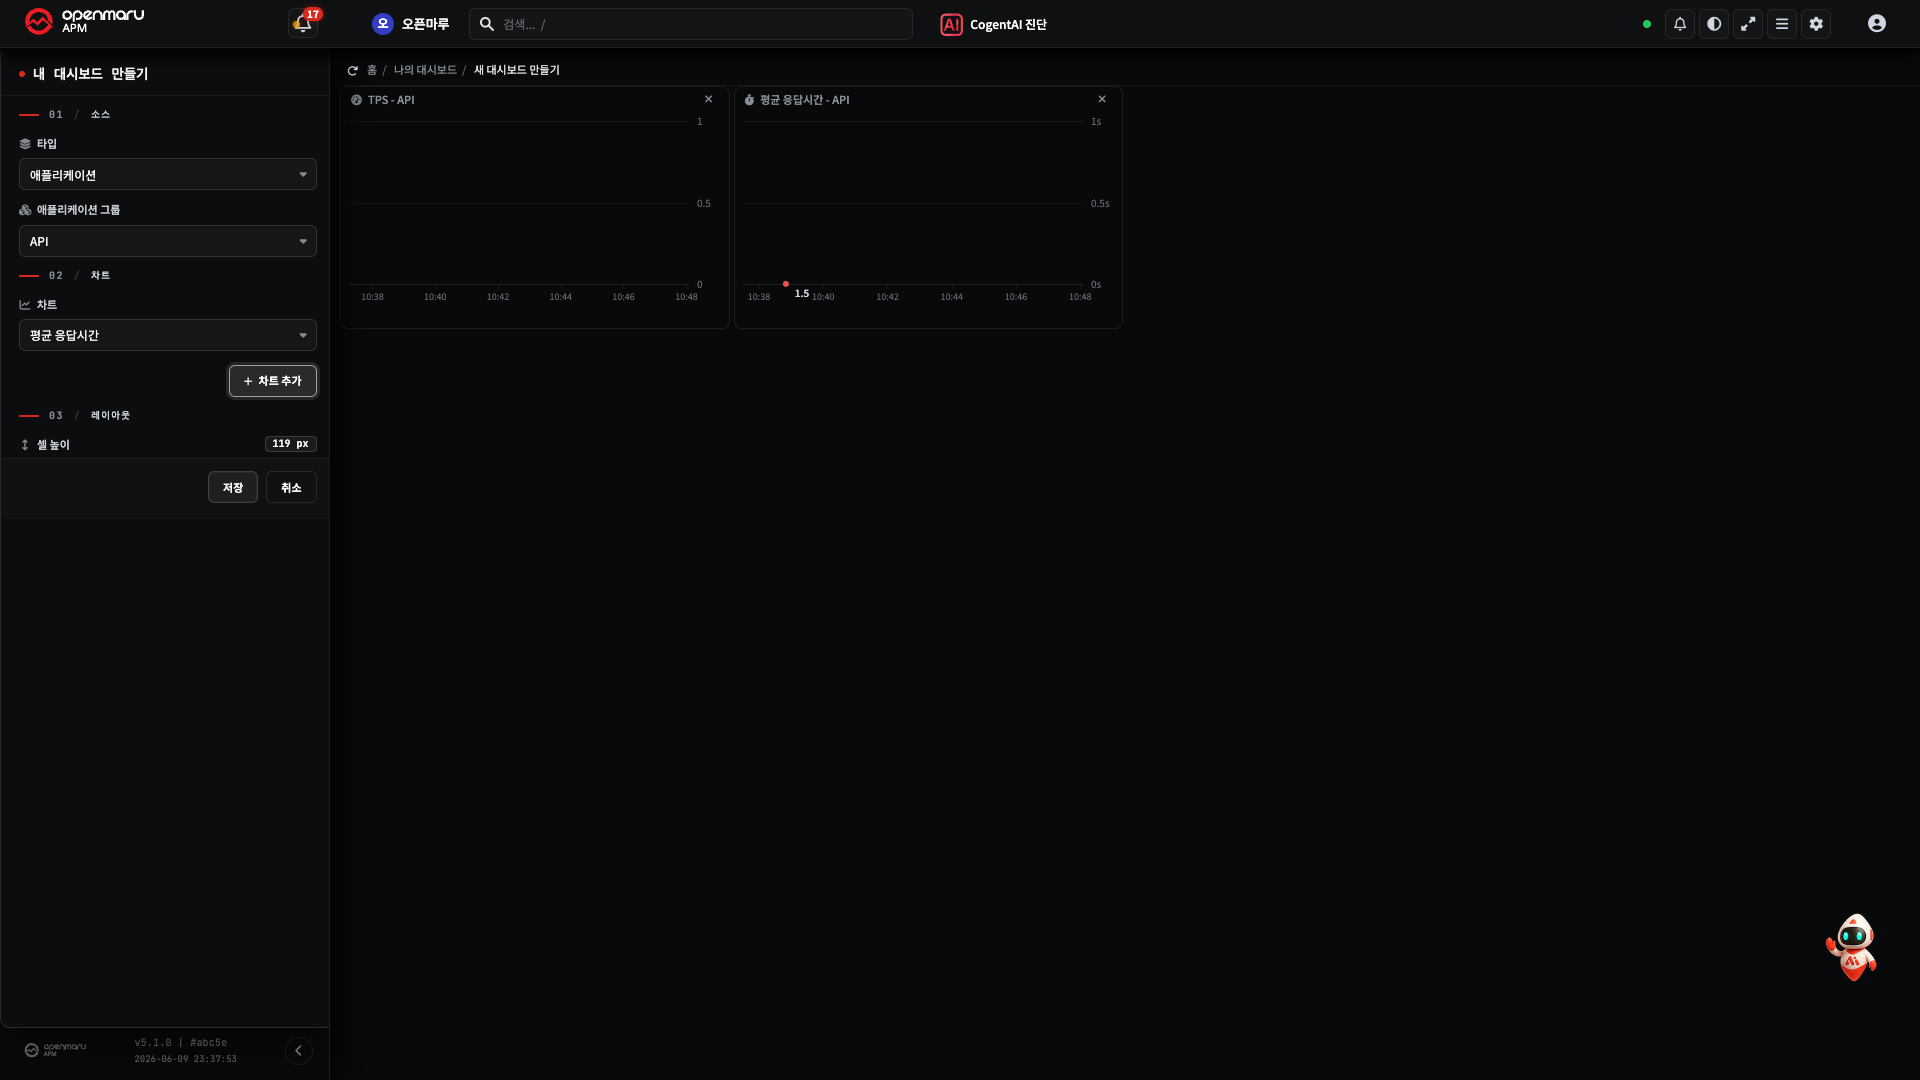
- Check that Chart is selected in the widget kind tabs at the top of the left panel, then choose the type under 01 Source. (Application, for example.)
- Choose the target of that type (an application group, host, and so on). (API, for example.)
- Choose the chart you want under 02 Chart. (TPS, for example.)
- Press the Add chart button.
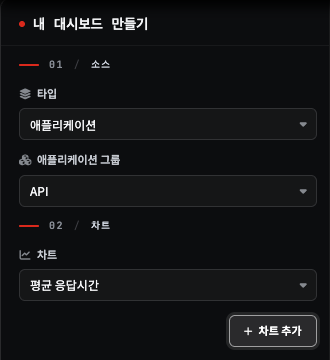
Result -- the widget is added to the canvas. Trying to add the same widget again brings up an "already present" notice.
Note There are many charts to choose from across the areas -- WAS, system, web, DBMS, containers, and so on. Check what each means in R2. Chart Metric Reference.
Goal 2-1 — Adding a Text Label
Besides charts, you can add a widget that holds only text (a text label). Use it for a section heading or a note on the dashboard. It is not connected to any metric value.
- Press Text in the widget kind tabs at the top of the left panel. A 02 Text step appears in place of 01 Source and 02 Chart.
- Fill in the fields below.
| Field | Description |
|---|---|
| Text | The text shown in the widget. One line, up to 200 characters. If left empty, nothing is added |
| Size | The font size (px). Choose from 10, 12, 14, 16, 18, 20, 24, 28, 32, 36. The default is 10 |
| Background Color | The widget background colour |
| Text Color | The text colour |
| Text Horizontal Align | Left / centre / right |
| Text Vertical Align | Top / middle / bottom |
| Link | Turning it on shows an address field. Pressing the label opens that address in a new tab. Only addresses starting with http://, https://, /, or # can be used; any other address is not saved, and no link is set |
- Press the Add Text button. (On the Text tab, the Add Chart button is renamed Add Text.)
Result -- the text label is added to the canvas (default size 3 cells wide, 1 cell high). Move and resize it the same way as a chart widget (Goal 3).
Editing the Label Text
- Pressing the label text once lets you edit the text in place. When you hover over a label that can be edited, a dotted border appears and the cursor changes to a text cursor.
- Enter or clicking outside the label confirms; Esc returns to the text before editing. Deleting all the text and confirming also returns to the text before editing.
- An edit made on the view screen (not the edit screen) is saved immediately. An edit made on the edit screen is saved together with your other changes when you press Save.
- On the view screen, some labels cannot be edited.
- A label with a link -- pressing it opens the link. Edit it on the edit screen.
- A dashboard that has never been saved.
- Only the text can be edited. To change the size, colours, alignment, or link, delete the label and add it again.
- Turning the mouse wheel over a label scrolls the dashboard screen.
Note Label text is shown exactly as entered even when you switch languages (it is not translated).
Goal 3 — Changing the Layout and Size
Widgets can be moved and enlarged freely.
- Moving: drag the widget to where you want it.
- Resizing: drag the bottom right corner of the widget to make it larger or smaller.
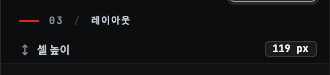
- The height of all rows: the 03 Layout ▸ cell height slider in the left panel adjusts the height of every row at once. (It applies to the whole thing, not an individual widget.)
Result -- once it is laid out as you want, only saving remains.
Goal 4 — Saving
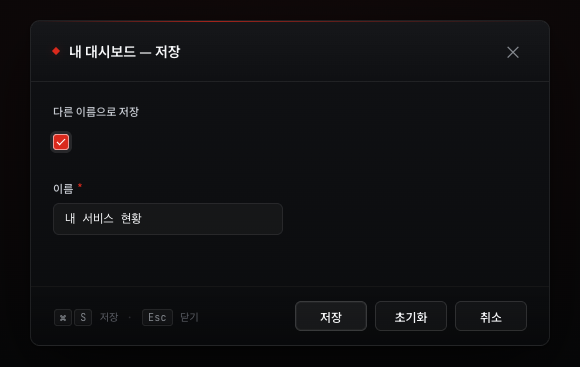
- Press the Save button at the bottom of the left panel.
- Enter the dashboard name in the save dialog.
- Pressing Save stores it and it appears in the My Dashboard list on the left.
Result -- from now on you can open this dashboard straight from the left menu.
A saved dashboard belongs only to your account (to whoever made it).
Goal 5 — Editing an Existing Dashboard
- Open the dashboard to edit from My Dashboard on the left.
- In the edit screen, add, move, or delete widgets, or change their size. The left panel title shows "Dashboard: (the dashboard name)", with the Save, Delete, and Cancel buttons below it.
- Pressing Save overwrites the existing dashboard.
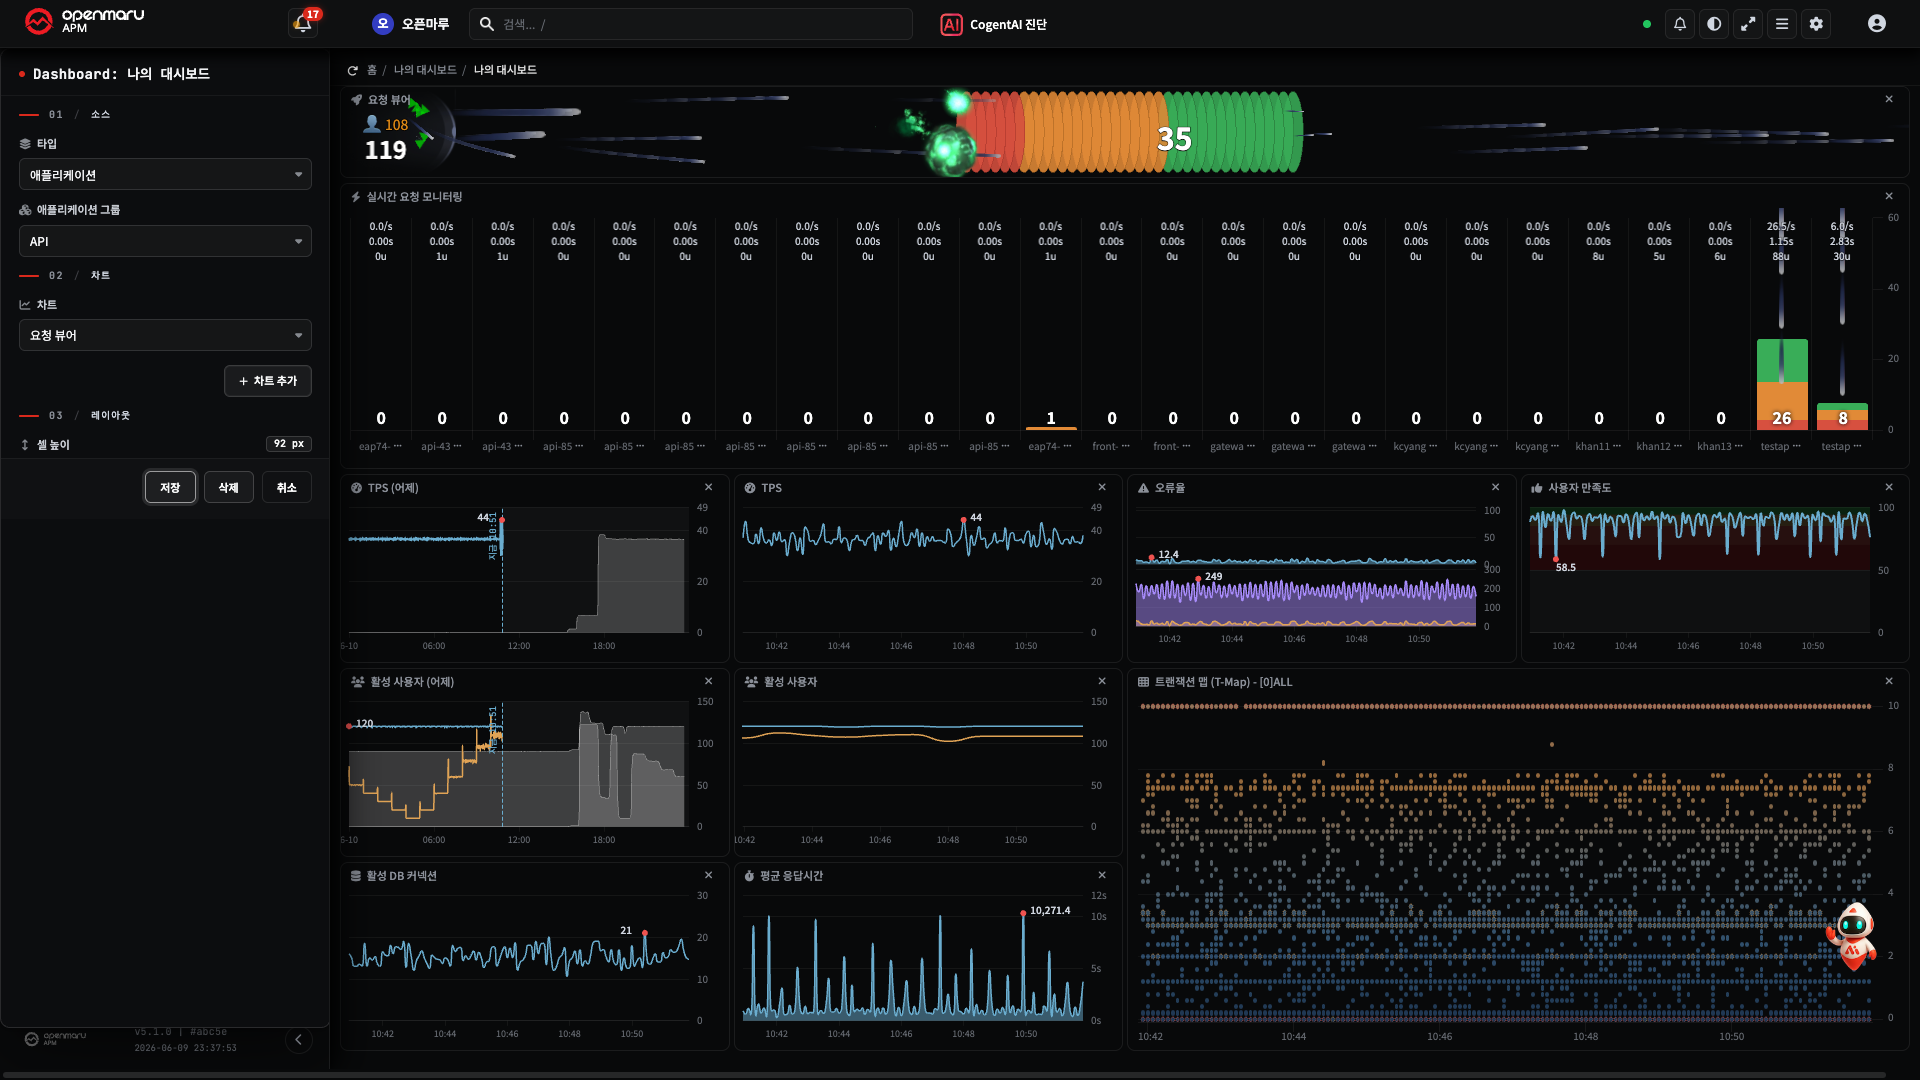
Note To keep the original and save separately under a new name, check Save as in the save dialog and enter the new name.
Goal 6 — Deleting a Dashboard
- Open the dashboard to delete in the edit screen.
- Press the Delete button at the bottom of the left panel. (The delete button appears only when editing an existing dashboard.)
- Confirming in the confirmation window removes it.
Result -- it disappears from the list on the left.
Worth Knowing
- "My Dashboard" is not favourites but a user-defined dashboard built from widgets you pick yourself.
- Layout and size changes are made by dragging, and are kept exactly as they are when saved.
- Several dashboards can be made. (They accumulate in the list.)
- Besides charts, you can add a text label that holds only text (Goal 2-1).
Related Documents
- R2. Chart Metric Reference -- for choosing which charts to include
- H1. Narrowing the Monitored Target · H2. Changing the Period
- R1. Screen Map -- where the built-in dashboards (WAS, server, and so on) are