H8. Diagnosing Database Connection Pool Exhaustion
Diátaxis: How-to · Audience: operators / administrators ← Back to contents
When "the database is fine but only the application is slow or stalled", or "requests queue up one after another only at certain times", suspect connection pool exhaustion. With no connection left in the pool to lend out, the requests behind wait until they get one, then time out. This document is the order for diagnosing it with the WAS Datasources tab.
For what a connection pool is, and the group and instance concepts, see E2. Core Concepts; for the chart thresholds, see R2.1 WAS Charts — Datasources.
How to open it -- left menu ▸ WAS ▸ (choose the instance) ▸ Datasources tab
Checking the Datasource Pool Active and Waiting
On the Datasource Pool chart (the active database connections tab), see how close the connections in use (Active) are to the maximum pool size (Max).
| Shape | Interpretation |
|---|---|
| Active is comfortably below Max | Normal -- there is headroom |
| Active often touches Max (pinned to the ceiling) | Watch -- the pool is tight. Waiting is about to appear |
| Active is flat, pinned to Max | Danger -- exhausted. New requests cannot get a connection and are waiting |
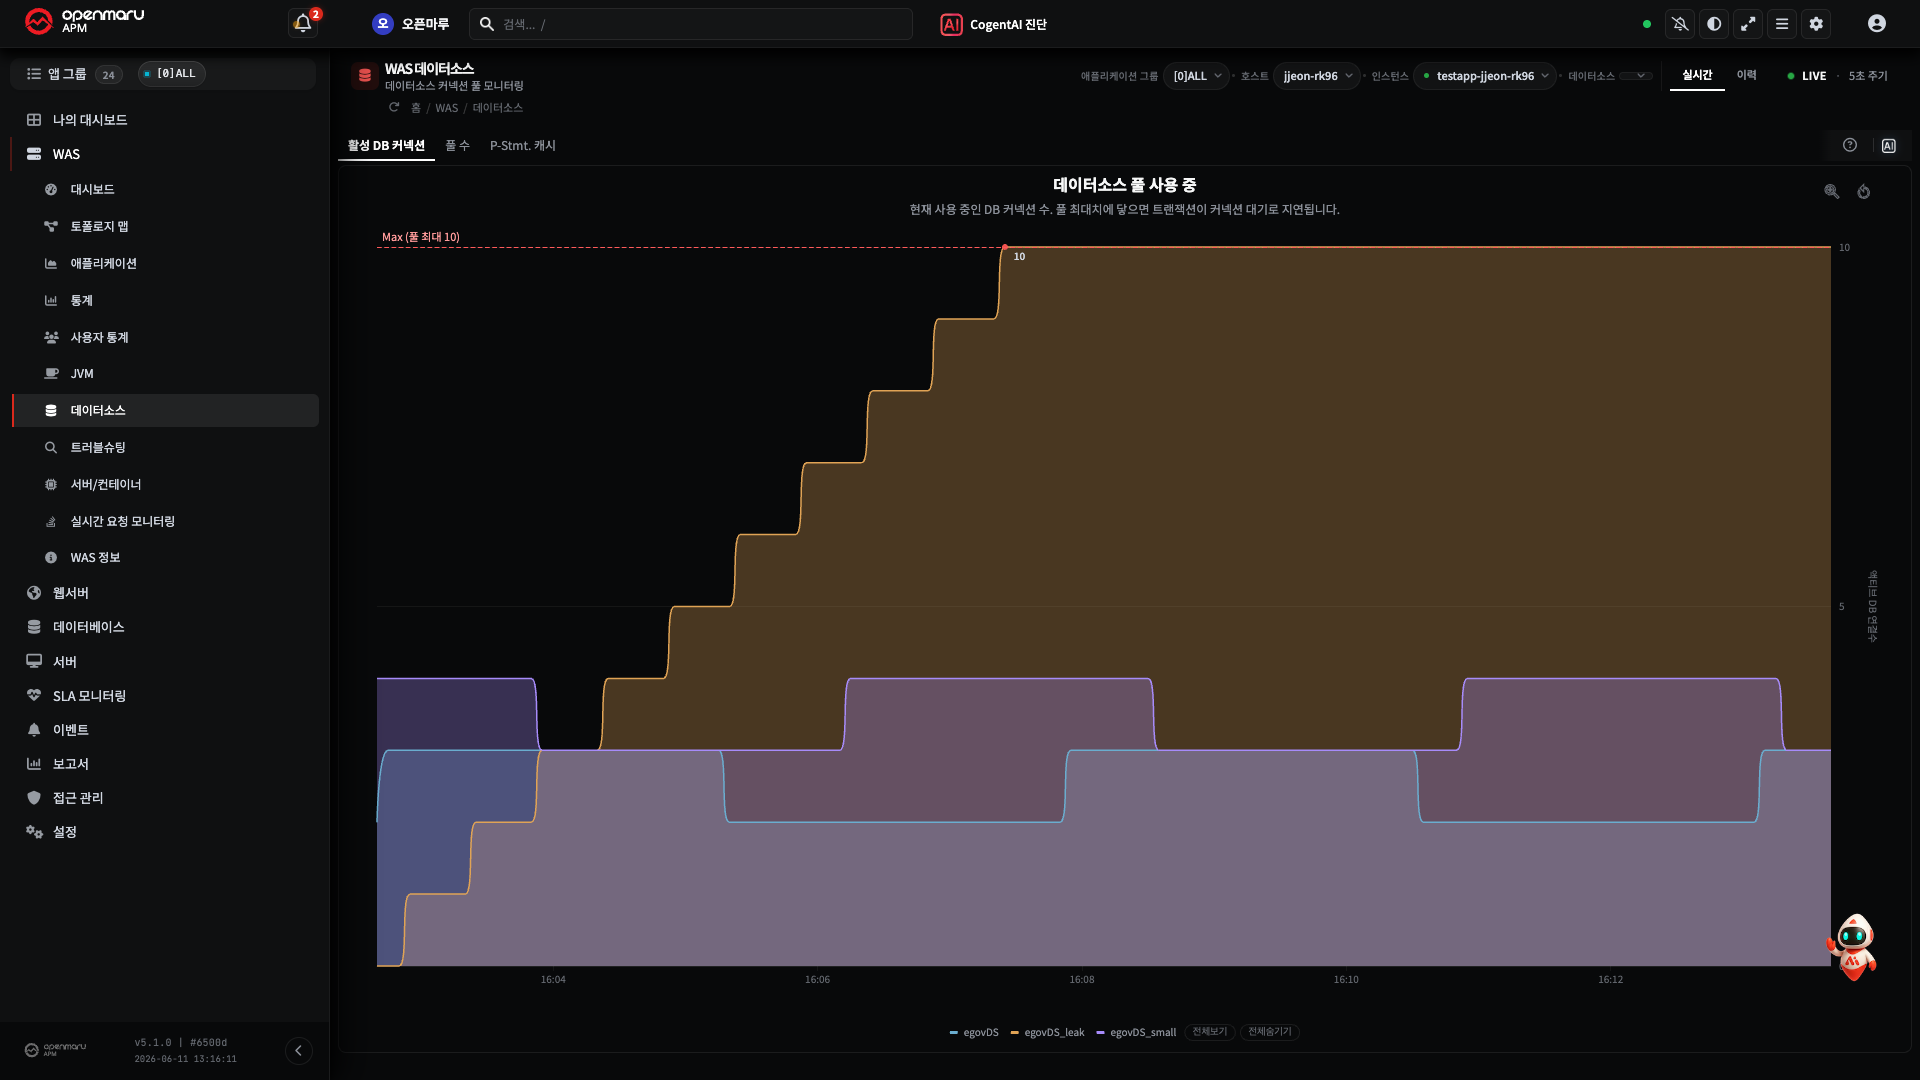
The screen above is one instance with three datasources (egovDS, egovDS_leak, egovDS_small). Only egovDS_leak has climbed like a staircase and gone flat, pinned to Max (10) -- exhausted. The other two are low and stable, so the problem is confined to that one datasource.
Note With several datasources, start by separating out which datasource it is. If only one database is pinned to the ceiling, either the queries going to that database are slow, or the connections on that path are not being returned.
Caution "Active pinned to Max" has two causes -- ① the queries are slow and hold connections for a long time, or ② the connections are not being returned (a leak). The next two sections separate the two.
Checking for Connection Leak Events
Borrowing a connection and not returning it (a missing close() in the code, and so on) dries
the pool up gradually. A leak differs from a temporary overload in that "it stays exhausted and does
not recover".
- How to tell -- if Active does not come down even after the traffic has fallen, it is a leak.
- Check whether datasource-related events (thresholds exceeded and so on) have piled up in R3. Event Reference.
- Restarting the instance clears it for a while, but with the leaking code unchanged it recurs after the same interval.
The Connection Wait Pattern in a Transaction Detail
Whether "waiting because no connection is available" is actually happening is most reliably confirmed by opening one transaction.
- Open one slow transaction from the statistics or transaction analysis.
- In the waterfall (the processing segments), see whether there is a long empty stretch (waiting) before the database work starts -- if that is waiting to acquire a connection rather than query execution, it is the signal of pool exhaustion.
- Conversely, if there is no empty stretch and the query execution itself is slow, it is not the pool but the query, so move on to H6. Finding the Cause of a Slow Transaction.
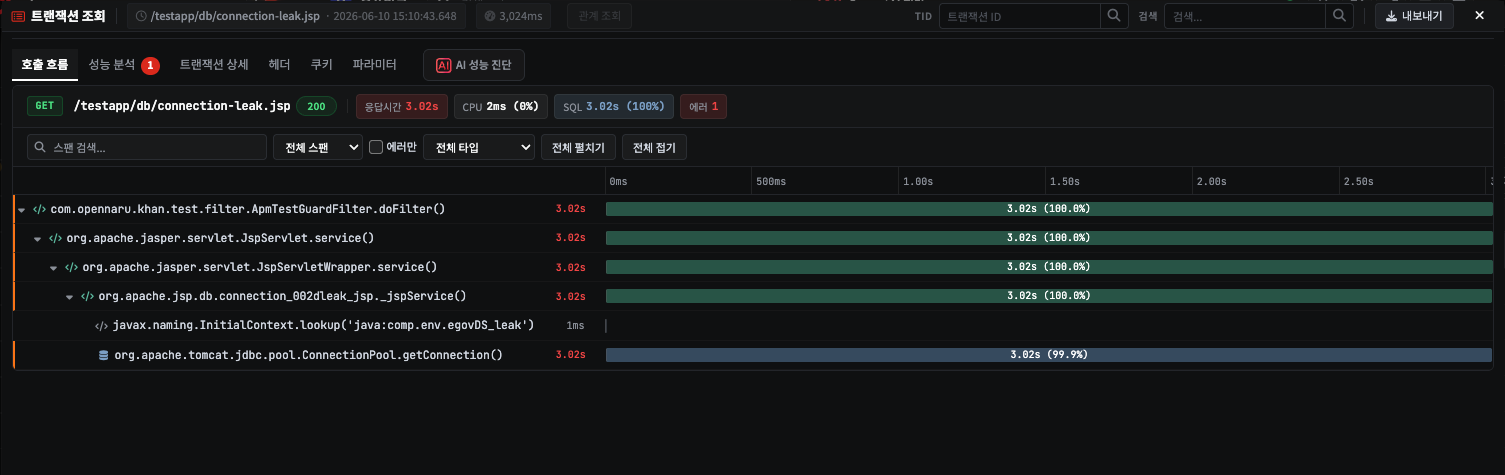
In the example above the ConnectionPool.getConnection() bar takes the whole transaction time -- the
SQL is not slow; all the time went into borrowing a connection, which is decisive evidence of
pool exhaustion.
Going straight to the pool chart from the performance analysis tab -- if the performance analysis tab of the same transaction has a Connection Pool Wait card, its header also shows the pool usage at that time.
- Look at the state next to
Pool Usage <pool name> In Use N / Max M. Pool Exhausted means the pool was full at that time; Pool Available means it was not (look at new connection creation or the validation query). - Pressing Open Chart → closes the transaction detail window and opens the WAS ▸ Datasources screen for that instance and pool, over the 5 minutes before and after the transaction. Read the trend there by the table in Checking the Datasource Pool Active and Waiting above.
Note The pool usage is the value of "that instance's pool at that time"; which pool the transaction waited on cannot be told. With several pools, only the one with the highest usage ratio is shown. If there is no metric for that time, neither the pool usage nor Open Chart appears -- for details see H6 pattern 7. Connection Pool Wait.
How to read a transaction detail is set out step by step in T2. Tracing One Slow Request All the Way.
What to Do
| What was confirmed | First action |
|---|---|
| Slow queries holding connections for a long time | Tune that SQL and check its indexes (H6) -- the root cause |
| Connections not returned (a leak) | Check the code for a missing close() (pass it to the development team). Consider enabling datasource leak detection |
| Everything is normal but the pool is small for the traffic | Raise the maximum pool size (but review it together with the database's max_connections) |
| Putting out the fire | Spread the traffic and restart the instances in turn for a first recovery |
Caution Enlarging the pool blindly can pass the database's connection limit (
max_connections) and make the database refuse connections instead. Keep the total of the WAS pools within the database limit.
When It Does Not Work
| Symptom | What to check |
|---|---|
| The Datasources tab is empty | The instance connection state -- H20. Checking Agents |
| The pool has headroom but the database is slow | Not a pool problem -- check the DBMS dashboard and diagnosis (R2.3 DBMS Charts) |
| Cannot separate connection waiting from query delay | Separate the segments with the transaction detail waterfall (T2) |
| The performance analysis card has no pool usage or Open Chart | No metric for that time (just after the agent starts, an old transaction, and so on) -- pick the period yourself in the Datasources tab (H6 pattern 7) |
Related Documents
- R2.1 WAS Charts — Datasources · R2.3 DBMS Charts
- H6. Finding the Cause of a Slow Transaction -- when the query itself is slow
- T2. Tracing a Slow Request -- reading a transaction detail and waterfall
- H14. Getting AI Analysis of Charts and Events