H12. Diagnosing JVM Open File Descriptor Exhaustion
Diátaxis: How-to · Audience: operators / administrators ← Back to contents
When Too many open files appears in the log, or "it runs well for a long time and then suddenly
cannot open a file or socket and requests fail", the JVM's open file descriptors (FDs) have reached
the limit. In Java, files, sockets, and pipes are all counted as one file descriptor each, so
when database connections, HTTP sockets, or opened files are not returned, the FDs dry up. This
document is the order for diagnosing it with the WAS ▸ JVM ▸ Open Files tab.
For the heap and GC concepts, see E3.2 JVM Health; for the chart thresholds, see R2.1 WAS Charts — JVM. Memory leaks are in H7. Checking for a Memory Leak.
How to open it -- left menu ▸ WAS ▸ (choose the instance) ▸ JVM ▸ Open Files tab
Reading the Open File Count against the Maximum
The Open Files chart shows the number of FDs currently open together with the maximum allowed (ulimit). How close the current value is to the limit is the point.
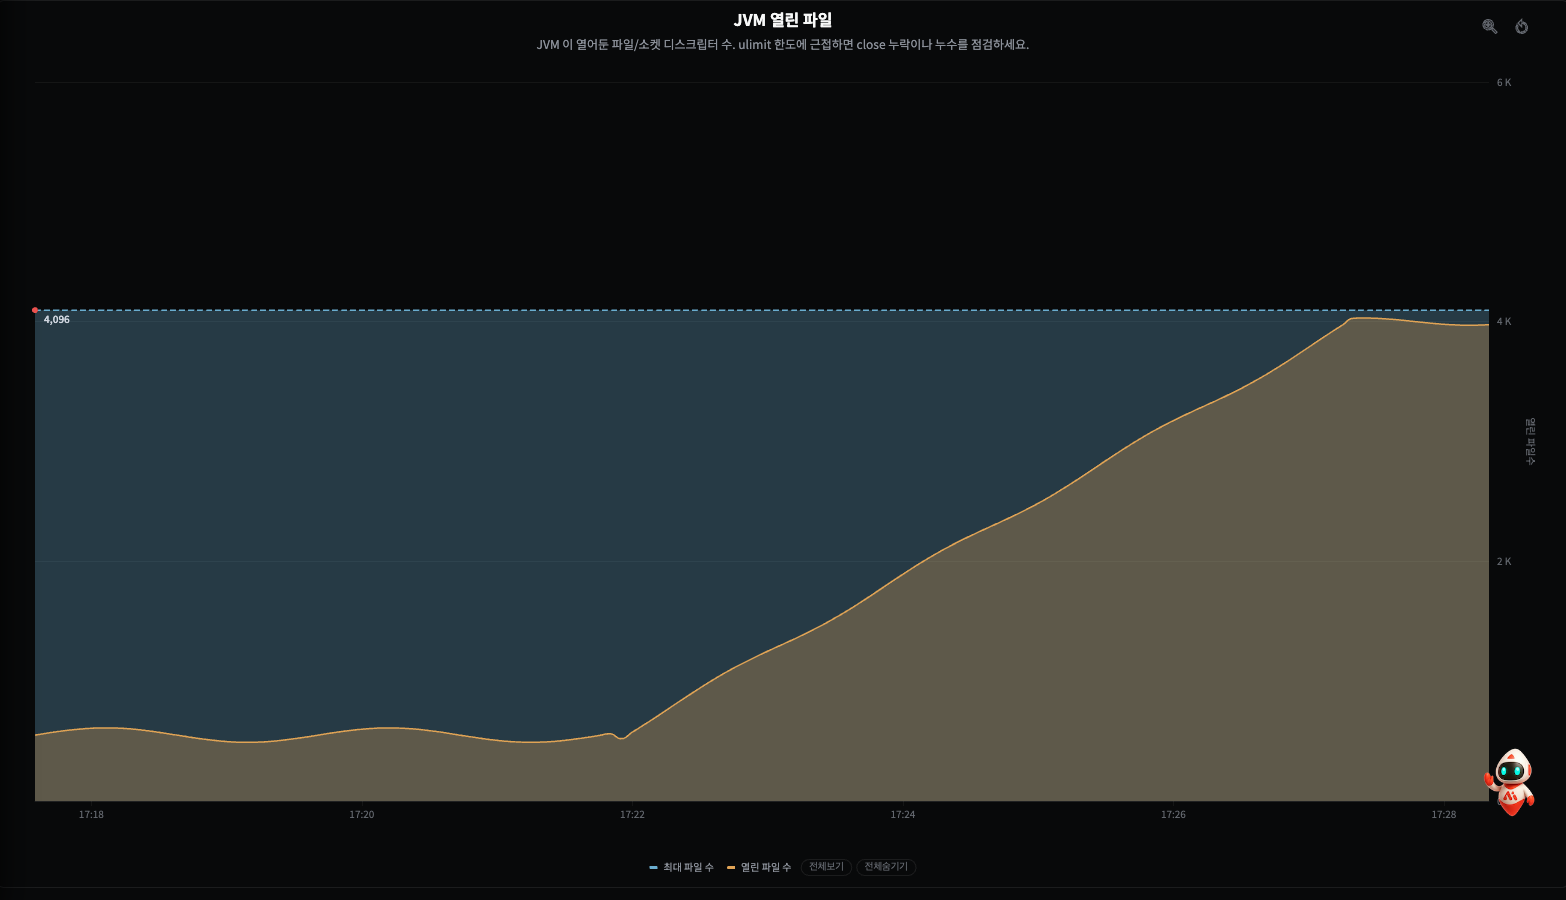
The screen above is the shape of an FD leak in progress -- the open file count (orange) stays in
a normal sawtooth and then, from some point, climbs like a staircase until it finally goes
flat, pinned to the maximum (ulimit, the blue dotted line). That state is just before
Too many open files.
| Shape | Interpretation |
|---|---|
| The current value is comfortably below the limit | Normal -- there is headroom |
| The current value often touches the limit (pinned to the ceiling) | Watch -- FDs are tight. Too many open files is close |
| The current value climbs like a staircase and goes flat against the limit | Danger -- an FD leak. Handles that are not returned are piling up |
Note In normal operation the current value rises and falls like a sawtooth (opening and closing repeatedly). If it does not come down and keeps climbing even as GC and traffic fall, it is a leak -- open the last day to week with H2. Changing the Period and see whether the floor is rising.
Caution "The current value pinned to the limit" has two causes -- ① a momentary spike in traffic leaving many concurrent connections and files open (it comes down when the load clears), or ② a leak where handles are not returned (it does not come down). Separate them by the trend.
Narrowing Down What Is Holding the FDs
FDs count both files and sockets. Start by separating which is accumulating.
- Sockets are the cause -- if CLOSE_WAIT and ESTABLISHED also pile up at the same time in H11. Diagnosing Excessive Server Sockets, unclosed network connections are eating the FDs. Suspect connection pools not being returned, or external API socket leaks.
- Files are the cause -- if the sockets are normal and only the FDs rise, it is code that does not close the file streams or temporary files it opened. Check the log, upload, and cache file paths.
- WAS troubleshooting as an aid -- Troubleshooting ▸ Open File Analysis, beside the JVM tab, fetches the list of files and sockets open at that moment, so you can see directly which path's handles are abnormally numerous.
What to Do
| What was confirmed | First action |
|---|---|
| An FD leak (climbing, not coming down) | Check the code for streams and sockets not returned (missing try-with-resources or close()) -- pass it to the development team. The root cause |
| Sockets are eating the FDs | Check connection pool returns and external API socket cleanup → H11. Excessive Server Sockets |
| Not a leak, but the limit is small | Raise the OS ulimit -n (or systemd LimitNOFILE) -- with the infrastructure team, securing headroom for the traffic |
Too many open files has already happened | Spread the traffic and restart the instances in turn to recover the FDs first |
Caution Raising the limit (
ulimit) blindly only delays a leak; it does not resolve it. Where a climbing trend is visible, the code that fails to return handles has to be caught first for it not to recur.
When It Does Not Work
| Symptom | What to check |
|---|---|
| The Open Files tab is empty | The instance connection state -- H20. Checking Agents |
| FDs have headroom but the response is slow | Not an FD problem -- check the heap and GC (H7) and the database pool (H8) first |
| FDs rise but the path behind it is unknown | Get the handle list with Troubleshooting ▸ Open File Analysis and separate the socket and file share |