H20. Checking Agent Status and Resolving Problems
Diátaxis: How-to · Audience: administrators -- the Agent Status menu is visible only to accounts with administrator permission ← Back to contents
When a chart is empty or data stops arriving from one particular instance, the first place to look is the Agent Status screen. The agent is the collector attached to each instance that gathers data and sends it to the APM server, so when it is cut off the screen empties too.
For the agent and instance concepts, see E2.1.
How to open it -- left menu ▸ Settings ▸ Agent Status (/settings/agents, visible to
administrators only)
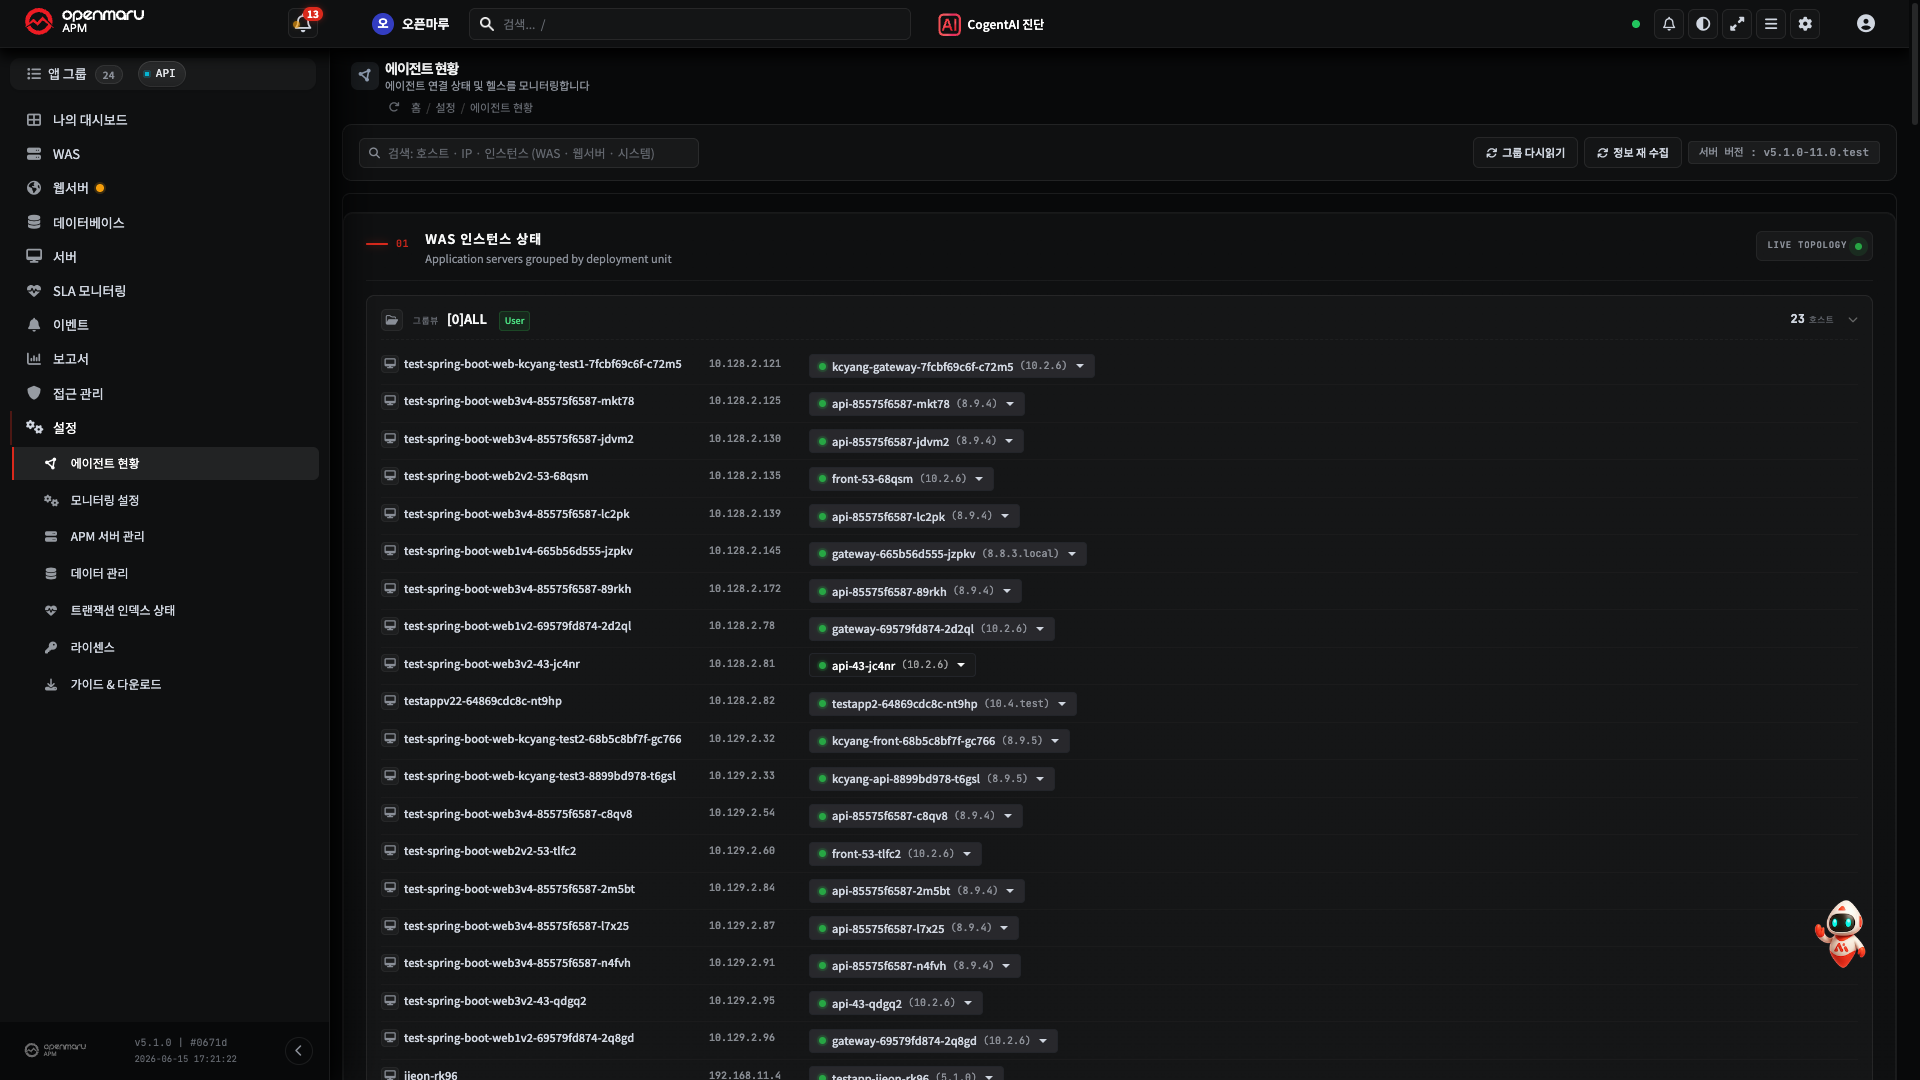
Reading the Agent Status Screen
The screen is divided into the WAS, web server, and system areas, with the instances laid out as
cards in each. The count badge to the right of each area header (22 / 22, for example) is
connected / total.
The state is shown per instance with a status dot and colour.
| State | Meaning |
|---|---|
| RUNNING | The agent is connected and collecting normally (the dot blinks slightly) |
| STOPPED | The connection has dropped or the instance is down -- no data is being collected |
Each instance's IP and version are shown too. A mix of instances on different versions suggests an agent update was missed.
Note When the "connected / total" in the count badge does not match (
21 / 22, for example), one is missing. Which area and which instance is STOPPED can be found straight away.
Responding to a Dropped Connection or No Response
When you meet an instance that is STOPPED or from which no data arrives, narrow it down in this order.
- Check the current state with a refresh -- press Refresh Groups / Collect information again at the top of the screen, or Agent Refresh in that instance's menu, to fetch the current state again.
- Tell whether it is actually down -- check whether the instance (the process) itself has stopped, or whether it is alive and only the agent connection has dropped. The former needs the instance brought back up; the latter is a network or agent configuration problem.
- Web server LB workers can be operated directly with Start/Stop in the instance menu.
Caution These actions first bring up a confirmation window explaining what they do, and run only after you press Yes. They can affect production, so read the confirmation window before going ahead.
A dropped connection usually also arrives as an event (agent stopped, and so on). For the meaning of each event, see R3. Event Reference.
Responding to Agent Duplicate Detection
When two agents connect to the collection server with the same identity, the collection server
rejects one of the connections and reports it in the Alert bell window of the header, on the
Agent Duplicate Detection tab. The tab appears only when there are rejections. The identity is
IP + instance.id for a WAS agent and the IP for a SYS agent.
Expanding an item on the tab shows the following.
| Display | Meaning |
|---|---|
WAS · <IP> · <instance> / SYS · <IP> | The kind and identity of the agents in conflict |
PID <new> ↔ <existing> | The PIDs of the process trying to connect and the process already connected |
| Host · First conflict · Latest conflict | The host name and the first and latest conflict times |
| Accumulated N rejections | How many times it has been rejected so far |
| Action guide | Guidance that differs by agent kind (the table below) |
| Agent | Action guide |
|---|---|
| WAS | ① Change instance.id in khan-agent.conf ② Restart the agent |
| SYS | ① Check khan.agent.ip in khan-sys-agent.conf on each server ② Check whether a /32 virtual IP on the lo interface is reported as the agent address ③ If two agents are running on the same host, stop one of them |
A SYS agent has no instance.id setting, so do not follow the WAS guidance for it. Typical cases are
different servers reporting the same IP, and two SYS agents running on one server.
- Once no rejection recurs for 15 minutes after the fix, the item disappears automatically.
- A rejected agent keeps trying to connect, and the interval between attempts grows longer. So even if rejections seem to pause for several minutes, the problem may not be solved.
Note Even when SYS agents are duplicated, the Agent Status screen may merge the two agents into one line and show RUNNING. Check for duplicates on the Agent Duplicate Detection tab of the Alert bell. With several collection servers (a cluster), a screen connected to a server other than the one that recorded the rejection may not show this tab.
Requesting a Thread Dump or Heap Dump
When "the instance is alive but there is no response" (unresponsive, hung), request a dump to see where it stalled.
- Thread Dump Analyze -- see what the threads were doing when they stalled. Useful when you suspect a deadlock or lock contention.
- Heap Object Analyze -- see what has accumulated in memory (leak candidates).
A dump is sometimes collected automatically when a deadlock or OOM event occurs. The diagnostic procedure for memory and leaks is set out in detail in H7. Checking for a Memory Leak.
Caution Collecting a dump loads the JVM at that moment. Request it at a quiet time of day, and only on the instance you need.
When It Does Not Work
| Symptom | What to check |
|---|---|
| The Agent Status menu is not visible | Check the account has administrator permission -- agent status is visible only to administrators |
| Still STOPPED after a refresh | Whether the instance (the process) is actually up, and the host and network state |
| Data arrives but the versions vary | An agent update was missed -- check for the latest agent under Guide & Downloads |
| Only the charts are empty while the state is RUNNING | It may be a selector target or period problem → H1 · H2 |
The state is RUNNING but the dashboard shows - | The agent is connected but no metric values arrive (the agent process has stalled, OS metric collection failed, collection is delayed, and so on). Showing 0 would make it look like an idle server, so - is shown. Check the agent process state and the agent log on that host -- the rule per screen is in R2.4 System (Server) Charts |
| An Agent Duplicate Detection tab appears in the Alert bell | Two agents are trying to connect with the same identity -- Responding to Agent Duplicate Detection |
Related Documents
- E2.1 Application Groups, Instances, and Agents -- the agent concept
- R3. Event Reference -- the agent stopped, deadlock, and OOM events, and agent duplicate detection
- H7. Checking for a Memory Leak -- using heap and thread dumps
- H1. Narrowing the Monitored Target -- checking the selector when a chart looks empty