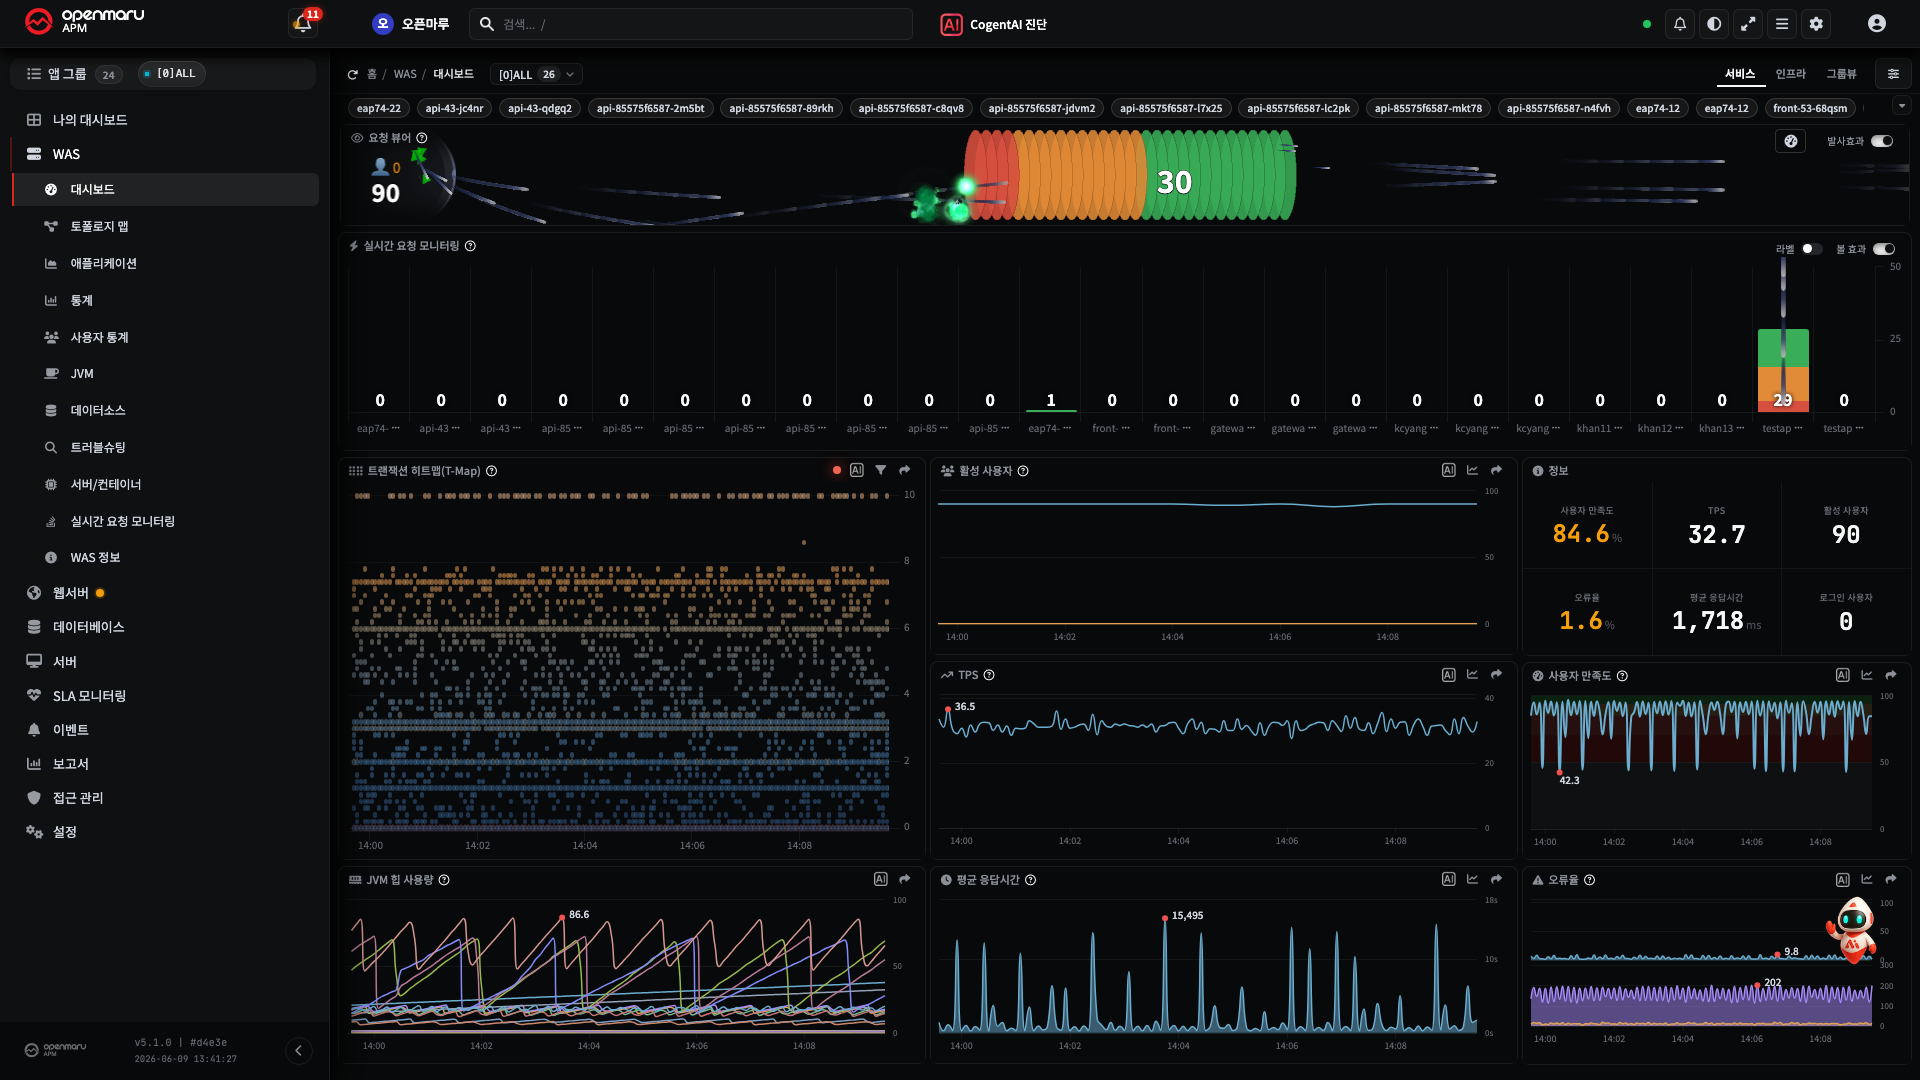
R1. Screen Map -- The Whole Two-Level Menu
Diátaxis: Reference · ← Back to contents
This is the whole major category → minor category of the left menu, with one line on what each
screen shows. For how to use a screen, see the relevant how-to (H*); for chart metrics, see
R2. Chart Metric Reference. (Administrators only) = administrators only,
(new) = new in the 2026 renewal.
The number badge beside a menu item is the number of instances currently registered. Depending
on the environment configuration, Kubernetes, trace, and telemetry menus can also appear.
WAS
| Menu path | What it shows |
|---|
| WAS ▸ Dashboard | The whole WAS picture on one screen (TPS, active users, T-Map, JVM, resources) |
| WAS ▸ Topology Map | The transaction heatmap (T-Map) -- the service response distribution and patterns |
| WAS ▸ Application | A set of key charts on the Overview tab (new) |
| WAS ▸ Statistics | Call statistics, slowest URLs, error statistics (tabs) |
| WAS ▸ User Statistics | Daily, weekly, and monthly active users |
| WAS ▸ JVM | Heap, GC, threads, classes, open files |
| WAS ▸ Datasources | Database connection pool, active and waiting |
| WAS ▸ Troubleshooting | Tracing slow transactions and problem patterns |
| WAS ▸ Server/Container | WAS host resources and containers |
| WAS ▸ Request Velocity | Requests in flight, in real time (Velocity, Missile) |
| WAS ▸ WAS Info | Instance metadata |
Web Server
| Menu path | What it shows |
|---|
| Web Server ▸ Dashboard | The whole picture of the web tier |
| Web Server ▸ Web Performance | Traffic, RPS, workers, connection state |
| Web Server ▸ Web Server Info | Web server metadata |
Database (DBMS)
| Menu path | What it shows |
|---|
| Database ▸ Dashboard | The whole DBMS picture |
| Database ▸ Cluster View | Cluster KPIs and per-member trends |
| Database ▸ Instance View | Instance metrics (connections, InnoDB, cache, locks, queries) |
| Database ▸ DBMS Diagnosis | Diagnosis of parameters, indexes, top SQL, and slow queries |
| Database ▸ Database Info | Database metadata |
Server (System)
| Menu path | What it shows |
|---|
| Server ▸ Dashboard | The whole server picture |
| Server ▸ Resources | CPU detail, memory, load average |
| Server ▸ Disks | Disk usage and IO |
| Server ▸ Network | TCP connections, traffic, packets, errors |
| Server ▸ Containers (administrators only) | Container resources |
| Server ▸ Troubleshooting | Resolving server problems |
| Server ▸ Server Info | Host metadata |
SLA Monitoring
| Menu path | What it shows |
|---|
| SLA Monitoring ▸ SLA Dashboard | The current SLA state at a glance (new) |
| SLA Monitoring ▸ SLA Status | Service check results |
| SLA Monitoring ▸ SLA Report | Availability and attainment reports |
| SLA Monitoring ▸ SLA Setting (administrators only) | Registering service checks and setting targets |
Events
| Menu path | What it shows |
|---|
| Event ▸ Event List | Querying and searching the history, with an occurrence-count chart |
| Event ▸ Alert Policy (administrators only) | Threshold, recipient, and channel policies |
Reports
| Menu path | What it shows |
|---|
| Report ▸ Daily / Weekly / Monthly | Periodic summary reports |
| Report ▸ Excel Download | Extracting data |
| Report ▸ Operations Reports (administrators only) | A comprehensive operations view |
Access Management
The user management and application group menus are visible to every user (editing is for
administrators only), and group permissions and server groups are visible only to administrators.
| Menu path | What it shows |
|---|
| Access Management ▸ User Management | Adding and editing users (adding and deleting are for administrators only) |
| Access Management ▸ Group Permissions (administrators only) | Permissions per group |
| Access Management ▸ Application Groups | Bundles of monitored targets (editing is for administrators only) |
| Access Management ▸ Server Groups (administrators only) | Bundles of SYS agent servers by host name, IP, or manual assignment. Used by the TV wallboard server view → H22 |
Settings
Every submenu except Guide & Downloads is visible only to administrators.
| Menu path | What it shows |
|---|
| Settings ▸ Agent Status | Agent connections and versions |
| Settings ▸ Monitoring Settings | The collection, threshold, and other environment settings |
| Settings ▸ APM Server | An overview of the APM server and cluster |
| Settings ▸ Data Management | Data retention and cleanup |
| Settings ▸ Transaction Index | Checking the index state |
| Settings ▸ Licenses | The licence position |
| Settings ▸ Guide & Downloads | Downloading agents and documents |