H10. Responding to CPU and Disk Thresholds Being Passed
Diátaxis: How-to · Audience: operators / administrators ← Back to contents
When a server's (system's) resources pass a threshold, every WAS and database running on it slows with them. This document is the order for reading CPU, load, and disk on the system tab and separating out "what is saturated right now" to respond.
The thresholds per item on the system charts are set out in R2.4 System (Server) Charts. For how to choose the target server, see H1. Narrowing the Monitored Target.
How to open it -- left menu ▸ System ▸ (choose the host) ▸ Resources (CPU, memory, load) / Disks tab
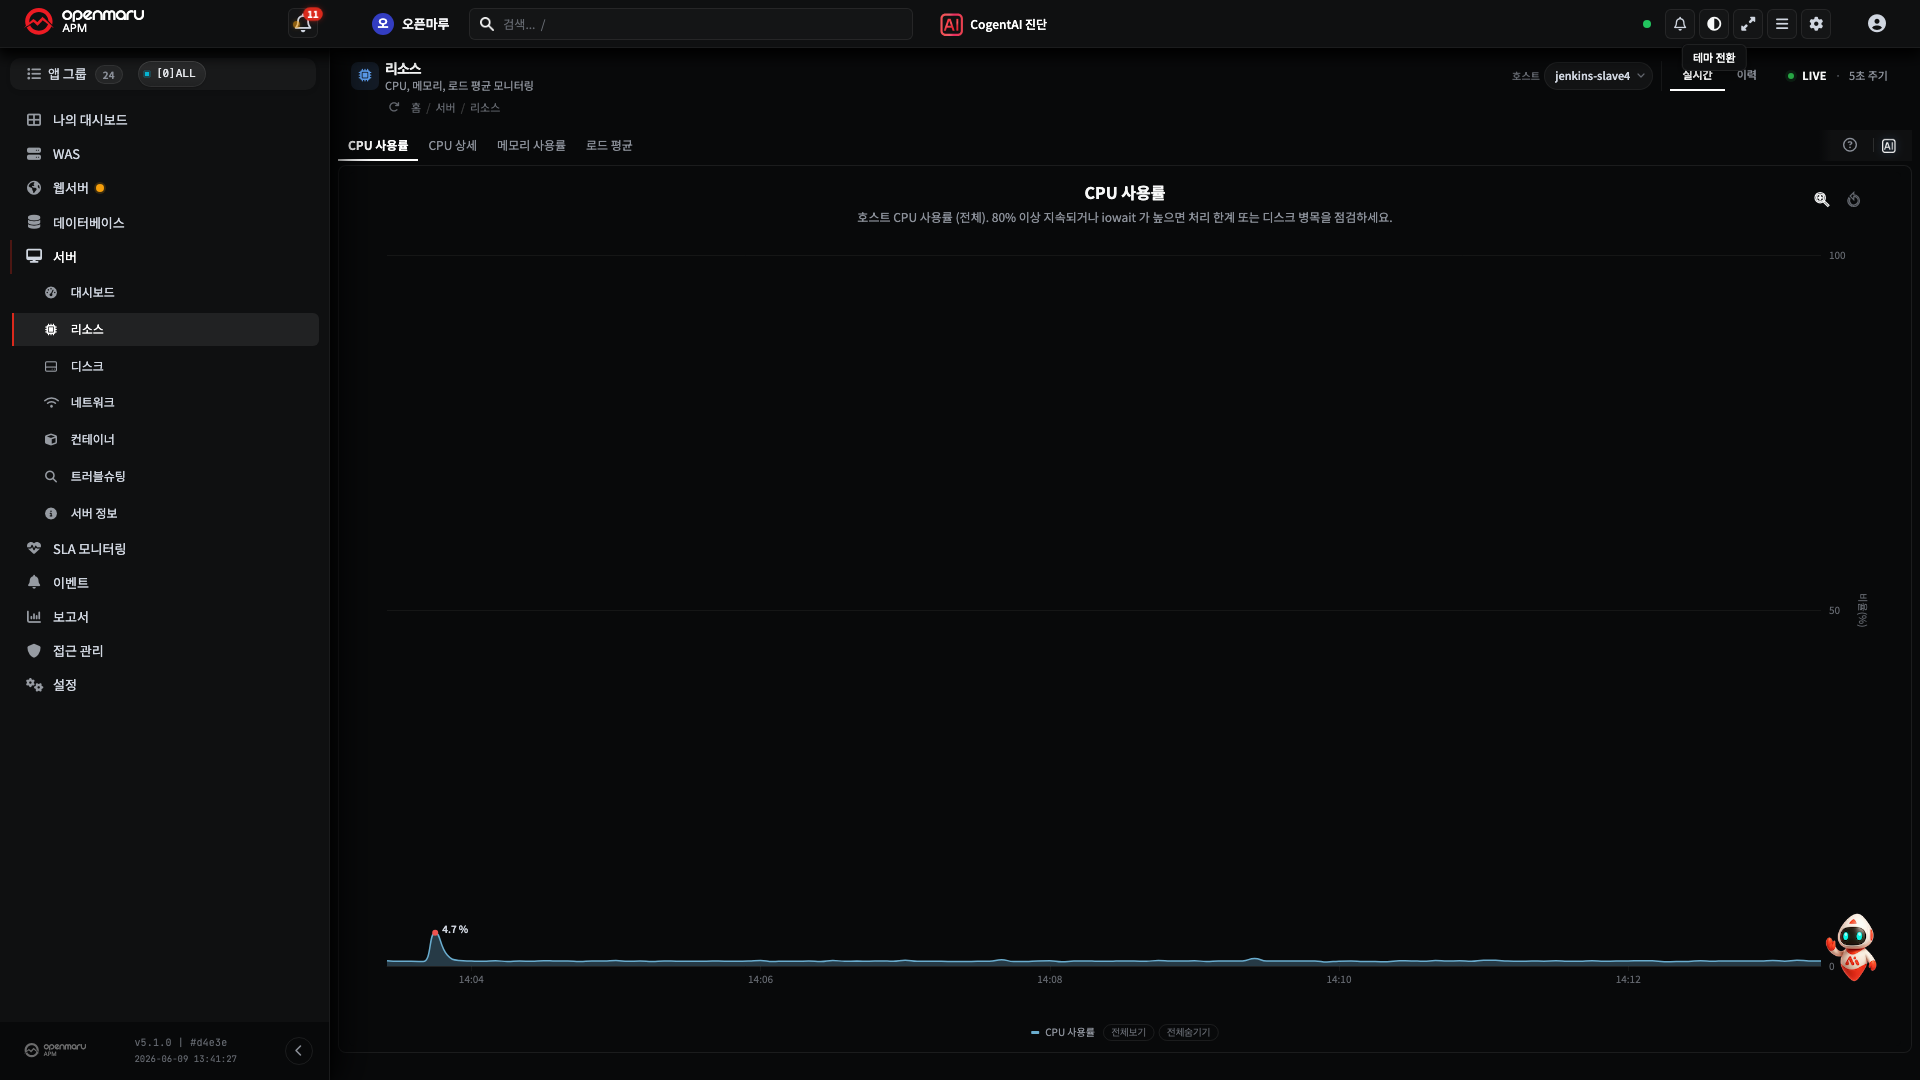
Reading CPU Detail (User/System/IOWait/Steal)
For CPU, what it is being used for separates the cause better than "what percentage". Look at the proportions per item on the detailed CPU utilization chart.
| The high item | Meaning and what to check next |
|---|---|
| User% | Application computation is using the CPU → trace which process or query |
| System% | Kernel overhead (excessive context switching or system calls) |
| IOWait% | The CPU is waiting on disk I/O → read the disk section first |
| Steal% | In a virtualized environment, the CPU is being taken by the host → review the infrastructure or cloud specification |
| SoftIRQ% | An interrupt storm (excessive network packets and so on) |
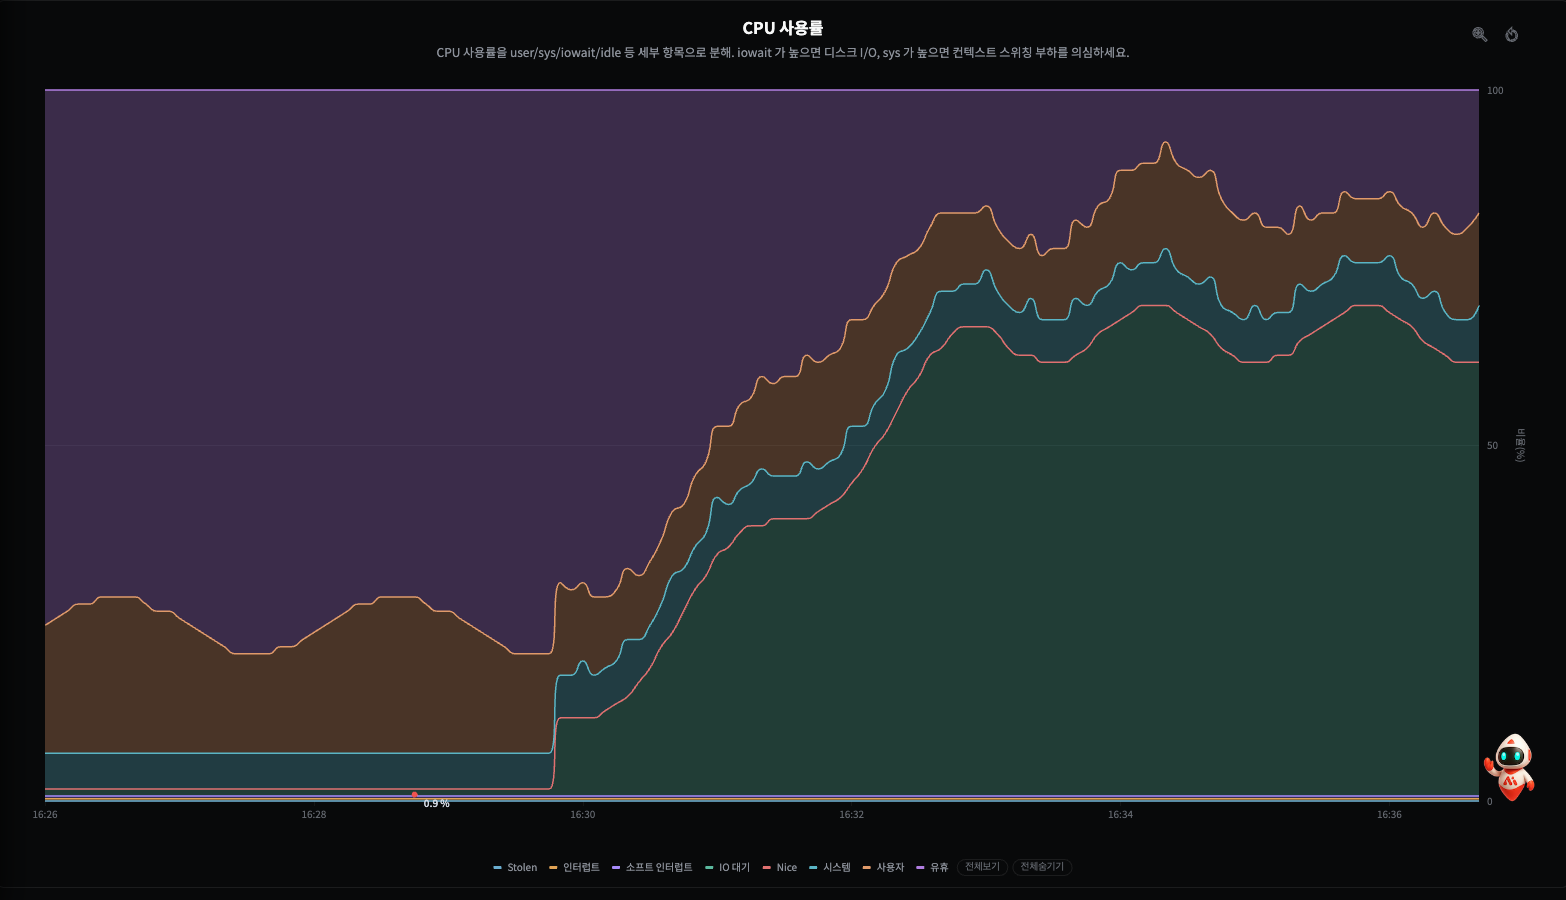
The screen above is exactly that case -- the total CPU rises but most of it is IOWait% (orange) while User% (green) stays low. It is not that the application is doing a lot of work; the CPU is tied up waiting on disk I/O. Read the disk section below first in that case.
Note "The CPU is high but User% is low and IOWait% is high" means the CPU is not short -- the disk is slow. Adding CPU alone does not fix it.
Interpreting the Load Average
Load average is "the number of tasks queued up to be worked on". Read it as the 1-, 5-, and 15-minute averages.
- The reference is the CPU core count. Load above the core count is an overload beyond the processing capacity. (8 cores with a load of 12, for example → overloaded.)
- 1-minute ≫ 15-minute → the load is rising. It is spiking now, so find the cause quickly.
- 1-minute ≪ 15-minute → the load is subsiding. It may be a peak that has already passed.
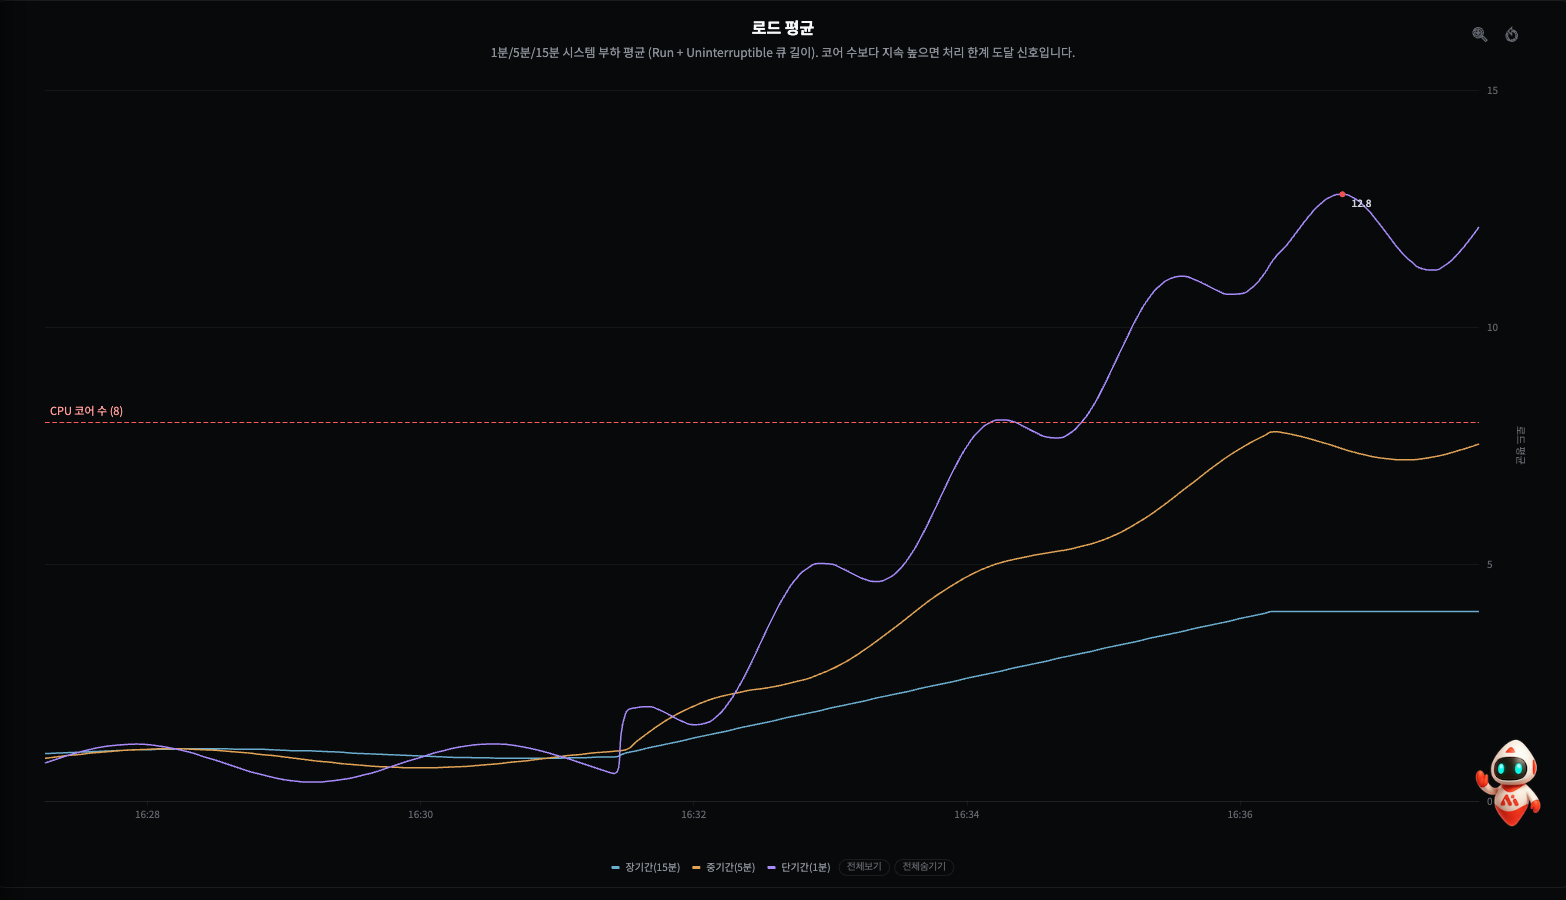
In the screen above the 1-minute value (purple) passes the core count (8) line and spikes to 12, with the 5- and 15-minute following behind -- an overload that is rising. The 1-minute moving first and highest is the shape of "spiking now".
When the load is high but the CPU (user/system) is low, the tasks are often queued not for CPU but for disk or lock waits. Read IOWait% and the disk charts alongside it.
Disk Usage and Rate of Growth
Disk is read two ways -- capacity and speed.
Capacity (disk usage)
- Above 90% is dangerous -- logs and temporary files filling up leads straight to a service failure.
- The rate of growth matters more than the absolute value. Open the recent trend with H2. Changing the Period and gauge "is this a slope that reaches 100% within days".
- Also read the file node count (inode) -- once inodes are exhausted, no new file can be created even with free space (in environments with a great many small files).
Speed (the Disks tab)
- An average service time above 20 ms, or an average queue length above 2 to 3, is saturation where the disk cannot keep up with the requests.
- High IOPS with the response time rising alongside is a disk bottleneck → it connects to the IOWait% above.
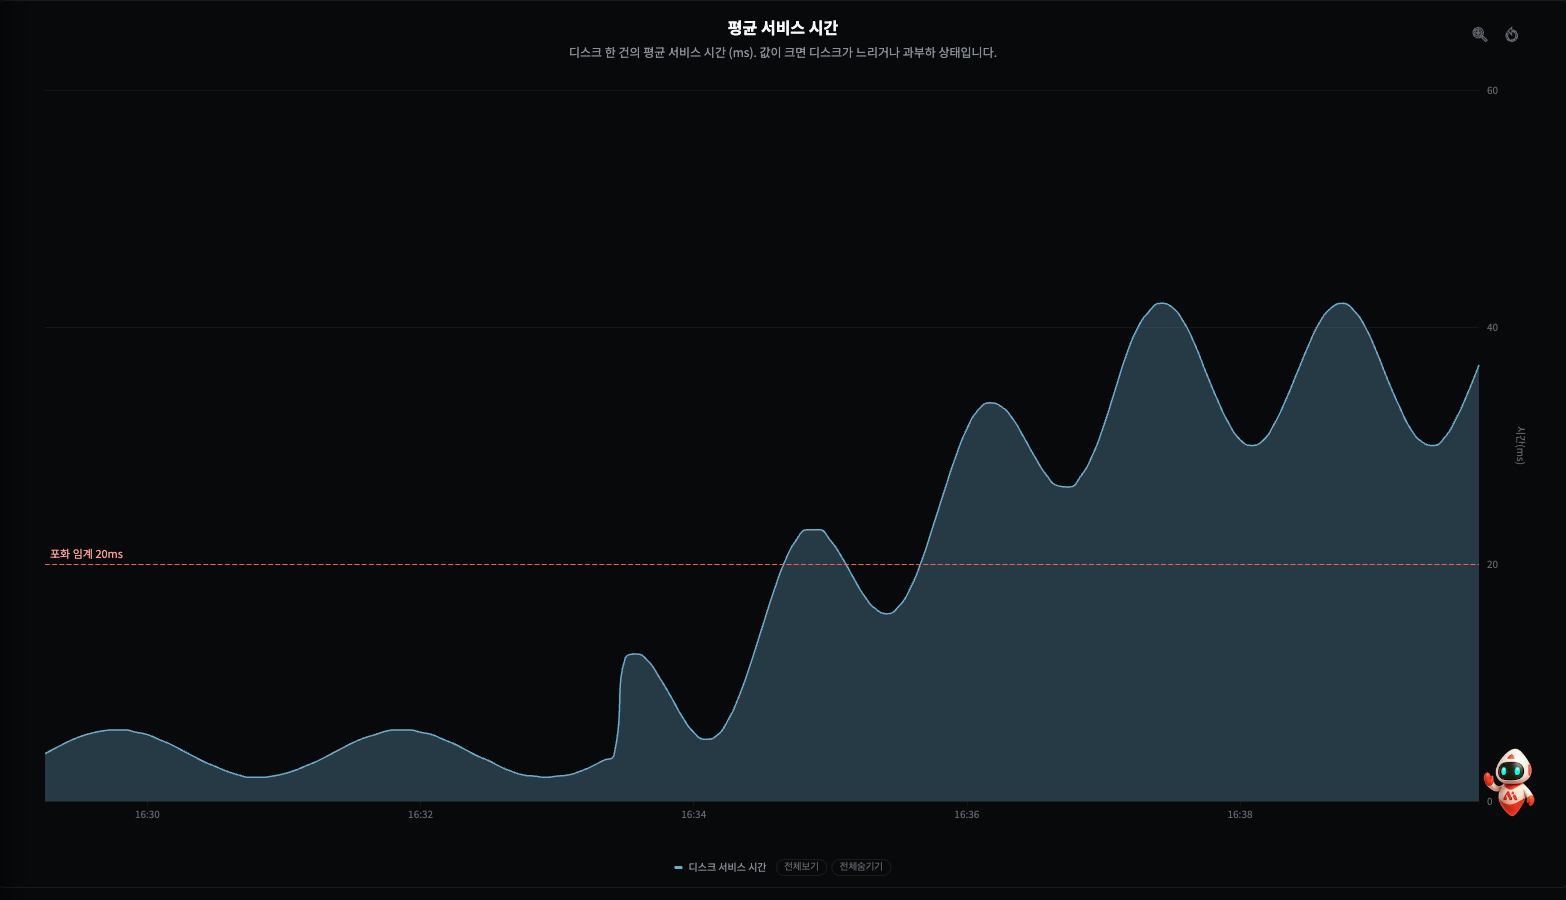
The screen above shows the average service time rising from normal (~5 ms) past the saturation threshold (20 ms) to 30 to 45 ms. The disk cannot handle the requests in time, and it is the other side of the same event as the IOWait% rise in the previous section.
The Disks tab: left menu ▸ System ▸ Disks. (
images/08/sys_disks_dark.png)
What to Do
| The saturation confirmed | First action |
|---|---|
| High User% (a particular process) | Trace that process or query. For a WAS, H6; for a database, DBMS diagnosis |
| IOWait% and disk saturation | Spread the heavy I/O work (batches, logs) or move its time of day; review the storage IOPS |
| High Steal% | Raise the virtual or cloud specification, or move to another host (the infrastructure team) |
| Disk capacity 90%+ | Clear old logs and temporary files, check the log rotation, add capacity |
| Rising swap usage | Physical memory is short -- check the memory-consuming processes or add RAM |
Caution CPU and disk thresholds also arrive as event alerts. When threshold events repeat on the same host, treat it with the alert policy and capacity planning rather than a one-off response (H15).
When It Does Not Work
| Symptom | What to check |
|---|---|
| No data on the system tab | The host's system agent connection state -- H20. Checking Agents |
| The CPU is high but no process behind it is visible | Check the IOWait% and Steal% proportions first -- the bottleneck may be outside the CPU |
| The threshold is passed but the service is fine | It may be a momentary peak -- widen the period and check whether it persists (H2) |
Related Documents
- R2.4 System (Server) Charts -- the CPU, load, disk, and network thresholds
- H6. Finding the Cause of a Slow Transaction · H8. Database Connection Pool Exhaustion
- H15. Creating Alert Policies -- receiving threshold excursions as alerts
- H14. Getting AI Analysis of Charts and Events