H7. Checking for a Memory Leak (Heap, GC, Heap Dump)
Diátaxis: How-to · Audience: operators / administrators ← Back to contents
"It gets slower as time passes and occasionally stalls" and "it is fine for a while after a restart" are the classic symptoms of a memory leak. This document sets out the order for separating a leak out with the WAS JVM tab charts and, when one is suspected, digging as far as heap object analysis.
For the concept of "what heap and GC are", see E3.2 JVM Health; for the exact thresholds per chart, see R2.1 WAS Charts — JVM. How to choose the target instance is in H1. Narrowing the Monitored Target.
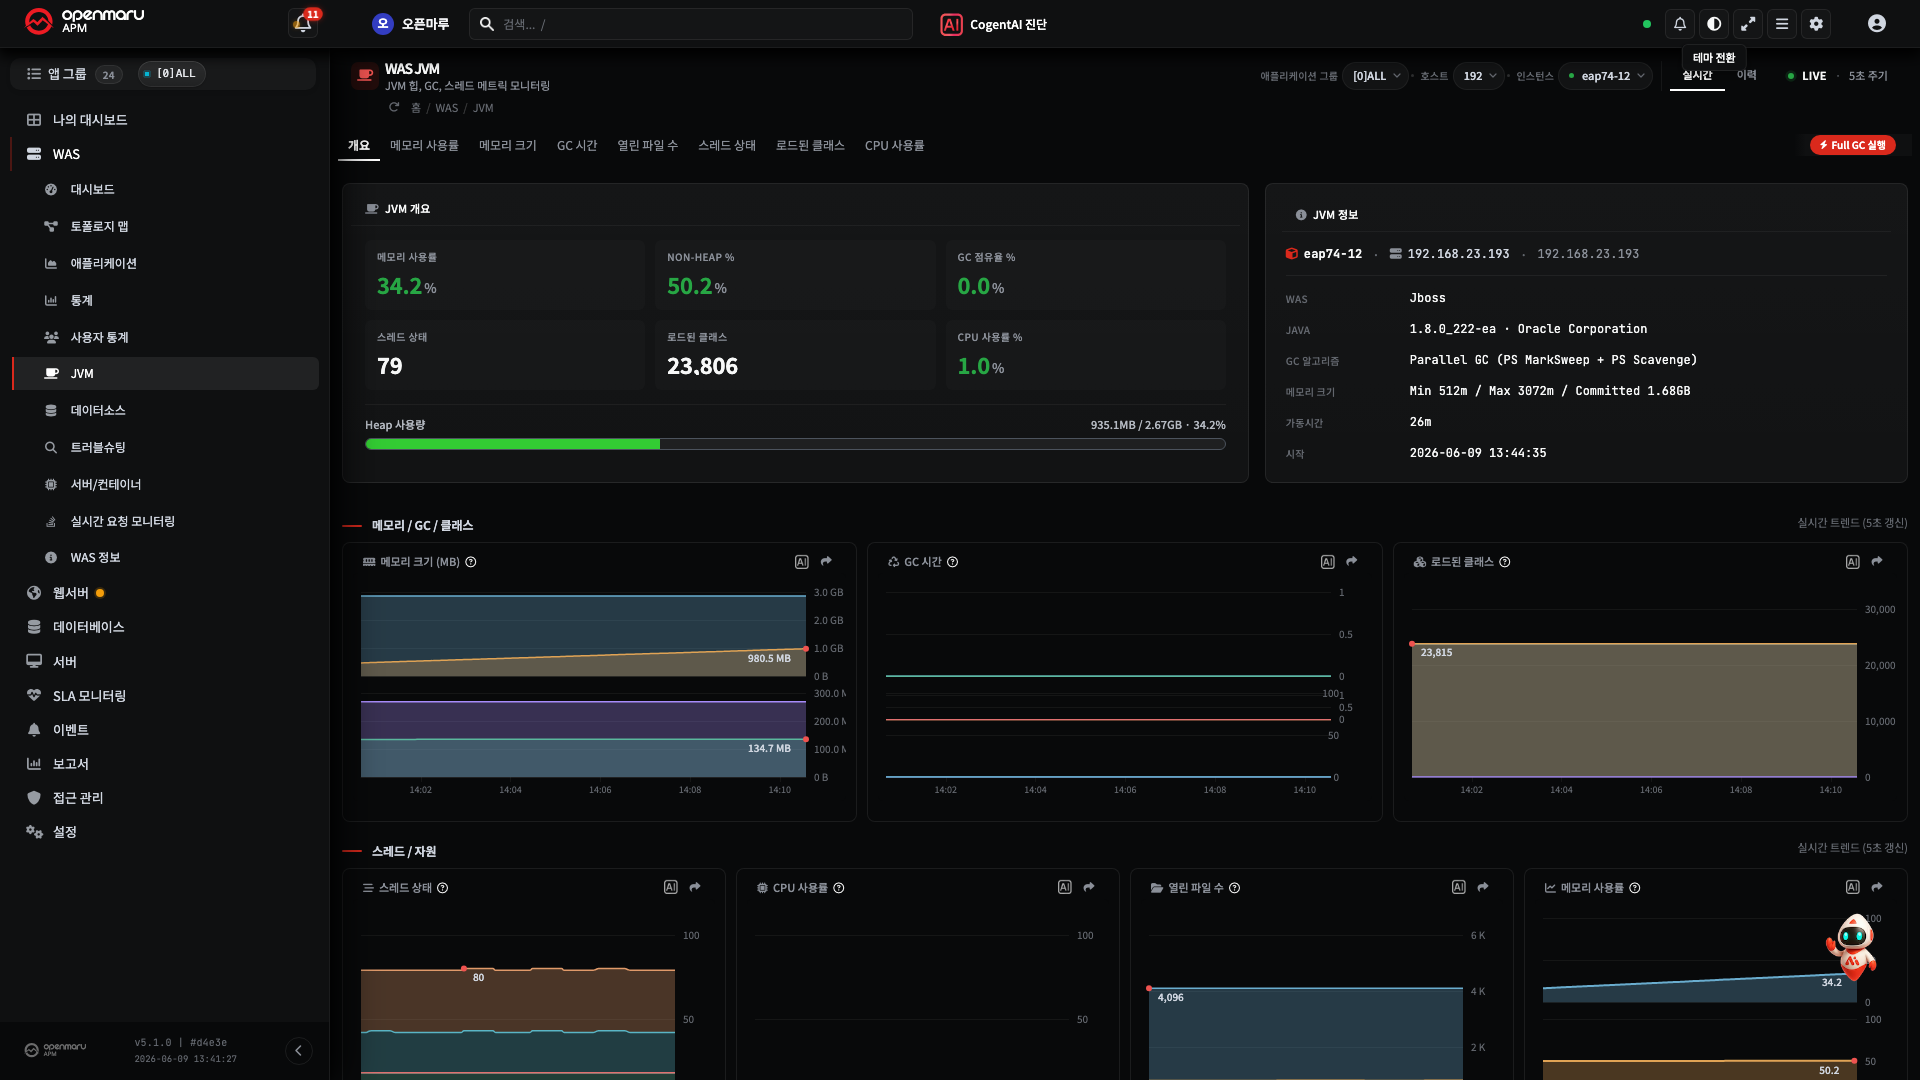
How to open it -- left menu ▸ WAS ▸ (choose the instance) ▸ JVM tab
Reading the Heap Utilization Pattern (Sawtooth vs Flat)
Look first at the shape of the JVM heap utilization (%) chart. The shape comes before the absolute value.
| Shape | Interpretation |
|---|---|
| Sawtooth (▴▾▴▾) -- rising, then dropping sharply after GC, repeatedly | Normal -- the cleaning is working |
| The floor rising step by step | Watch -- a leak is suspected. Objects GC cannot reclaim are accumulating |
| Flat above 80% (barely coming down) | Danger -- a leak is likely in progress. An OutOfMemoryError is close |
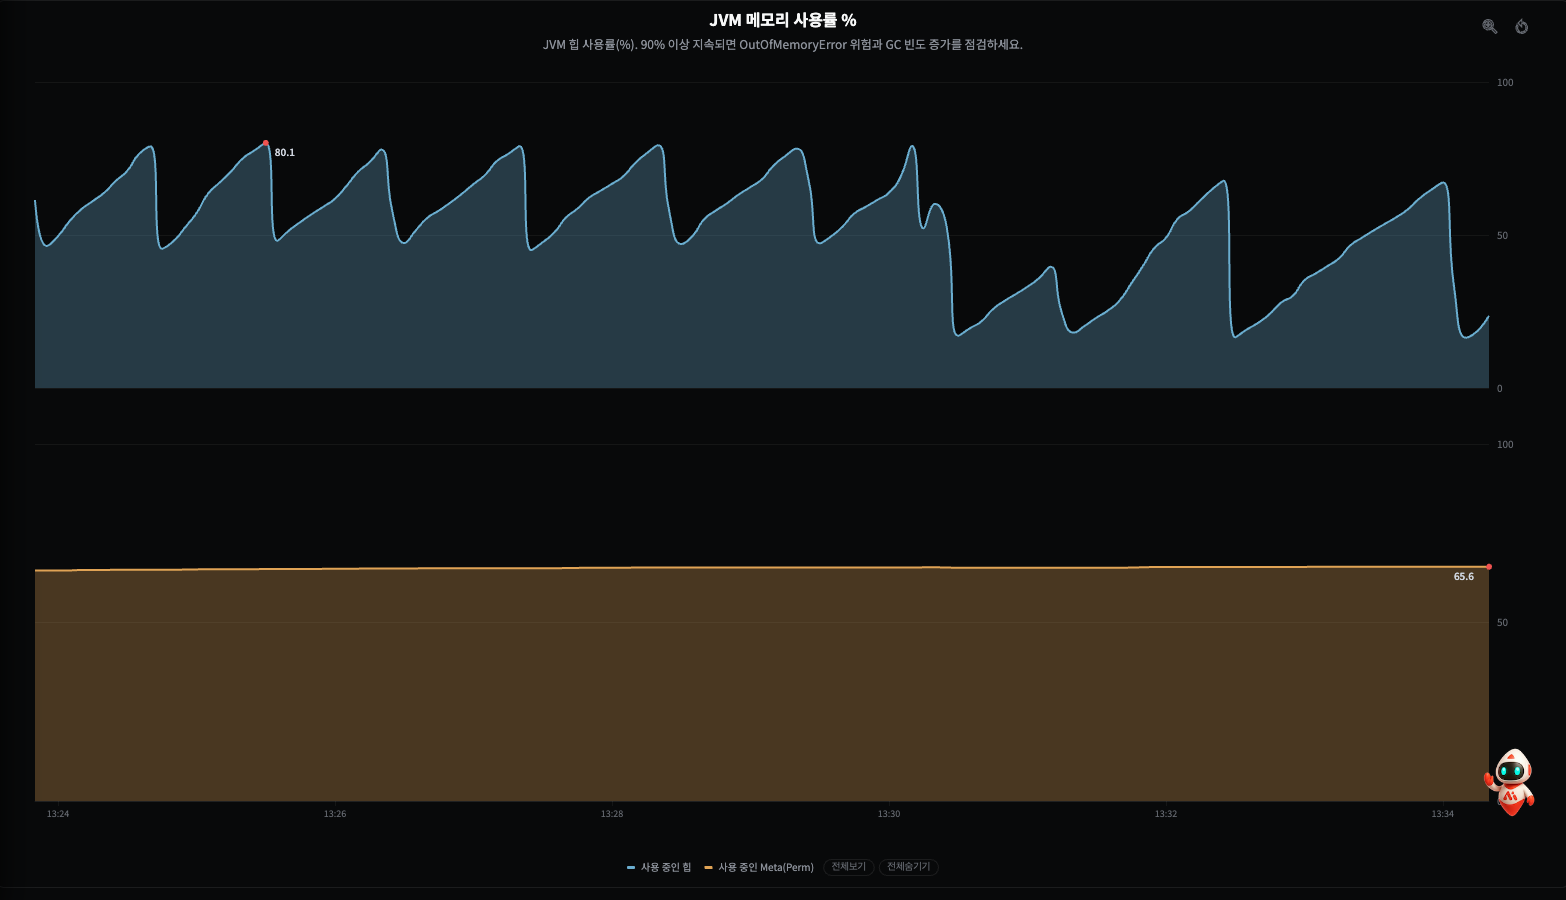
Note A short interval makes it hard to judge. Open the last day to week with H2. Changing the Period and check "is the floor (the lowest point just after GC) rising". A floor that keeps rising is a leak.
Then, on the JVM memory size chart, see whether used is approaching max. When the used line sticks to the max line, there is no headroom left.
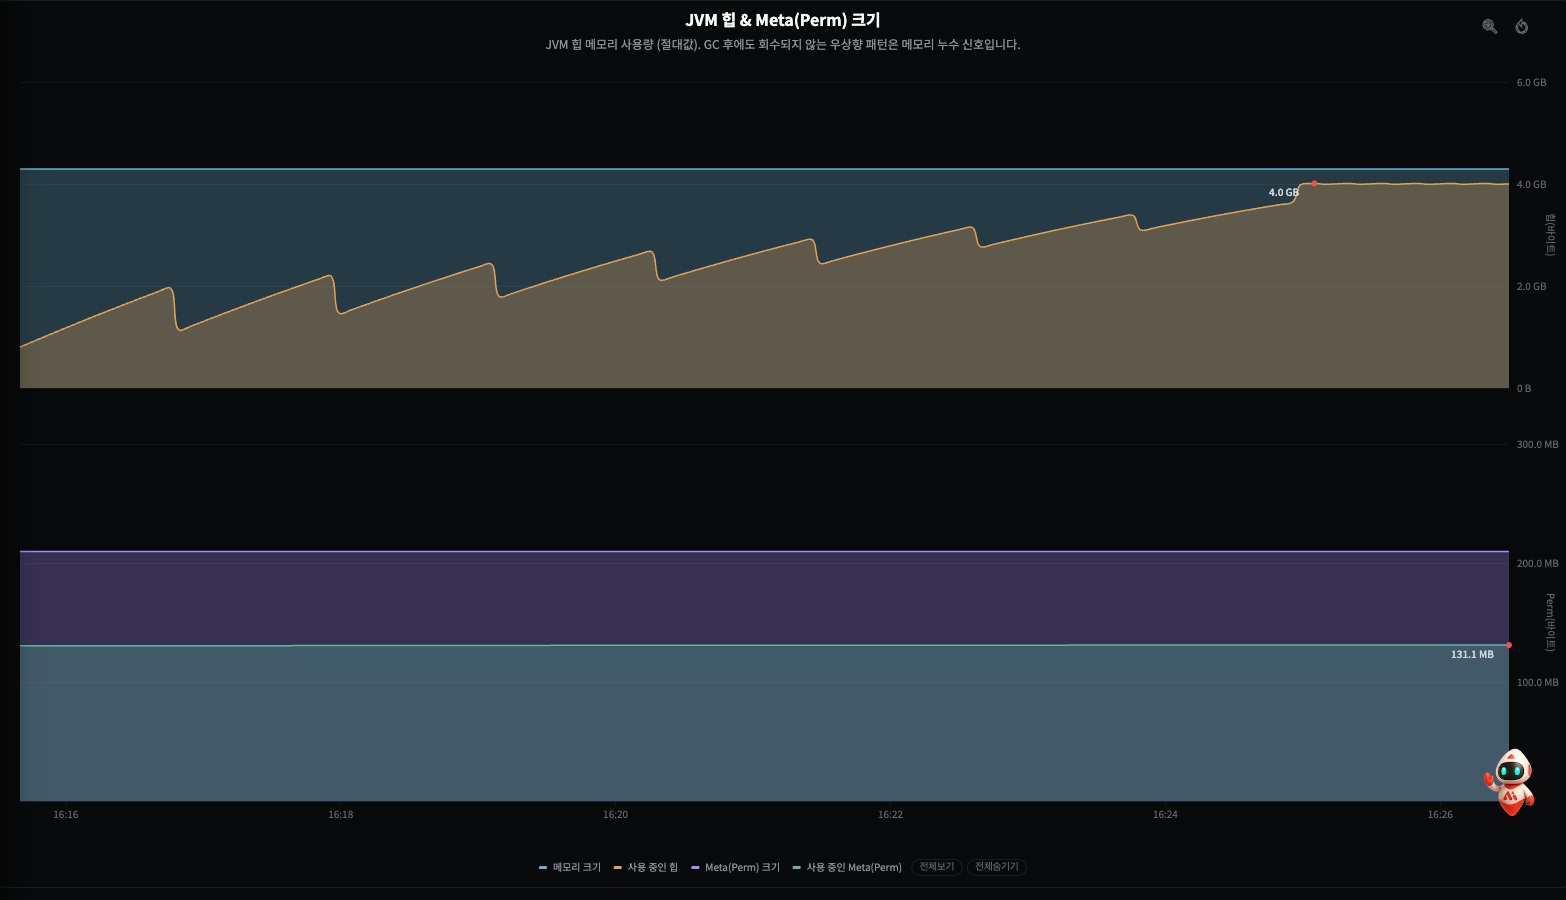
The screen above is the shape of a leak in progress. Compare it with the normal chart above -- it
is still a sawtooth, but the lowest point (the floor) just after GC is higher each time, the
amount GC reclaims (the drop) shrinks, and finally the heap in use goes flat, stuck to the memory
size (max) line. That state is just before OutOfMemoryError.
Checking the GC Time and Count
As a leak progresses, the JVM runs GC more often and for longer to squeeze memory out. Look at two things on the GC time chart.
- The GC count becoming more frequent than usual -- there is not enough space to reclaim, so it cleans repeatedly
- Individual GC durations getting longer (500 ms or more, frequently) -- the application stops while it cleans (stop-the-world) and users feel the delay or stall
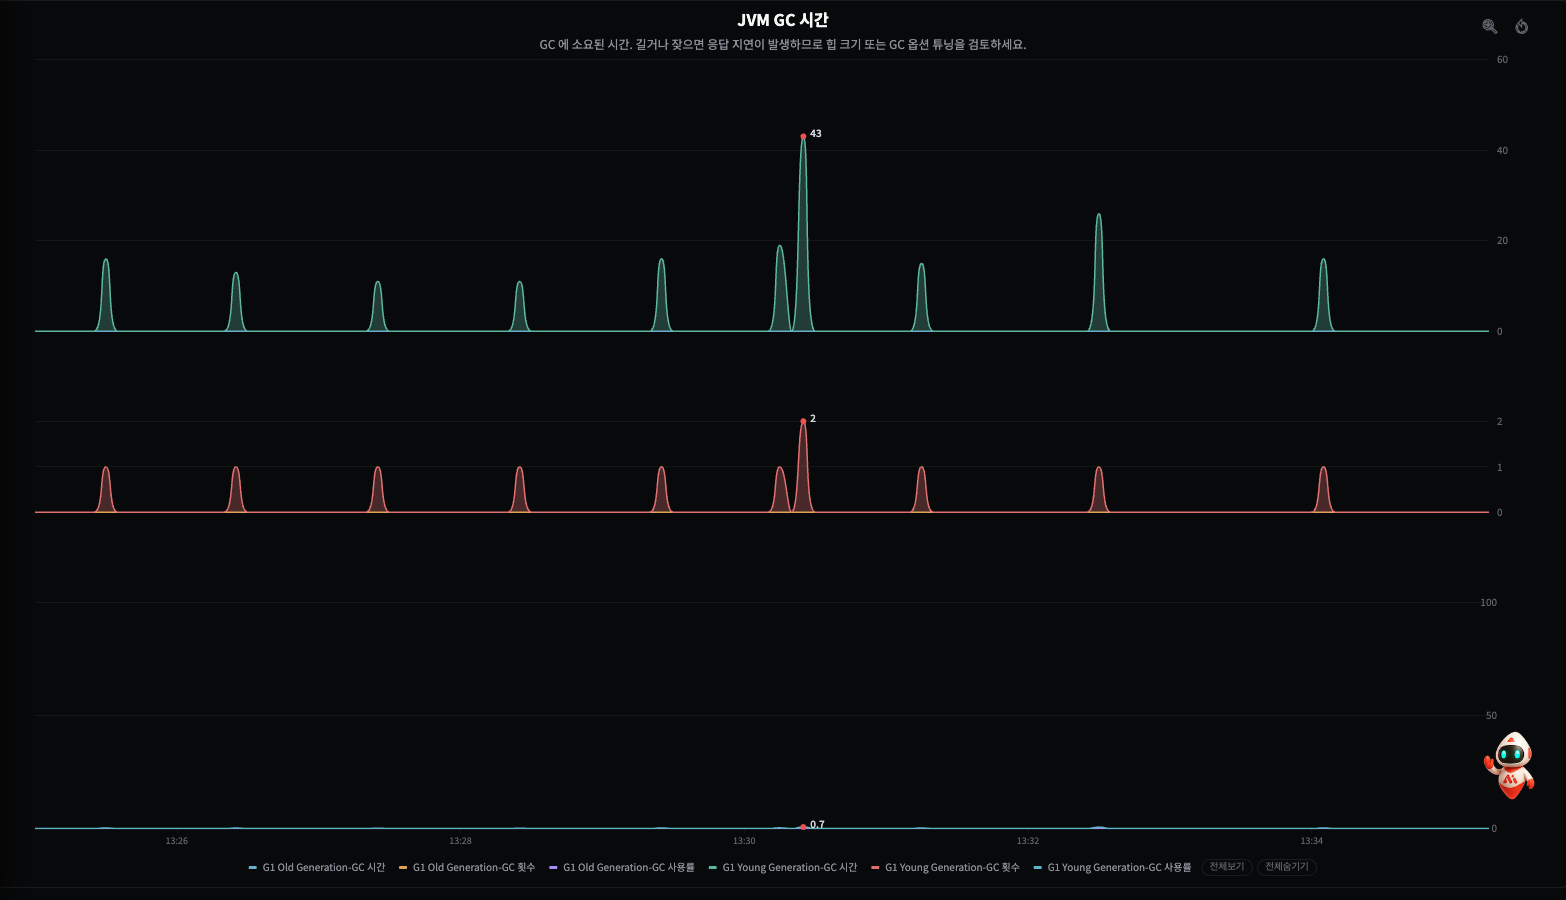
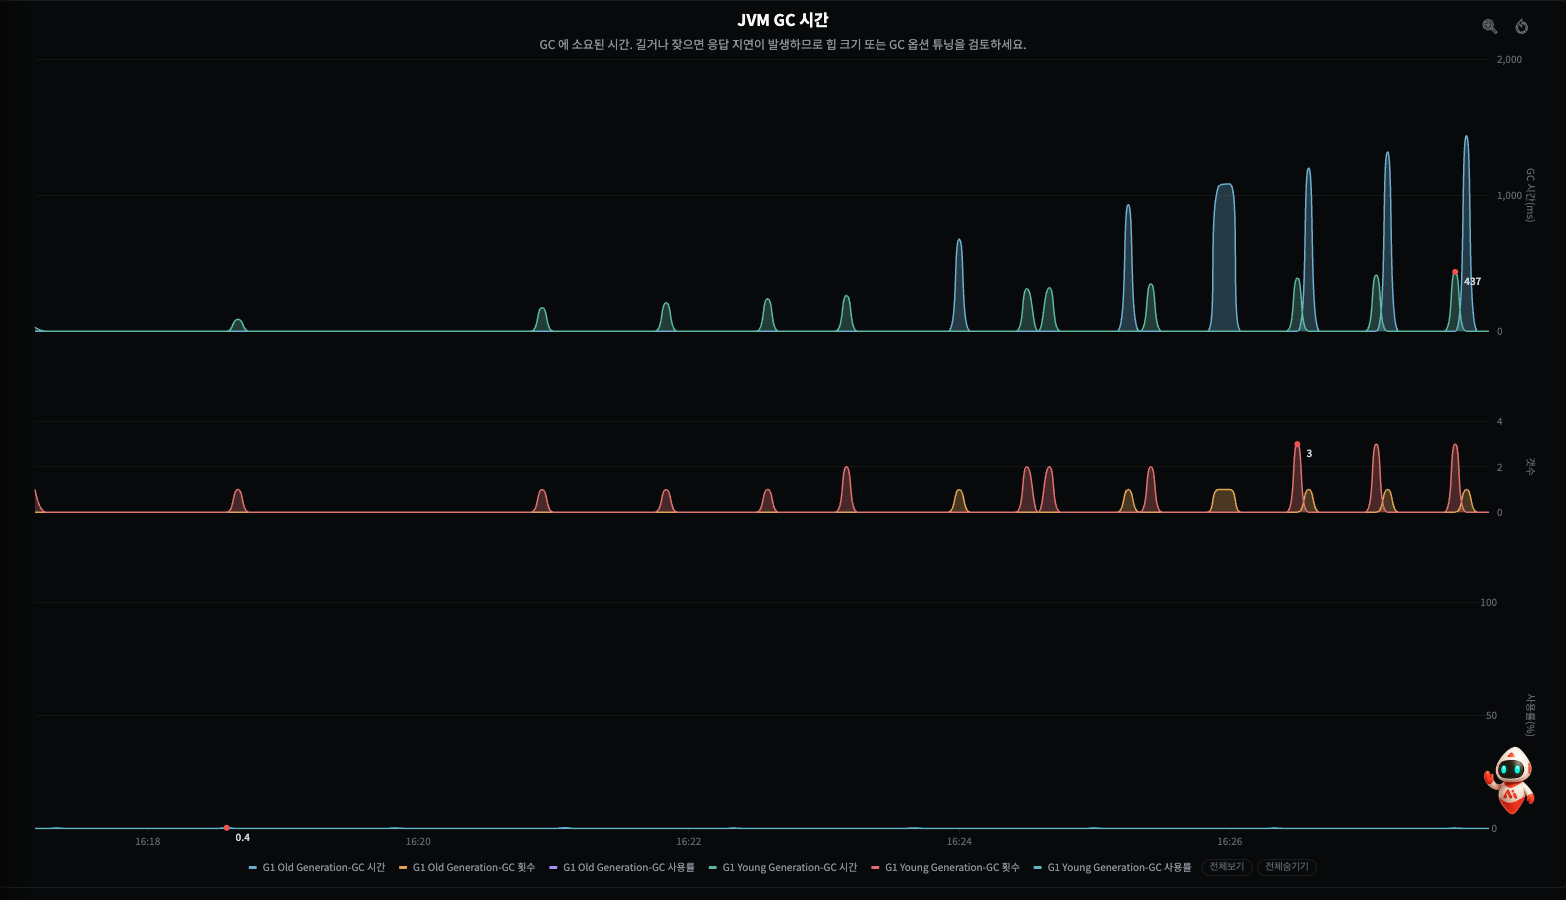
Compare the two screens. Normal (above) has GC running at a steady interval and a similar size. A leak (below) shows, as time passes, ① the young GC (green) interval narrowing, ② the durations lengthening, and ③ old (full) GC (blue) appearing later on, passing 1 second -- the shape of a JVM cleaning ever more desperately as the space to reclaim dries up.
Caution If "there is still heap headroom but the response alone is slow", it may not be a leak but a GC tuning or excessive object creation problem. Check the heap size and GC algorithm settings together in that case (R2.1 — GC Time).
Separating a Leak Out with the Full GC Button
When the heap keeps filling and you cannot tell whether it is really a leak or simply has not been cleaned yet, making it clean once yourself is the quickest way. The Run Full GC button at the top right of the JVM tab forces one full GC on that instance.
- With the memory size (or memory utilization) chart open, press the Run Full GC button at the top right.
- Watch how the heap in use line moves right after the button.
| What happens right after the full GC | Interpretation |
|---|---|
| The heap drops sharply and settles low | Probably not a leak -- what had accumulated were reclaimable temporary objects. The cleaning was just late |
| The heap barely comes down, or the point it drops to is still high | Probably a leak -- that many objects cannot be emptied even by GC |
Key point That is the very definition of a leak -- "it is not reclaimed even by a full GC." To be surer, press Full GC once more a moment later. If the floor it drops to keeps rising with each press, a leak is in progress.
Caution A full GC stops the application briefly at that moment (stop-the-world). Do it at a quiet time of day and, where you can, press it on one instance only to check. Once a leak is confirmed, the next section looks at what is accumulating.
Requesting a Heap Histogram or Heap Dump
Once the charts have narrowed it to "this looks like a leak", look at what is accumulating. Use the analysis tools on the JVM tab.
- Run Heap Object Analyze. It collects that instance's JVM memory histogram and lists which class's instances take the most memory.
- Collecting twice with a gap and comparing helps -- when the instance count and memory held by the same class keep rising, that class is the leak candidate.
- Where needed, also take a Thread Dump Analyze to see whether a particular task keeps holding on to objects.
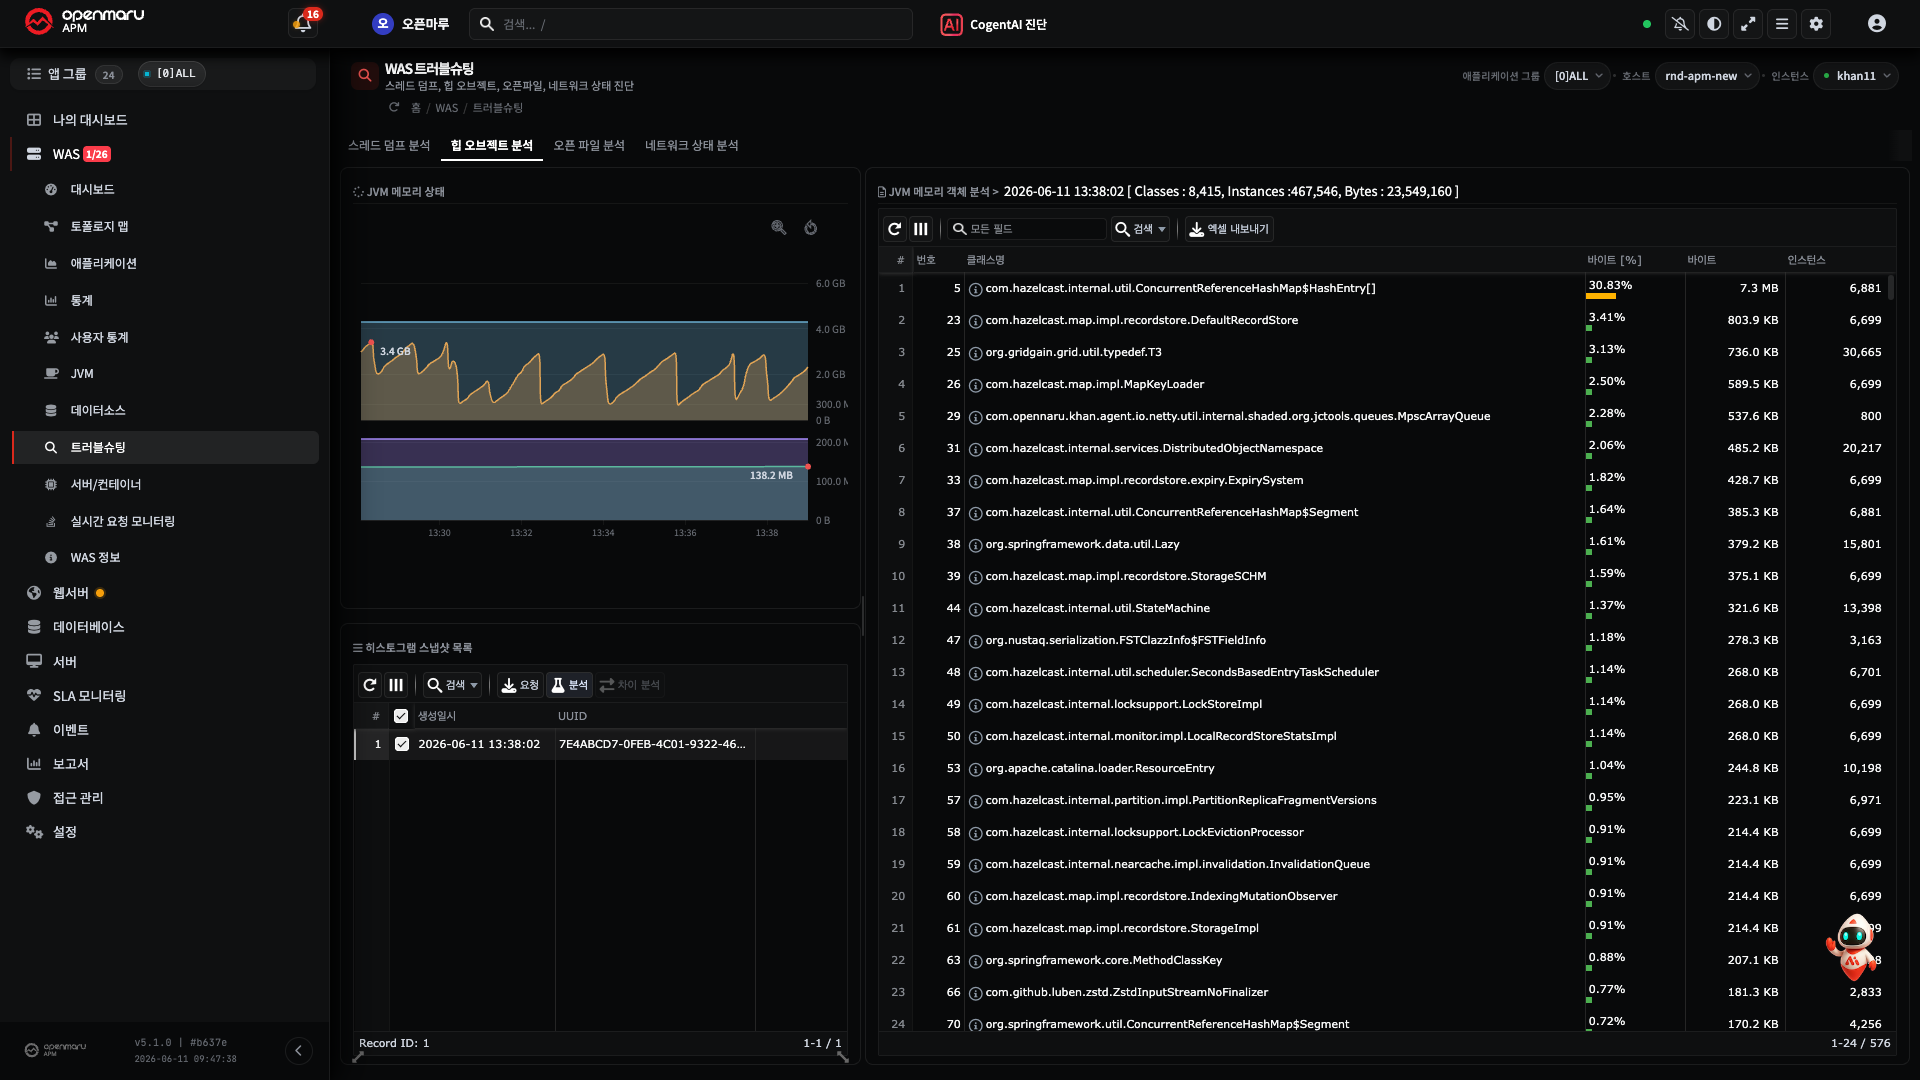
As in the screen above, collect a histogram with Request from the snapshot list on the left,
then choose a collected snapshot and press Analyse to list, on the right, the memory held per
class (bytes and %) and the instance count, largest first. Choosing two snapshots and pressing
Diff analysis compares only the increase, in the Bytes Diff and Instances Diff columns.
Note Histograms and dumps can be collected immediately on a user request, and are also collected automatically when an event such as an OOM or a deadlock occurs. The automatically collected ones can be seen by opening that event in the event list (R3. Event Reference).
Caution Collecting a heap dump can stop the JVM at that moment and is heavy. Request it at a quiet time of day and, where you can, on one instance only.
What to Do
| What was confirmed | First action |
|---|---|
| A leak candidate class is visible | Check that code for a missing cache, collection, or listener deregistration (pass it to the development team) |
| The service is at immediate risk (heap 90%+, frequent full GC) | Spread the traffic and restart the instances in turn to stabilize first |
| Used often touches max (but not a leak) | Raise the maximum heap (-Xmx) or optimize the memory use |
An OutOfMemoryError has already happened | Start from the heap object analysis saved automatically with the event |
A restart only eases the symptom; it does not resolve the cause. Record the leak candidate too, or it will recur.
When It Does Not Work
| Symptom | What to check |
|---|---|
| The JVM tab has no heap data | Whether the instance is connected (the agent status) -- H20. Checking Agents |
| The heap object analysis button is missing or will not press | Check that instance is alive and supports analysis |
| The pattern is a sawtooth but it is still slow | It may not be a leak -- move to H6. Finding the Cause of a Slow Transaction |
Related Documents
- E3.2 JVM Health -- the heap, GC, and thread concepts
- R2.1 WAS Charts — JVM -- the meaning and thresholds per chart
- H6. Finding the Cause of a Slow Transaction -- when it is not a leak
- H14. Getting AI Analysis of Charts and Events -- asking the AI to diagnose the heap chart directly