H5. Diagnosing with T-Map Patterns — the 16 Shapes
Diátaxis: How-to · Audience: operators / administrators ← Back to contents
When a report comes in that "the service is behaving oddly", start with one T-Map rather than opening dozens of charts in turn. The T-Map (the transaction heatmap) draws every transaction in a period on a time (X) × response time (Y) plane, so each kind of failure shows its own visual pattern (a vertical line, a horizontal line, a cluster, a gap, and so on). This document covers recognising those 16 patterns by shape, and what to check and do for each.
Once a pattern has narrowed the interval, carry on to H6. Finding the Cause of a Slow Transaction to dig into the cause (SQL, outbound calls) of an individual transaction. For the general use of the AI diagnosis button, see H14. Getting AI Analysis of Charts and Events.
How to open it -- the T-Map widget on left menu ▸ WAS ▸ Dashboard, or left menu ▸ WAS ▸ Application ▸ the Transaction Map (T-Map) tab (real-time · daily · history)
How to Read a T-Map
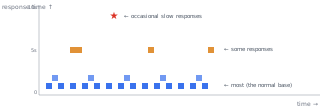
- The X axis is time, the Y axis response time (seconds). Each cell is the number of transactions that fall in that time × response time bucket.
- The cell colour is the response time (blue when fast, orange to red when slow), and the cell border is an HTTP error (4xx red, 5xx deep red).
- The measure of normal operation is the "normal base" -- the state where 95% or more of all transactions gather in a dense band in the 0 to 1 second range. While the normal base holds, some dots up top have limited user impact; the real emergency is when the normal base breaks.
- Dragging across an area of cells with the mouse opens the transaction list for that interval -- from there you can go all the way into an individual trace's SQL and stack trace (H6).
Terms used often:
| Term | Meaning |
|---|---|
| Column bucket | The time (X) axis cut into regular intervals (4 seconds in real time, proportional to the range in history) -- patterns are judged per column bucket |
| Row bucket | The response time (Y) axis cut into regular intervals (200 ms in real time, 300 ms in history) |
| Cell | The intersection of a column and a row bucket -- the number of transactions that answered at that position |
| Normal base | The dense normal band in the 0 to 1 second range -- the reference line for judging patterns |
| P95 | The boundary of the top 5% of response times within one column bucket -- a measure unshaken by outliers |
Opening the Transaction List Straight from a URL
Instead of dragging, you can put the conditions in the address (URL) and open the transaction list directly. Use it to hand a situation to a colleague, or to point at the problem window from an alert or a report.
Append the conditions to the end of the address (after #) and the list pops up right where
you are, on any screen (the page does not navigate away).
| What it opens by | Form |
|---|---|
| A single transaction (when you know the TID) | #/...?tid=<TID> |
| A group and a period | #/...?app=<group>&minx=<start>&maxx=<end> |
| An instance and a period | #/...?hosts=<IP>&instances=<name>&minx=<start>&maxx=<end> |
minxandmaxxare timestamps in milliseconds. They are recognised only together with a group or instance condition.- You can narrow further by response-time range (
miny/maxy), URL, errors only (err), client IP, and more.
Note Whoever receives the link still needs permission to see that target for the list to open (→ H18. Managing Group Permissions).
Which Pattern to Look at First — the Diagnostic Priority
When several patterns are visible at once, check them in this order.
| Rank | Pattern | Meaning | Where to check first |
|---|---|---|---|
| 1 | Empty Gap | The most serious -- the service itself cannot answer | The WAS process / the agent / the LB |
| 2a | 5xx Cluster (fast response) | Users get a 500 immediately (≤ 2 s) | Deployment history / circuit breaker / WAF |
| 2b | 5xx Cluster (slow response) | A 500 after a timeout (≥ 4 s) | The backend / the connection pool / the external API |
| 2c | 5xx Cluster (mixed) | The response times are mixed | Review both |
| 3 | Cascading Failure | A failure in progress plus users starting to leave | Downstream plus the throughput trend |
| 4 | Vertical Spike | Possibly a JVM issue | The JVM heap / GC / threads |
| 5 | High Latency Band | An external dependency delay | The slow URLs / the external API |
| 6 | 4xx Cluster | A client or API specification issue | Deployment history / WAF / client IP |
| 7 | Cumulative Degradation | An accumulating problem such as a memory leak | The JVM heap / the DB Active trend |
Key point Even for the same "5xx cluster", where to check is opposite depending on the response time distribution. If the 5xx falls fast (≤ 2 s), look at the blocking and deployment side (not the backend); if it falls slowly (≥ 4 s), start from the timeout and pool exhaustion side (not the deployment). In an environment where 5xx is normally rare, a sudden burst of fast 5xx almost always makes the deployment just before the first suspect.
The Status Circle and AI Diagnosis
The small circle to the left of the T-Map's AI button (the status circle) tells you the severity of the pattern detected.
| Colour | Meaning | Behaviour |
|---|---|---|
| Green | Normal -- no pattern | Static |
| Yellow | Info (mild) -- worth watching | Static |
| Orange | Warning -- look deeper | Blinking |
| Red | Critical -- act now | Blinking fast |
Hovering over the circle shows the list of patterns detected, and when the circle blinks, click the AI button for a detailed diagnosis. The AI answer comes in four parts: ① a one-line summary ② the patterns detected (and where) ③ possible causes (in order of likelihood) ④ the menus recommended for checking.
Where AI diagnosis is available -- the T-Map widget on WAS ▸ Dashboard, and the mini T-Map on the Overview tab and the Transaction Map (T-Map) tab (real-time · daily · history) of WAS ▸ Application.
Note History mode supports AI diagnosis only within a 2-day period (beyond that the button is hidden). Warning and Info patterns are also damped so they blink only when detected 2 or 3 times within 30 seconds (to prevent alert fatigue), so they do not react to momentary noise -- Critical blinks on the first detection, and once the pattern clears it returns to green on the next refresh (10 seconds).
Pattern Examples on Real Screens
Before the pattern list proper, here are four screens captured on a real console where the patterns were reproduced with a test load. Hovering over the status circle brings up the pattern detection popup shown below, summarising the pattern name, the suspected cause, and the severity -- getting a feel for reading the shape and the popup together makes the list of 16 that follows much quicker to read.
Vertical Spike (pattern 1) — Warning (orange)
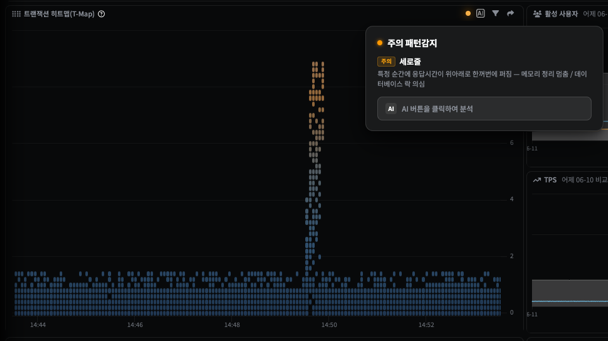
At one column bucket at a particular moment, the response times spread up and down the whole range at once. The popup points out the Vertical Spike along with the high-latency area and the top horizontal band that came with it -- since the whole instance stopped together at that "moment", suspect JVM GC stop-the-world or lock contention first.
5xx Cluster (pattern 3a — fast response) — Critical (red)
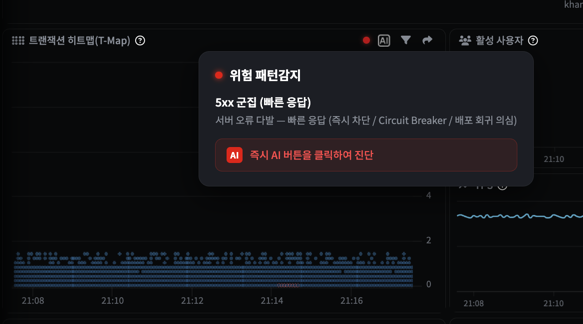
A heap of cells with a 5xx border appeared inside the normal base, and the responses are fast (≤ 2 s). The status circle turns red (critical) and the popup recommends immediate AI diagnosis -- for a fast 5xx, look at the circuit breaker, the WAF, and the deployment just before, not the backend. The slow-response variant (3b) and the mixed variant (3c) are checked in different places, so see the 3a · 3b · 3c distinction in the gallery below.
Sinusoidal (pattern 9) — Warning (orange)
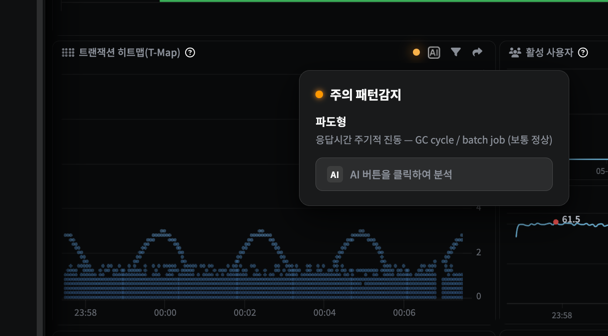
The top of the response time draws a wave rising and falling at a regular period. As the popup (the product label "Sinusoidal") says, the cause is often a periodic internal task such as a GC cycle or a batch job, so it usually falls in the normal category -- look deeper only when the period keeps shortening or the crests keep rising.
Gradual P95 Rise (pattern 8) — Info (yellow) · the same "upward" family as Cumulative Degradation (11)
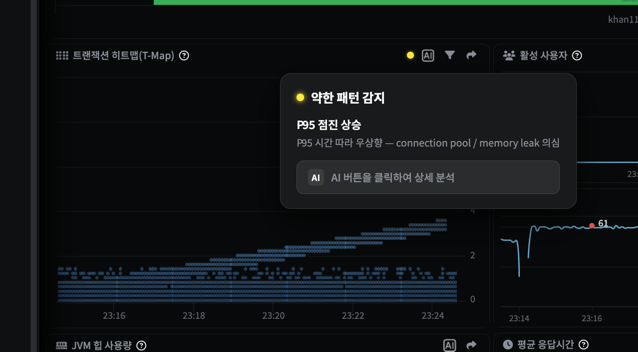
As time passes the upper boundary (P95) climbs like a staircase. It is only Info (yellow) right now, but if the shape holds it is the early signal of an accumulating resource problem such as connection pool exhaustion or a memory leak -- before it progresses to the same upward family of Cumulative Degradation (11) and Stepwise Degradation (13), check the heap and GC trend with H7. Checking for a Memory Leak.
The 16 Patterns at a Glance
The Pattern Gallery — Shape and Main Symptom
| # | Pattern shape | Title · main symptom (one line) |
|---|---|---|
| 1 | 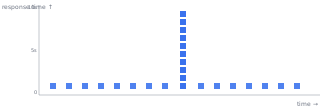 | Vertical Spike -- Response time spike across all buckets — GC stop-the-world / lock contention |
| 2a | 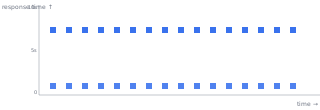 | Horizontal Band -- Sustained response time at specific level — consistent slow query / API delay |
| 2b | 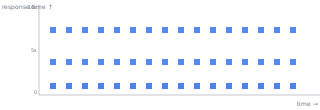 | Multi Band -- Multiple response time clusters persisting simultaneously — multiple workloads / async jobs / multi-endpoint |
| 3a | 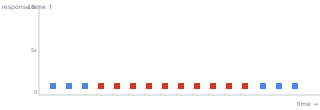 | 5xx Cluster (Fast Fail) -- Server errors with fast response — immediate block / Circuit Breaker / deploy regression |
| 3b | 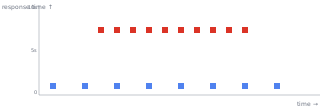 | 5xx Cluster (Slow Fail) -- Server errors with slow response — timeout cascade / connection pool exhaustion |
| 3c | 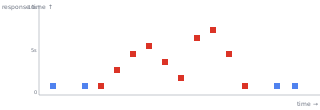 | 5xx Cluster (Mixed) -- Server error surge — mixed response time (check both sides) |
| 4 | 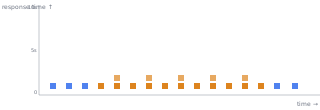 | 4xx Cluster -- Client error surge — API spec change / auth expiry / abuse |
| 5 | 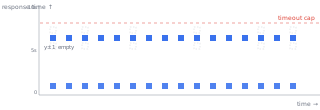 | Plateau (timeout) -- Response cluster near timeout threshold |
| 6 | 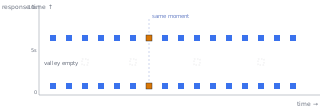 | Bimodal Distribution -- Two peaks in response distribution — cache hit/miss or path branching |
| 7 | 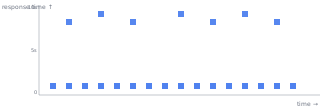 | High Latency Band -- Sparse high-latency cells — some slow queries / external API |
| 8 | 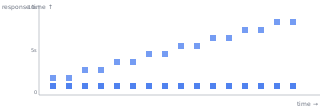 | Gradual P95 Rise -- P95 rising over time — connection pool / memory leak |
| 9 | 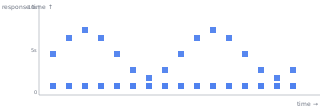 | Sinusoidal -- Cyclical response time — GC cycle / batch job (usually normal) |
| 10 | 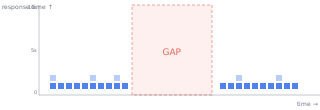 | Empty Gap (Traffic Loss) -- Traffic gap — service hang / agent disconnect / outage |
| 11 | 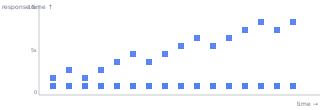 | Cumulative Degradation -- Response time ceiling rising — memory leak / connection accumulation |
| 12 | 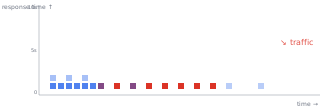 | Cascading Failure -- 5xx + traffic drop simultaneously — downstream outage + user dropoff |
| 13 | 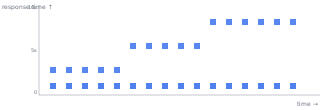 | Stepwise Degradation -- Response time stepping up — resource (pool/FD/GC) gradual exhaustion |
The number (#) is the pattern number, separate from the rank in the "Which Pattern to Look at First" table above. For the checks and actions per pattern see the detail sections by severity below, and for the order of danger see the diagnostic priority table above.
Critical — Act Now
Empty Gap (Traffic Loss)
The T-Map cells are completely empty for a period (usually a minute or more) -- either no requests are arriving or the WAS cannot produce a response. It is the most serious, first-rank signal.
- Cause -- the WAS process hanging (OOM · a full GC stall · a deadlock) / the agent disconnected (real traffic may still be alive -- a false alarm) / the LB or proxy excluding it on a failed health check / genuinely zero traffic (a quiet time of day · a DNS failure)
- What to check and do -- ① confirm the WAS process is alive (
ps/jps) -- if it is dead, restart at once and preserve a heap dump → ② the agent connection state (H20. Checking Agent Status) -- if only the agent dropped and the LB and logs show signs of traffic, it is a false alarm, so redeploy the agent → ③ check the LB health check policy → ④ check the event list for a burst of 5xx just before -- if there was one, it may be the "failure → users leaving → down" sequence (the end of a cascading failure), so analyse the traces and thread dumps from that moment.
The distinction Unlike a cascading failure, the traffic itself disappears with no 5xx. A plain blank points at a WAS hang or an agent disconnect.
5xx Cluster — Fast Fail
5xx gathers in one time band, but the responses are fast (2 seconds or less on average). That is the signature of refusing immediately with almost no processing.
- Cause -- a regression right after a deployment (the new code rejects immediately) / the circuit breaker open (a deliberate block) / a WAF or rate limit firing / a burst of authentication or session expiries
- What to check and do -- ① the recent deployment history (within 30 minutes makes a regression a strong suspect → consider a rollback) → ② the circuit breaker state -- confirm whether the block is deliberate, then get the backend healthy and close it → ③ the WAF and rate limit logs -- relax the rule if it is blocking normal traffic → ④ the 401/403 share in the authentication log and whether it lines up with the token expiry time.
The distinction The diagnosis is the opposite of a slow-response 5xx -- in this pattern you start from the blocking and the deployment, not the backend.
5xx Cluster — Slow Fail
5xx gathers in one time band, but the responses are slow (4 seconds or more on average). That is the signature of failing after waiting out a timeout on the backend or an external dependency.
- Cause -- a 500 after an external API or DB timeout / a timeout after connection pool exhaustion / a fallback 500 after every retry failed / thread pool exhaustion
- What to check and do -- ① Active Sessions and Lock on the DBMS dashboard -- check for 100% pool utilisation and lock contention → ② the external dependency response time chart → ③ the connection pool utilisation (H8. Diagnosing Database Connection Pool Exhaustion) → ④ the retry settings (a storm without backoff) → ⑤ the thread states on the WAS ▸ JVM tab -- many BLOCKED means thread pool exhaustion. For the action, getting the downstream healthy comes first, and a circuit breaker fails fast to break the storm.
5xx Cluster — Mixed
The response times of the 5xx are mixed between the fast and the slow side. Either both variants are in progress at once or it is a transitional state moving to one side, so a single diagnosis is hard.
- What to check and do -- carry out both the fast-response variant's checks (deployment, circuit breaker, WAF) and the slow-response variant's checks (DB, pool, downstream). AI diagnosis tells you which signal is stronger. A 5xx share of 2% or more is dangerous, and 5% or more is the act-immediately stage.
Note When both a fast group and a slow group are present at the same time, both variants are detected simultaneously and both are shown in the tooltip -- no separate setting is needed.
Cascading Failure
A pattern where 5xx bursts while the traffic falls at the same time. It is the combined signal of the start of an outage -- users who got no response are starting to leave.
- How it progresses -- a downstream (DB · external API · cache) timeout → a burst of 5xx → users retrying and leaving → traffic falling. If the circuit breaker does not open in time, a retry storm accelerates it.
- What to check and do -- ① identify which downstream died (Active Sessions and Slow Query on the DBMS dashboard, the external dependency response time) → ② confirm the departure is progressing from the throughput (TPS) trend on the WAS dashboard → ③ open the circuit breaker to fail fast (breaking the storm) → ④ drill down into the 5xx traces to find the failing call site. Putting up a service status notice for users is part of the action too.
The distinction Unlike an empty gap, it comes with 5xx -- the signal of a failure "in progress".
Warning — Look Deeper
Note The three 5xx cluster variants show as warning at 5 or more, and critical at 10 or more. At the warning stage, carry out the same checks from the Critical section above but mainly as observation and trend confirmation -- identifying the variant in advance makes the order of checks clear if it grows to critical.
Vertical Spike
A pattern where, at one particular moment, every response time spreads up and down at once. It means one resource stopping (stop-the-world) caught every request of that moment together.
- Cause -- a full GC stop-the-world (the most common) / DB lock contention (one long transaction holding many locks) / thread pool exhaustion / an external API hanging briefly
- What to check and do -- ① identify the exact moment of the vertical line (the reference for the checks that follow) → ② the heap on the WAS ▸ JVM tab -- Old close to 100% at that moment suspects a GC stall → ③ the GC chart -- if a full GC's occurrence and duration match the length of the vertical line, it is confirmed → ④ a thread dump -- many BLOCKED waiting on the same monitor means lock contention → ⑤ Lock on the DBMS dashboard -- whether it spiked at the same moment. Frequent full GC means growing the heap or a heap object analysis (H7. Checking for a Memory Leak); lock contention means shrinking the transaction scope.
The distinction Unlike a multi band it is momentary -- the time bands either side are normal.
4xx Cluster
4xx client errors gather in one time band. 4xx itself has little operational impact, but a sudden burst is the signal of a change or of abnormal access.
- Cause -- an API specification change right after a deployment (a burst of 400) / a coincidence with the authentication or session expiry time (a burst of 401) / abuse such as scanners and bots (a burst of 403 · 404 · 429)
- What to check and do -- ① start from which status is numerous (400 the input specification / 401 authentication / 404 an endpoint change / 429 a rate limit) → ② the client IP distribution -- a concentration in a particular IP range means abuse, so tighten the WAF rule → ③ whether a recent deployment changed the API specification -- if it is a regression, roll back or tell the client team.
Horizontal Band
A band forms where the response time stays consistently at one value (5 seconds, say). It means one dependency or one query always takes that long.
- Cause -- a particular SQL always being slow (a bad execution plan · a missing index) / a synchronous external API with a fixed response time / network delay (a distant backend · keep-alive not used)
- What to check and do -- ① sort by P95 per URL in WAS ▸ Transactions -- which URL makes the band →
② Top Slow Query on the DBMS dashboard → ③ check the indexes for that query with
EXPLAIN→ ④ whether the external dependency response time matches the height of the band. If it is a query, indexes and tuning; if it is an outbound call, making it asynchronous plus caching plus a circuit breaker.
The distinction Unlike a plateau it is a plain band that need not be empty above and below, and unlike a multi band there is only one band.
Plateau (timeout)
The response times gather exactly at a particular value and stop, with nothing above or below. That value is usually just short of the timeout setting -- it means every request is waiting to the limit.
- Cause -- a response just short of the HTTP client's connect/read timeout / just short of a DB connection timeout / just short of a JDBC fetch timeout
- What to check and do -- ① whether the configured timeout value matches the height of the plateau (the application settings · the HTTP client settings) → ② whether the downstream (backend · DB · external API) really is getting slower → ③ drill down into a trace to see which call reaches the limit. Review the timeout threshold, block the accumulation with a circuit breaker, and then improve the downstream responsiveness (the root cause).
Caution Right after a plateau it can move into the actual timeout stage (a slow-response 5xx) -- treat it as a precursor signal.
Bimodal Distribution
The response times gather in two places at once (0.2 seconds and 5 seconds, say). It means two paths, a fast one and a slow one, coexist at the same moment.
- Cause -- a cache hit (fast) against a miss (slow) / a conditional branch (only some going to the DB) / the two paths of a feature flag or an A/B test
- What to check and do -- ① separate P95 per URL -- which URL belongs to the slow peak → ② check the cache hit rate -- whether a low time of day or endpoint is the cause of the slow peak → ③ whether the slow path was added by a recent deployment. A natural cache hit/miss distribution needs only observation; if the slow path is a problem, reduce it by introducing a cache or optimising the query.
The distinction It resembles a sinusoidal, but a bimodal distribution has both peaks present at the same moment, while a sinusoidal shows them in turn.
Info — Observe
High Latency Band
Dots scattered sparsely at the top of the chart -- a long tail state where only part of the traffic is very slow.
- Cause -- only some SQL being slow (data growth · stale statistics or indexes) / only some endpoints of an external API hanging / the start of resource contention
- What to check and do -- ① identify the URLs of the top dots by sorting on P95 in WAS ▸ Transactions → ② DBMS Top Slow Query → ③ the JVM CPU and memory trend -- if the dots keep multiplying it can spread into cumulative degradation. Observe if the impact is 5% or less, and drill down into those traces to find the bottleneck if it persists or grows.
The distinction Unlike a horizontal band it is sparse dots, not a consistent band.
Gradual P95 Rise
A continuous trend where the upper response times (P95) in the later part of the chart are noticeably higher (1.5×+) than in the earlier part -- the early signal of resource accumulation or a leak.
- Cause -- connections accumulating unreturned / a memory leak (heap pressure → more frequent GC) / queries degrading gradually as data grows / falling cache efficiency
- What to check and do -- ① whether the JVM heap Old area fills over time (H7) → ② a gradual rise in DB Active Sessions and connection pool utilisation (H8) → ③ if a leak is suspected, identify the accumulating objects with a heap object analysis. If the trend lasts several days it is escalated to cumulative degradation -- find the root cause before then.
Multi Band
Two or more response time bands persist at once. It means workloads of different character are mixed on one WAS, and in itself it is often not a failure.
- Cause -- a fast API and a slow API mixed on one WAS / synchronous responses, asynchronous polling, and batches each drawing their own band / differences in data volume per tenant / a normal path plus a retry fallback path
- What to check and do -- ① map which set of endpoints each band belongs to using P95 per URL → ② whether the slow band's queries are heavy → ③ whether the batch timetable matches the upper band. If it is a natural operational pattern, observation is enough; to separate the SLA, isolate the slow endpoints into their own pool or split the batches into a separate thread pool or process.
Caution If the trend is for bands to grow upward or for new bands to appear, it can spread into cumulative degradation -- watch the trend.
Sinusoidal
A pattern where the response time rises and falls at a regular period. It is usually a sign of normal operation.
- Cause -- the GC cycle (a spike on the order of minutes) / the trigger period of a regular batch job / a cache TTL expiring → a miss spike → a refresh → stability, over and over
- What to check and do -- ① measure the interval between crests to see whether it is minutes, hours, or days → ② if it matches the GC interval it is GC pressure -- grow the heap or tune the GC algorithm → ③ if it matches the batch timetable, spread the trigger times → ④ if it matches the cache TTL, stagger the expiry times. A normal GC or batch period needs observation only.
The distinction Unlike a bimodal distribution the two heights appear in turn (they do not coexist).
Cumulative Degradation
The ceiling of the response time rises smoothly over time. The cause is the same as a gradual P95 rise, but it is the stage where the signal is stronger.
- Cause -- a memory leak (the Old area filling gradually) / DB connections accumulating unreleased / queries degrading gradually as data grows / falling cache efficiency
- What to check and do -- carry out the same checks as for a gradual P95 rise but on a long trend of several days -- the JVM heap Old trend, the DB Active trend, and identifying the accumulating objects by comparing heap dumps from different times. Restarting the WAS periodically is only short-term relief; resolving the root cause (the leaking or unreleasing code) is essential.
The distinction Unlike a stepwise degradation it rises as a smooth curve.
Stepwise Degradation
The response time repeats a jump like a step → stability → another jump. It is the signature of stepwise exhaustion of a resource, growing one level slower each time the resource hits a threshold.
- Cause -- connection pool slots blocking one at a time / file descriptors accumulating (nearing the OS limit) / accumulating heap pressure raising the GC frequency step by step
- What to check and do -- ① compare the resource measures at each step (DB Active · Open Files · GC frequency) to identify which resource made the steps → ② check where that resource sits against its maximum (the pool max · the FD limit · the heap max) → ③ check for calls that increased in the traces of each step. The action is growing the resource with the greatest impact, or blocking the code that accumulates without releasing. If the steps repeat over several days it is escalated to cumulative degradation.
The Action Checklist
When a failure is suspected, proceed in this order.
- Check the colour of the T-Map status circle (respond in the order red → orange → yellow)
- Hover over the circle to see which pattern was detected
- Click the AI button -- get back the summary · patterns · possible causes · recommended menus
- Go to the "recommended checks" menus in the answer and cross-check (the JVM heap / GC / threads / DB Active and so on)
- Where needed, drag that interval to drill down to an individual transaction (H6)
- Act once the root cause is confirmed
- Confirm the status circle returns to green after the action
When It Does Not Work
| Symptom | What to check |
|---|---|
| Several patterns detected at once | Follow the order of the diagnostic priority table (critical → warning → info) -- the AI diagnosis's recommended checks are in priority order too |
| The status circle blinks too often | Warning and Info are damped to blink only on repeated detection -- if it is still frequent it may be a real trend, so confirm with AI diagnosis |
| The T-Map is entirely empty | Either the Empty Gap pattern or the agent is not connected -- H20. Checking Agent Status |
| No AI button in history mode | The period exceeds 2 days -- narrow it to within 2 days and the button appears |
| The pattern is visible but there are no user reports | Check the normal base (95%+ in 0 to 1 second) is holding -- if it is, the impact is limited and it is at the observation stage |
Related Documents
- H6. Finding the Cause of a Slow Transaction -- diagnosing individual transactions in the dragged interval (the 20 problem patterns)
- H7. Checking for a Memory Leak -- the heap and GC analysis for a vertical spike · a P95 rise · cumulative degradation
- H8. Diagnosing Database Connection Pool Exhaustion -- the pool checks for a slow 5xx · a plateau · a stepwise degradation
- H14. Getting AI Analysis of Charts and Events -- the general use of the AI diagnosis button
- H20. Checking Agent Status -- telling a false alarm from a real empty gap
- R3. Event Reference -- what 5xx and threshold events mean
- R1. Screen Map -- where every menu used for checking is