H11. Diagnosing Excessive Server Sockets
Diátaxis: How-to · Audience: operators / administrators ← Back to contents
When "new connections are refused intermittently" or "traffic is at the usual level but connections drag", suspect TCP sockets piling up in one state and drying up the ports or connection resources. This document is the order for reading the socket distribution on the TCP connection state chart under Server ▸ Network, separating out which side is the problem, and responding.
The thresholds per item on the system charts are in R2.4 System (Server) Charts — Network. For CPU and disk saturation, see H10. Responding to CPU and Disk Thresholds Being Passed.
How to open it -- the socket distribution can be seen in two places, with different scopes (see "Seeing It in Two Places" below).
- The whole host (OS) -- left menu ▸ Server ▸ (choose the host) ▸ Network tab ▸ TCP connection state
- That WAS (JVM) process alone -- left menu ▸ WAS ▸ (choose the instance) ▸ Troubleshooting ▸ Network State Analysis
Reading the TCP Connection State Distribution
The TCP connection state chart splits the sockets by state (ESTABLISHED, TIME_WAIT, CLOSE_WAIT, FIN_WAIT, and so on). Which state is abnormally numerous separates the cause.
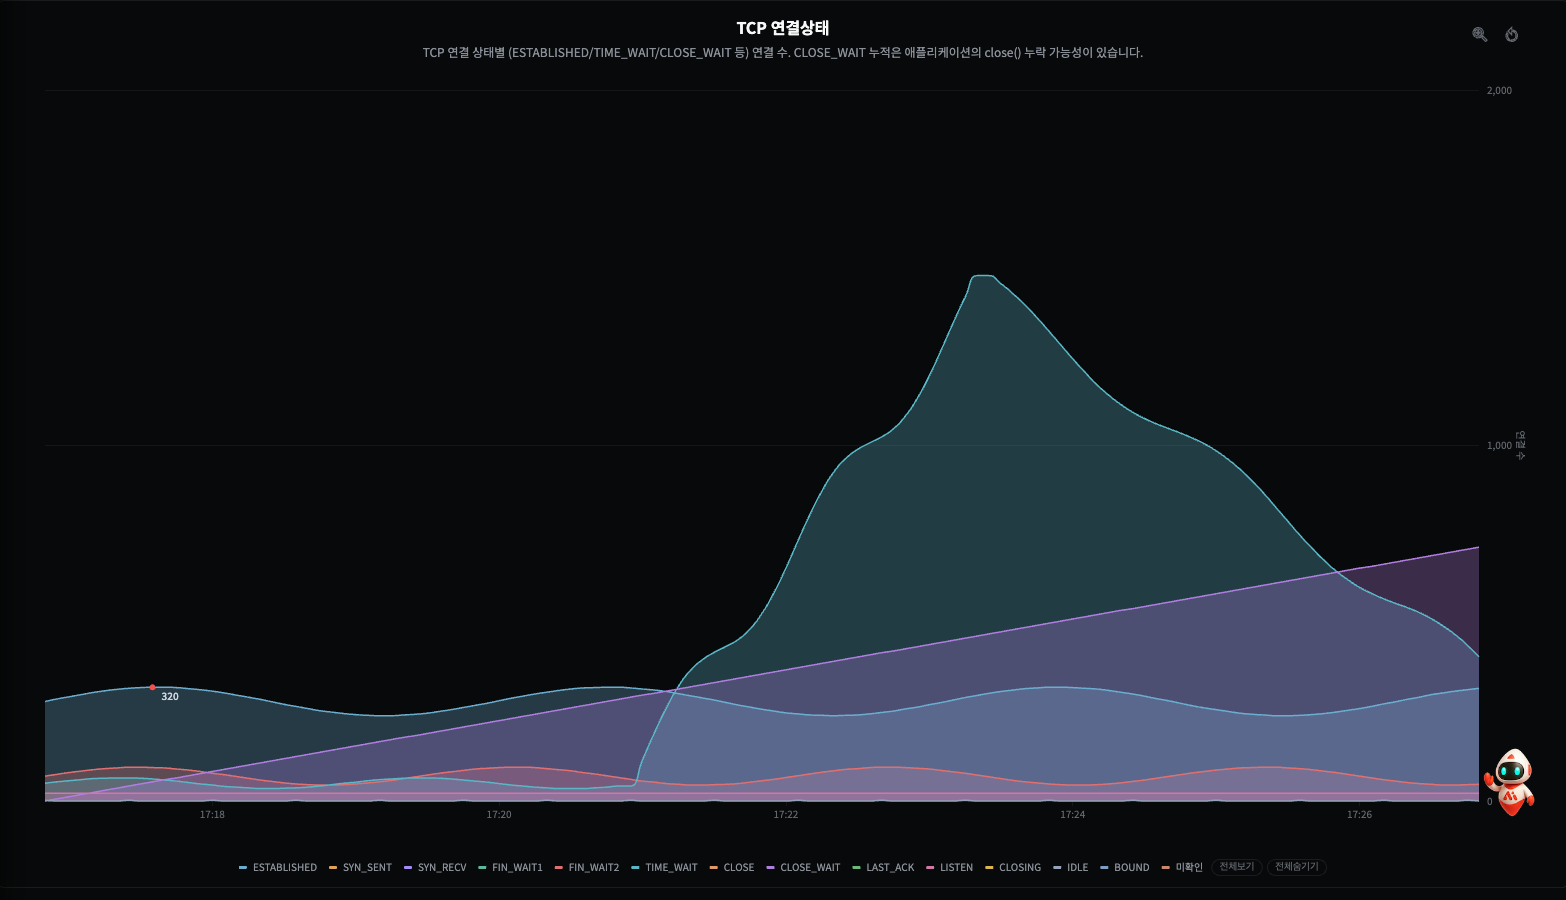
Two problems are visible together in the screen above -- TIME_WAIT (cyan) spikes like a peak during the busy interval and then drains away slowly (a burst of short connections → port exhaustion). CLOSE_WAIT (purple) climbs like a staircase and does not come down (a leak of sockets that were not closed). On the same chart, a different shape means a different cause.
| The numerous state | Meaning and what to check next |
|---|---|
| ESTABLISHED | Actually active connections. Normal when proportional to the traffic. A spike means a connection burst or excessive keep-alive |
| TIME_WAIT | The state left briefly (usually 60 seconds) on the side that closed the connection normally. Large numbers after heavy traffic risk local port exhaustion |
| CLOSE_WAIT | The state where the other side closed but my application has not called close(). Piling up without falling means a connection leak (a code defect) |
| FIN_WAIT1 / FIN_WAIT2 | The closing sequence in progress. Many staying a long time suggests the other side responding slowly, or a firewall cutting in between |
Key point TIME_WAIT and CLOSE_WAIT have opposite causes.
- Many TIME_WAIT = the pattern of making and closing many connections quickly (a burst of short connections). Not a resource leak but a structural matter of connections not being reused.
- Many CLOSE_WAIT = the pattern of holding on to a received connection without closing it. When it does not fall over time, it is almost always a missing
close()in the application code.
The Whole Host, or That JVM Process — Seeing It in Two Places
The same TCP connection state can be seen on two screens, but the scope differs.
| Screen | Scope | When to use it |
|---|---|---|
| Server ▸ Network ▸ TCP connection state | The sockets of the whole host (OS) | "Is this whole server port-exhausted?" |
| WAS ▸ Troubleshooting ▸ Network State Analysis | The sockets of one WAS instance (the JVM process, PID) | "Is this leak down to this WAS?" |
- Server network looks at the whole OS. Where a WAS, a web server, and batches run on the same host, all of their sockets are summed, so which process is at fault cannot be told.
- WAS ▸ Troubleshooting ▸ Network State Analysis takes a
netstatof only the sockets opened by that WAS's JVM process (PID) and shows them by state. Isolating that instance makes the source clear.
Key point When many TIME_WAIT or CLOSE_WAIT appear on the whole host (server network), which process is at fault can only be separated by narrowing to the JVM level (WAS ▸ Troubleshooting ▸ Network State Analysis). If the same state has piled up when only that WAS's PID sockets are isolated, the source of the leak is confirmed as that instance.
Excessive TIME_WAIT — Diagnosing Port Exhaustion
TIME_WAIT is the trace of a normal close, so its existence is normal. The problem is the number.
- How to tell -- when TIME_WAIT spikes into the tens of thousands right after heavy traffic (or a
large number of short connections being created) and new connections fail with
Cannot assign requested address(port exhaustion), it is TIME_WAIT saturation. - The cause is usually a client that makes a new short HTTP or database connection every time (batches, crawlers, integration modules).
- Confirming it -- overlay it with the connection state in R2.2 Web Server Charts and the frequency of external calls in the WAS transactions at the same time of day.
Accumulating CLOSE_WAIT and FIN_WAIT — Diagnosing a Connection Leak
When CLOSE_WAIT does not come down even after the traffic falls, it is a leak.
- How to tell -- open the trend with H2. Changing the Period and see whether CLOSE_WAIT climbs like a staircase. Once it goes up and does not come down, unclosed sockets are piling up.
- When many FIN_WAIT2 stay a long time, the other side (the backend or an external API) may not be responding to the close, or a firewall in between may have cut an idle connection so only one side is closed.
- A leak dries up JVM resources too -- one socket is one file descriptor, so check H12. Diagnosing JVM Open File Descriptor Exhaustion alongside it.
What to Do
| What was confirmed | First action |
|---|---|
| Excessive TIME_WAIT (port exhaustion) | Turn short connections into reused ones -- apply HTTP keep-alive and database/HTTP connection pools. Review the OS ephemeral port range, tcp_tw_reuse, and the like with the infrastructure team |
| A CLOSE_WAIT leak | Check the code that does not close received connections (a missing close() or try-with-resources) -- pass it to the development team. It is the root cause, so a restart is only a stopgap |
| Many FIN_WAIT2 | Check the other backend's or external API's close response, and the idle timeout of the firewall in between |
| Putting out the fire | Spread the traffic and restart the instances in turn to recover the socket resources first |
Caution Forcing TIME_WAIT down with OS parameters risks a late-arriving packet mixing into a new connection. Connection reuse (pools and keep-alive) is the proper answer, and OS tuning should be done carefully with the infrastructure team.
When It Does Not Work
| Symptom | What to check |
|---|---|
| No data on the Network tab | The host's system agent connection state -- H20. Checking Agents |
| The sockets are normal but connections are slow | Not a socket problem -- check the CPU and disk (H10) and the WAS thread pool first |
| Which process the sockets belong to is unknown | Isolate that JVM's (PID's) sockets with WAS ▸ Troubleshooting ▸ Network State Analysis (see "Seeing It in Two Places" above) |