H17. Setting SLA Targets and Getting Reports
Diátaxis: How-to · Audience: administrators -- the SLA Setting menu is visible only to accounts with administrator permission (the dashboard, status, and reports are available to every user) ← Back to contents
To see "is our service keeping the availability it promised", first decide what to keep and at what level (the service checks), then check the current state on the dashboard and the attainment over a period in the report. This document covers those three steps.
Reading E3.3 SLA and Availability first makes the concept easier to follow. The SLA in OPENMARU APM is based on service checks (confirming periodically that the service responds normally).
The SLA Monitoring menu (left menu ▸ SLA Monitoring)
| Menu | Path | Purpose |
|---|---|---|
| SLA Dashboard | left menu ▸ SLA Monitoring ▸ SLA Dashboard | The current SLA state at a glance (new) |
| SLA Status | left menu ▸ SLA Monitoring ▸ SLA Status | The service check results (the trend) |
| SLA Report | left menu ▸ SLA Monitoring ▸ SLA Report | The availability and attainment report |
| SLA Setting (administrators only) | left menu ▸ SLA Monitoring ▸ SLA Setting | Registering service checks and setting targets |
SLA Setting (Targets and Goals)
First register what to watch (the service checks) and the target level.
- Open left menu ▸ SLA Monitoring ▸ SLA Setting (visible to administrators only).
- Register the service checks to watch -- the targets whose normal operation is confirmed periodically, per service or endpoint.
- Set the target (availability and so on) -- 99.9% availability, for example.
- Save.
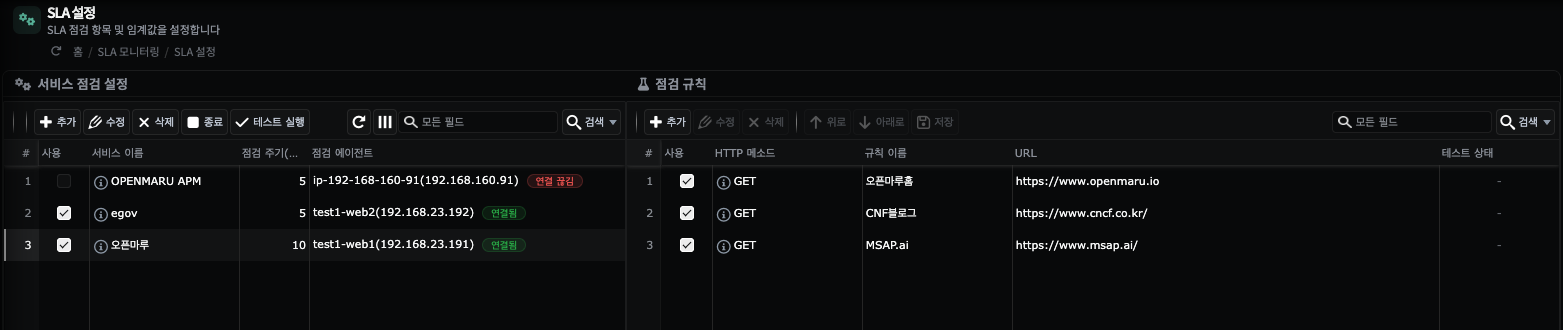
The screen has two areas, left and right. In service check settings on the left, register the services to watch (Openmaru and egov, for example) and each check's interval (seconds), checking agent, and state. Choosing a service on the left brings up, in the check rules on the right, the items that service actually calls to confirm -- the screen above has Openmaru selected, with its 3 rules shown (Openmaru home, CNF blog, MSAP.ai, all GET).
Editing a check rule -- choose a rule on the right and press Edit to open the edit window. Below is the screen for editing the 'Openmaru home' rule.
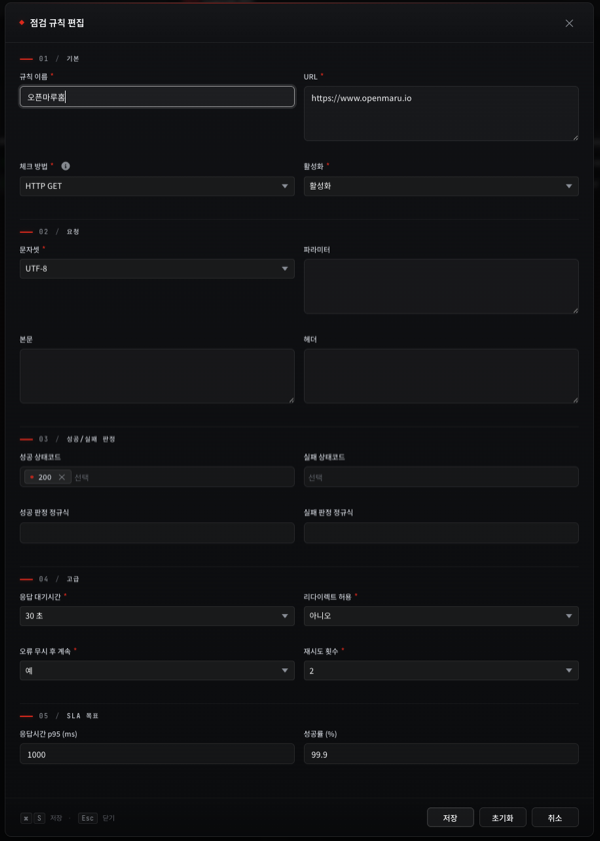
One rule is the definition of "call this URL this way, and this response means normal".
- Basic -- the rule name, the URL (
https://www.openmaru.io, for example), the check method (HTTP GET and so on), and whether it is enabled. - Request -- the request charset (UTF-8) and, where needed, parameters, body, and headers.
- Success/failure criteria -- the success status codes (
200, for example) and failure status codes, plus the decision regular expressions that separate success from failure on the body content. The criteria set here decide whether one check is "normal or failed". - Advanced -- the response timeout (30 seconds, for example; beyond it is a failure), allowing redirects, continuing past errors, and the retry count.
- SLA targets -- the baseline (SLO) at which this rule is recognized as having "kept" the
SLA. Two things are set.
- Response time p95 (ms) --
1000, for example. It means 95% of calls have to respond within 1 second. The slowest 5% are allowed, but if the 95th percentile passes this value the target is missed. - Success rate (%) --
99.9, for example. The cumulative success rate over the period has to be at or above this value (allowing one failure in a thousand).
- Response time p95 (ms) --
Key point The success/failure criteria (03) and the SLA targets (05) are different layers.
- The success/failure criteria decide "was this one check normal" (on the status code and the response time of a single call).
- The SLA targets decide "did those results, accumulated over the period, keep the promise (p95 and success rate)". Even when each single check succeeds, the SLA can be missed if the p95 response time often passes the target.
Note An SLA is a cumulative view over a period. One slow moment does not break it, but short failures accumulating often bring the attainment down (E3.3). That is why setting the target to "a value that can realistically be kept" matters.
Checking the Current State on the SLA Dashboard
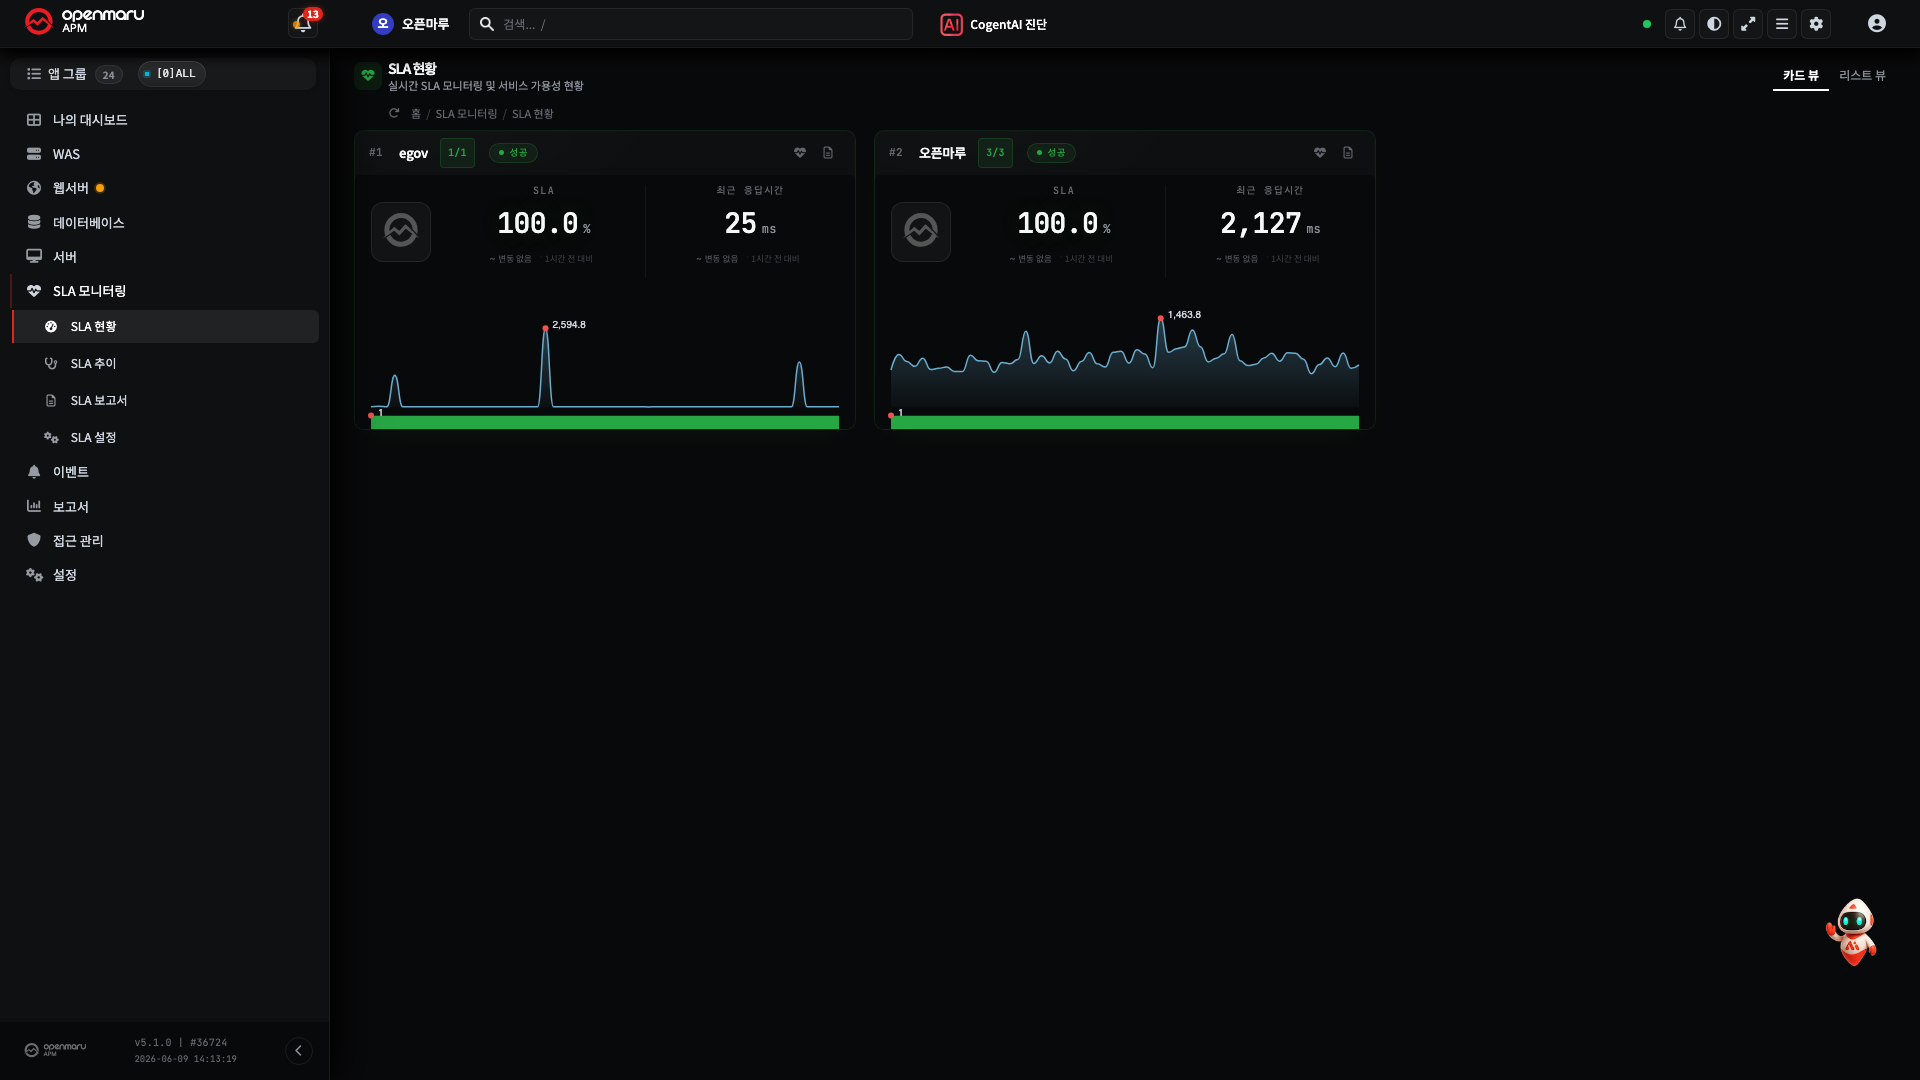
Whether the configured services are keeping their targets now is visible at a glance on the dashboard.
- Open left menu ▸ SLA Monitoring ▸ SLA Dashboard.
- Check the current availability and attainment state per service.
For the trend in more detail (the check results over time), look at the SLA Status screen.
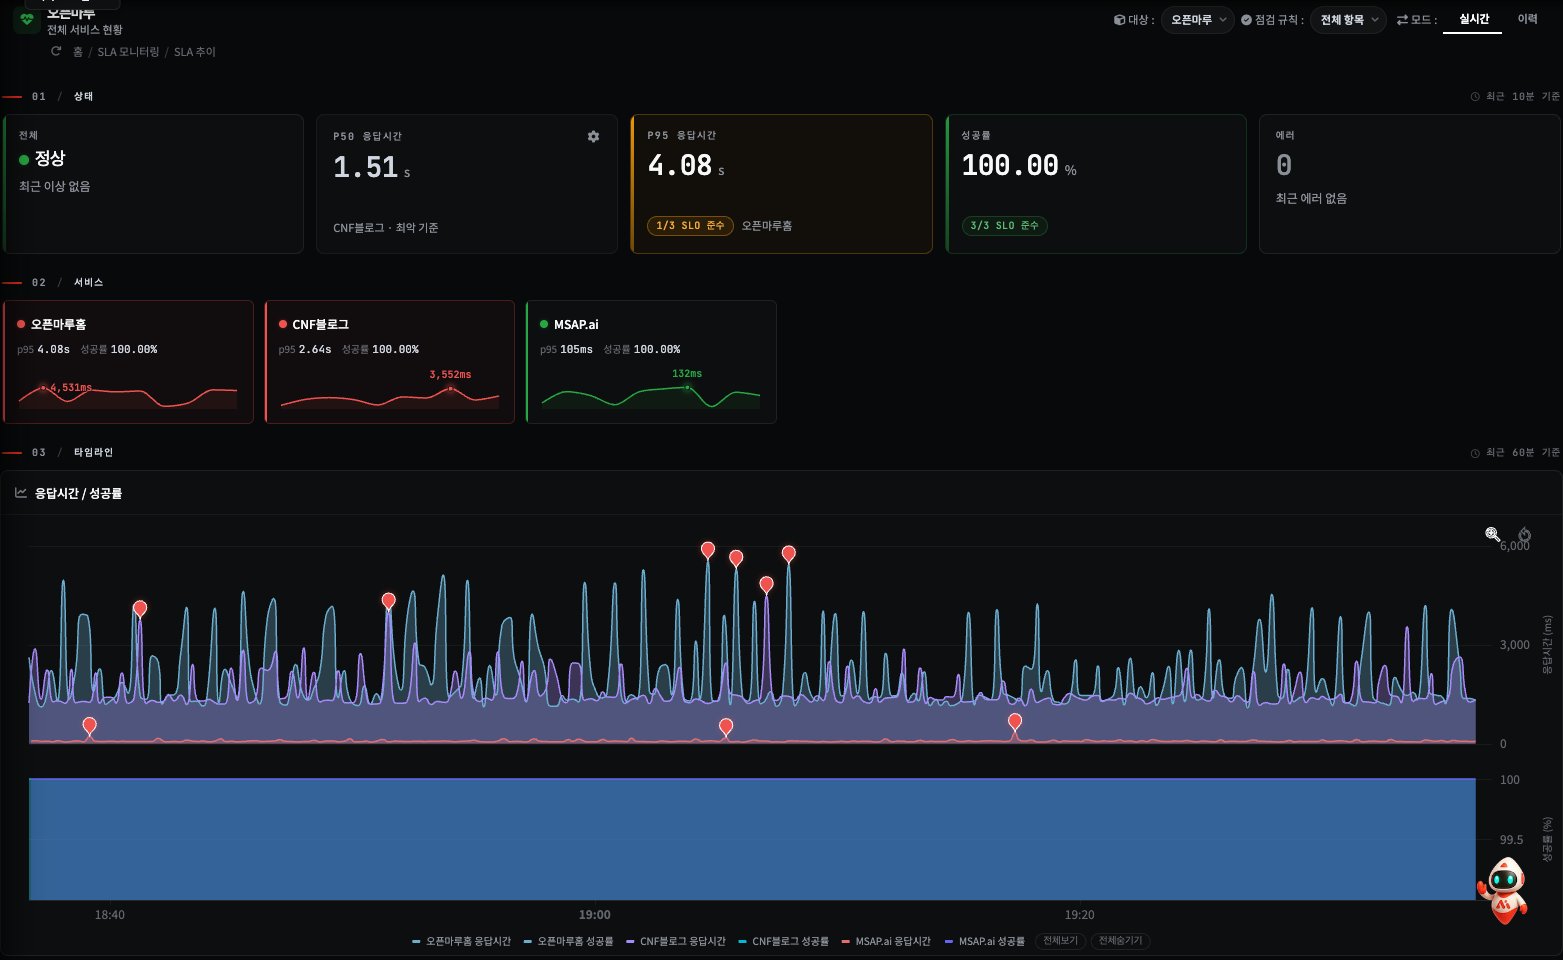
The screen above shows one service's (Openmaru's, for example) status summary (P50 and P95 response time, success rate, errors), the per-service cards, and the timeline (the response time and success rate over time). The trend shows at which point a check became slow or failed.
To change the period and look at the past, see H2. Changing the Period.
Getting an SLA Report
Get the availability and attainment over the whole period, set out for reporting.
- Open left menu ▸ SLA Monitoring ▸ SLA Report.
- Choose the target service and the period.
- Check the availability and attainment report.
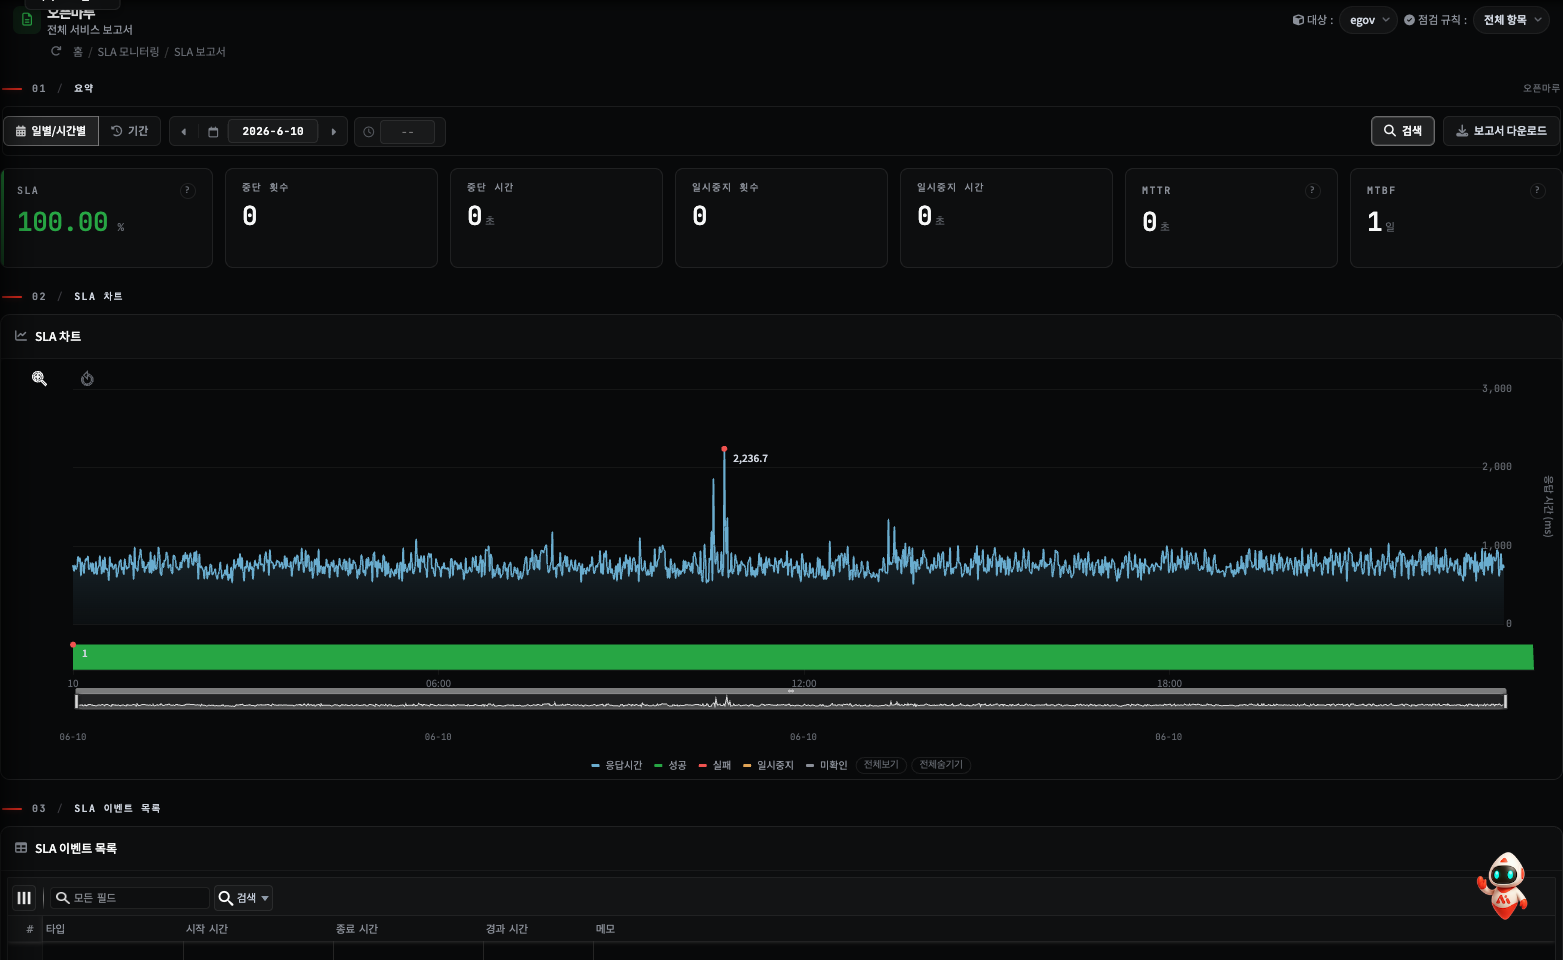
The example above is a daily report -- it consists of the summary (SLA attainment, outage count, outage duration, MTTR, MTBF), the SLA chart (that day's response time and success rate trend), and the SLA event list (the outage and pause intervals). It can be downloaded as a file with Download report.
The other periodic reports (daily, weekly, monthly) and the Excel download are set out in R5. Kinds of Report.
When It Does Not Work
| Symptom | What to check |
|---|---|
| The SLA Setting menu is not visible | Check the account has administrator permission -- SLA Setting is visible only to administrators |
| The dashboard is empty | Whether the service checks have been registered in SLA Setting first |
| Availability is lower than expected | Check the trend in SLA Status to see at which point a check failed |
| There is no data in the report | Check the service checks were running during the chosen period |
Related Documents
- E3.3 SLA and Availability -- the SLA concept
- R5. Kinds of Report -- the list of reports and downloads
- R1. Screen Map -- the whole SLA Monitoring menu