R5. Kinds of Report
Diátaxis: Reference (a dictionary to look things up in) · Audience: operators / administrators ← Back to contents
This sets out the kinds of report provided and how to get them. They can be viewed directly on the screen (View Report) or downloaded as a file.
How to open it -- left menu ▸ Report
Periodic Performance Reports (Daily / Weekly / Monthly)
These summarize performance per period, per application group.
| Report | Scope |
|---|---|
| Daily report | A day's performance summary per application group |
| Weekly report | A 7-day performance summary per group |
| Monthly report | A month's performance summary per group |
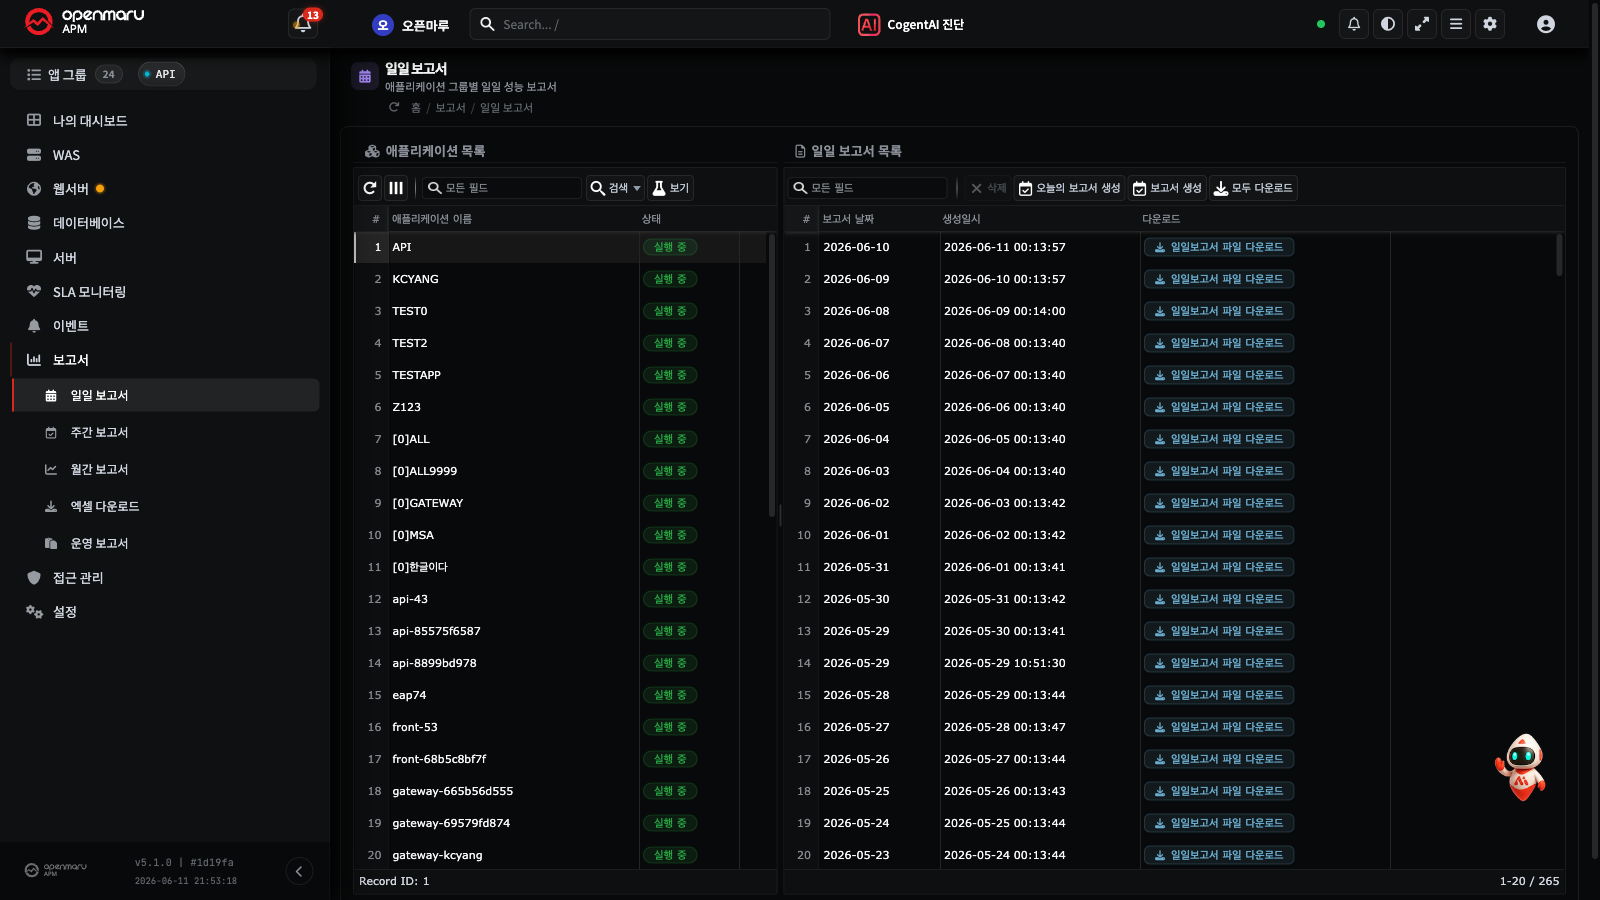
- Viewing: check it directly on the screen with View Report.
- Downloading: get the file with Download daily/weekly/monthly report file.
Note Which group the report covers follows the selection in the context selector. Choose the application group you want first.
Operations Report
A comprehensive report from the operations point of view. As a usage statistics and inspection report, it gathers the resources, events, and failure history of the whole system into one report. This menu is visible only to accounts with administrator permission -- the other report menus (daily/weekly/monthly and Excel download) are available to every user.
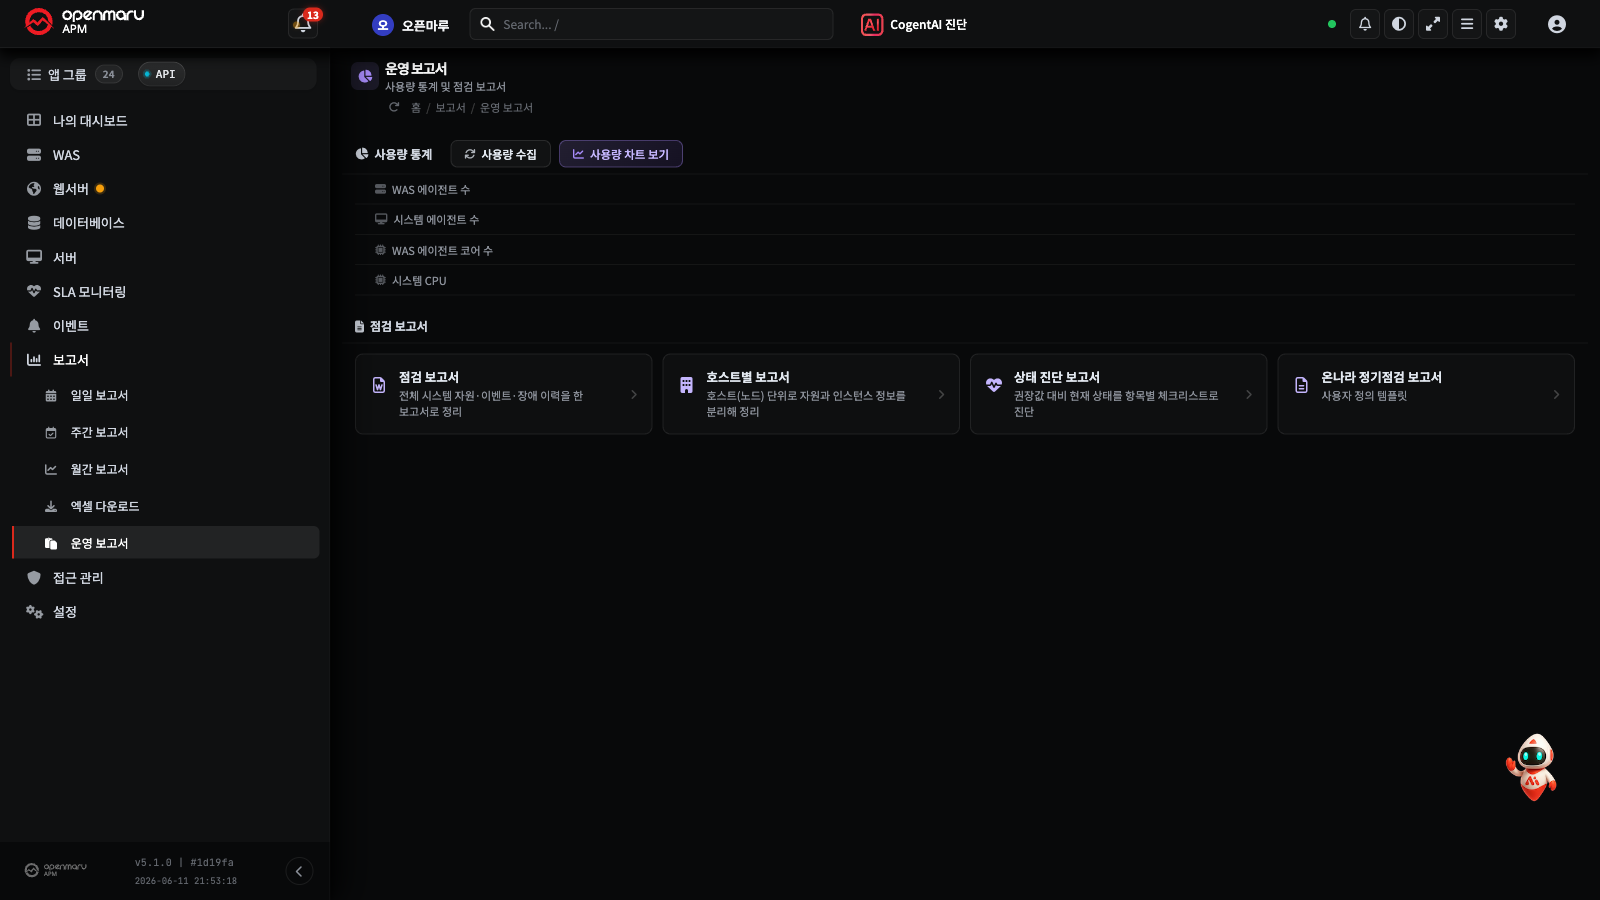
- Where the periodic performance reports answer "how well is the service running", the operations report is for "gathering the operating state and issues of the whole period at a glance".
The checks are grouped by tier.
| Tier | What is checked |
|---|---|
| OS / server | CPU, memory, disk, disk queue, ports |
| Web server | Workers and status, configuration changes, kernel parameters |
| WAS | JVM, threads, connection pools, and so on |
| Database | MySQL and CUBRID checks are included |
Note The database checks cover MySQL and CUBRID. A metric that could not be retrieved is reported differently from one that genuinely has no value, so when you see a blank you can tell from the report which case it is.
SLA Report
A report from the service level point of view (availability and attainment). Get it from SLA Monitoring ▸ SLA Report.
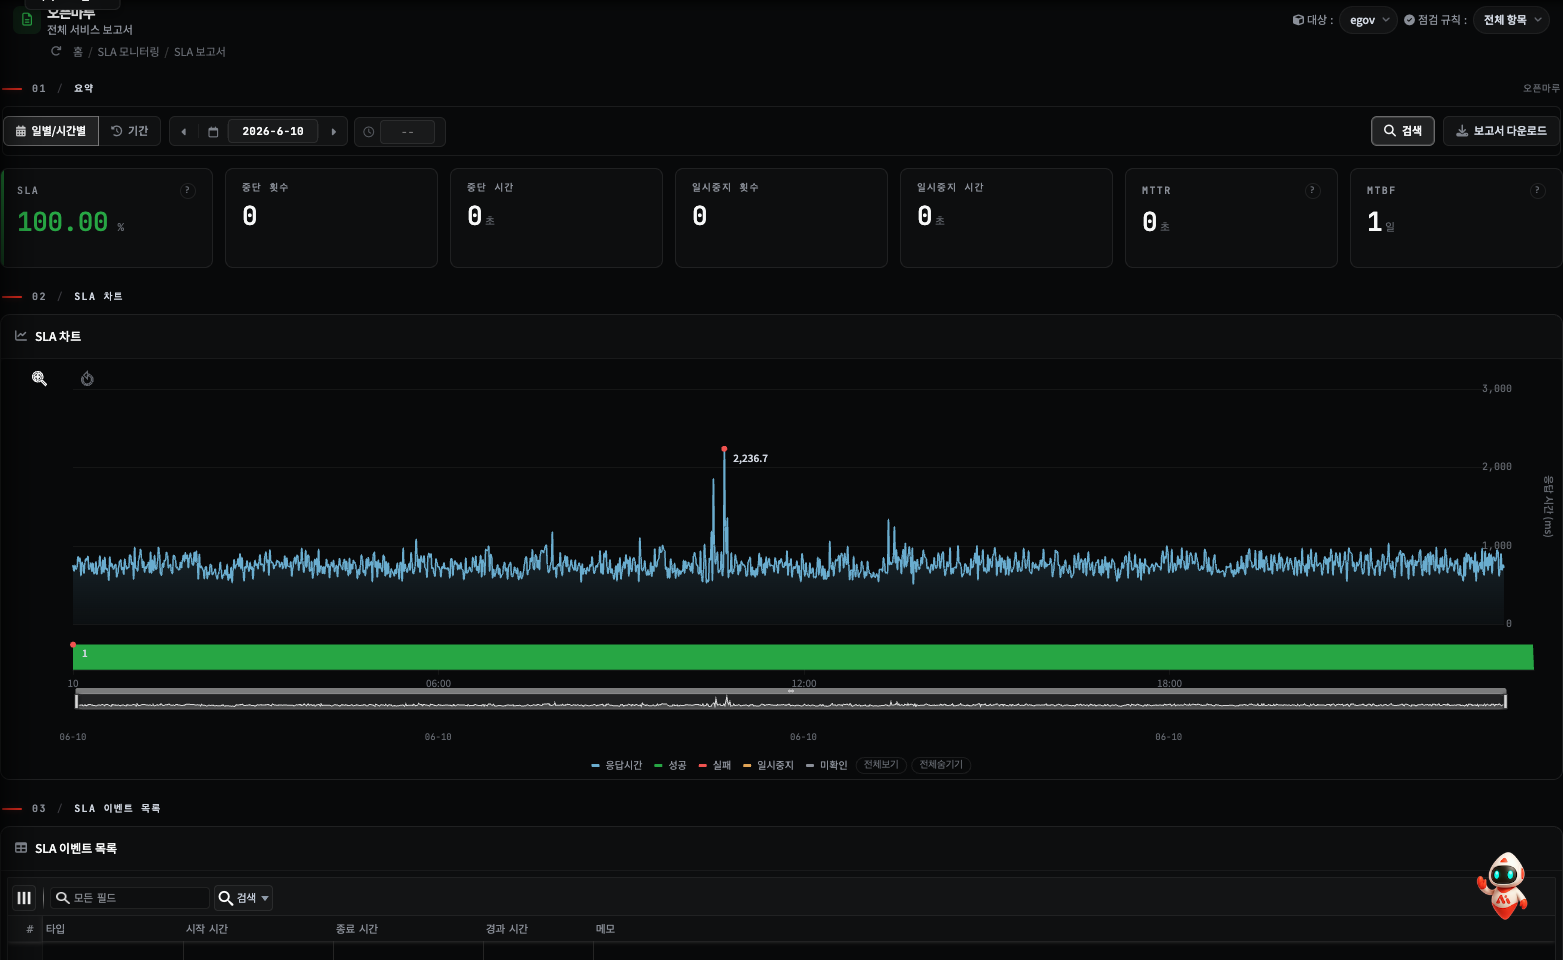
The configuration and checking steps are in H17. Setting SLA Targets and Getting Reports.
Excel Download
Downloads the monitoring data seen on the screen as an Excel file.
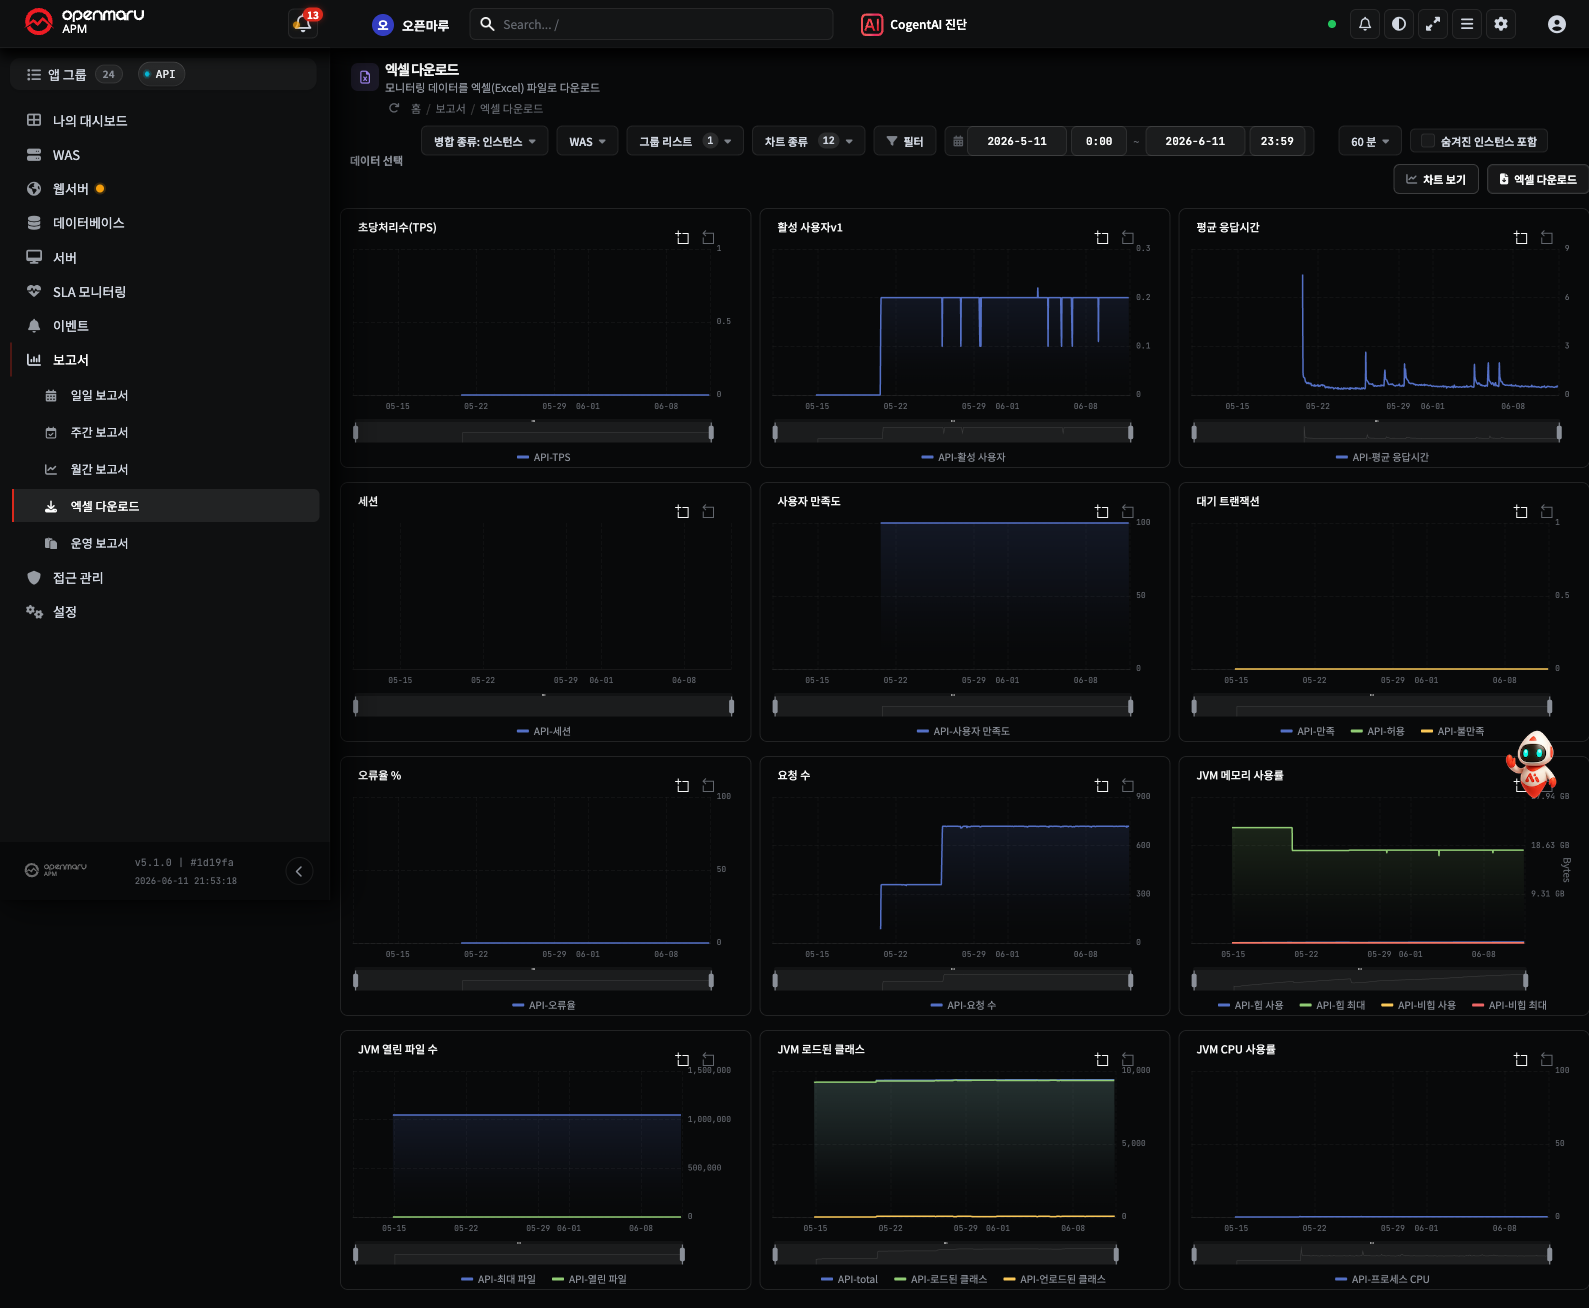
The order for getting it -- in left menu ▸ Report ▸ Excel Download, work along the top toolbar from the left.
- Merge type -- choose from instance, group, statistics, call statistics, or transaction. Choosing this makes the following items appear in the toolbar.
- Agent type -- choose WAS or SYS (shown according to the merge type).
- Group list -- choose the application group to get data for.
- Chart type -- choose the metrics to get. Choosing [ALL] selects every metric at once (TPS, response time, sessions, JVM, and so on).
- Set the date and time range and the data interval. Check Include hidden instances if needed.
- Press the Filter button -- the data matching the conditions is prepared and the View Chart and Excel Download buttons on the right become active.
- (Optional) Preview the data as a chart with View Chart.
- Pressing Excel Download downloads the data for the chosen conditions as an Excel file.
Caution Before Filter is pressed, the View Chart and Excel Download buttons are inactive (grey). If you have chosen every item and the buttons will not press, press Filter first.
- On the screens that support it (statistics, reports, and so on), get it with the Excel Download / Export button.
For exporting and operating on a single chart, see H4. Chart Controls.
Related Documents
- H4. Chart Controls -- Zooming, Comparing, Exporting
- H17. SLA Configuration and Reports
- R6. Settings Reference -- settings such as the Excel report language
- R1. Screen Map -- where the Report menu is