R3. Event Reference
Diátaxis: Reference (a dictionary to look things up in) · Audience: operators / administrators ← Back to contents
This sets out, dictionary style, the meaning, cause, likely problem, and points to investigate for each event met in the event list and alerts. There is no reading order; it is for looking up an event you have met.
Note The source of this dictionary is the same as the "event description" section of the event detail drawer in the product (what the event is / why it occurs / the likely problem / points to investigate). On the screen, clicking an event row shows the same description. For the steps to create an alert from an event, see H15. Alert Policies; for reducing a flood, see H16.
How to open it -- left menu ▸ Event ▸ Event List (/event/events)
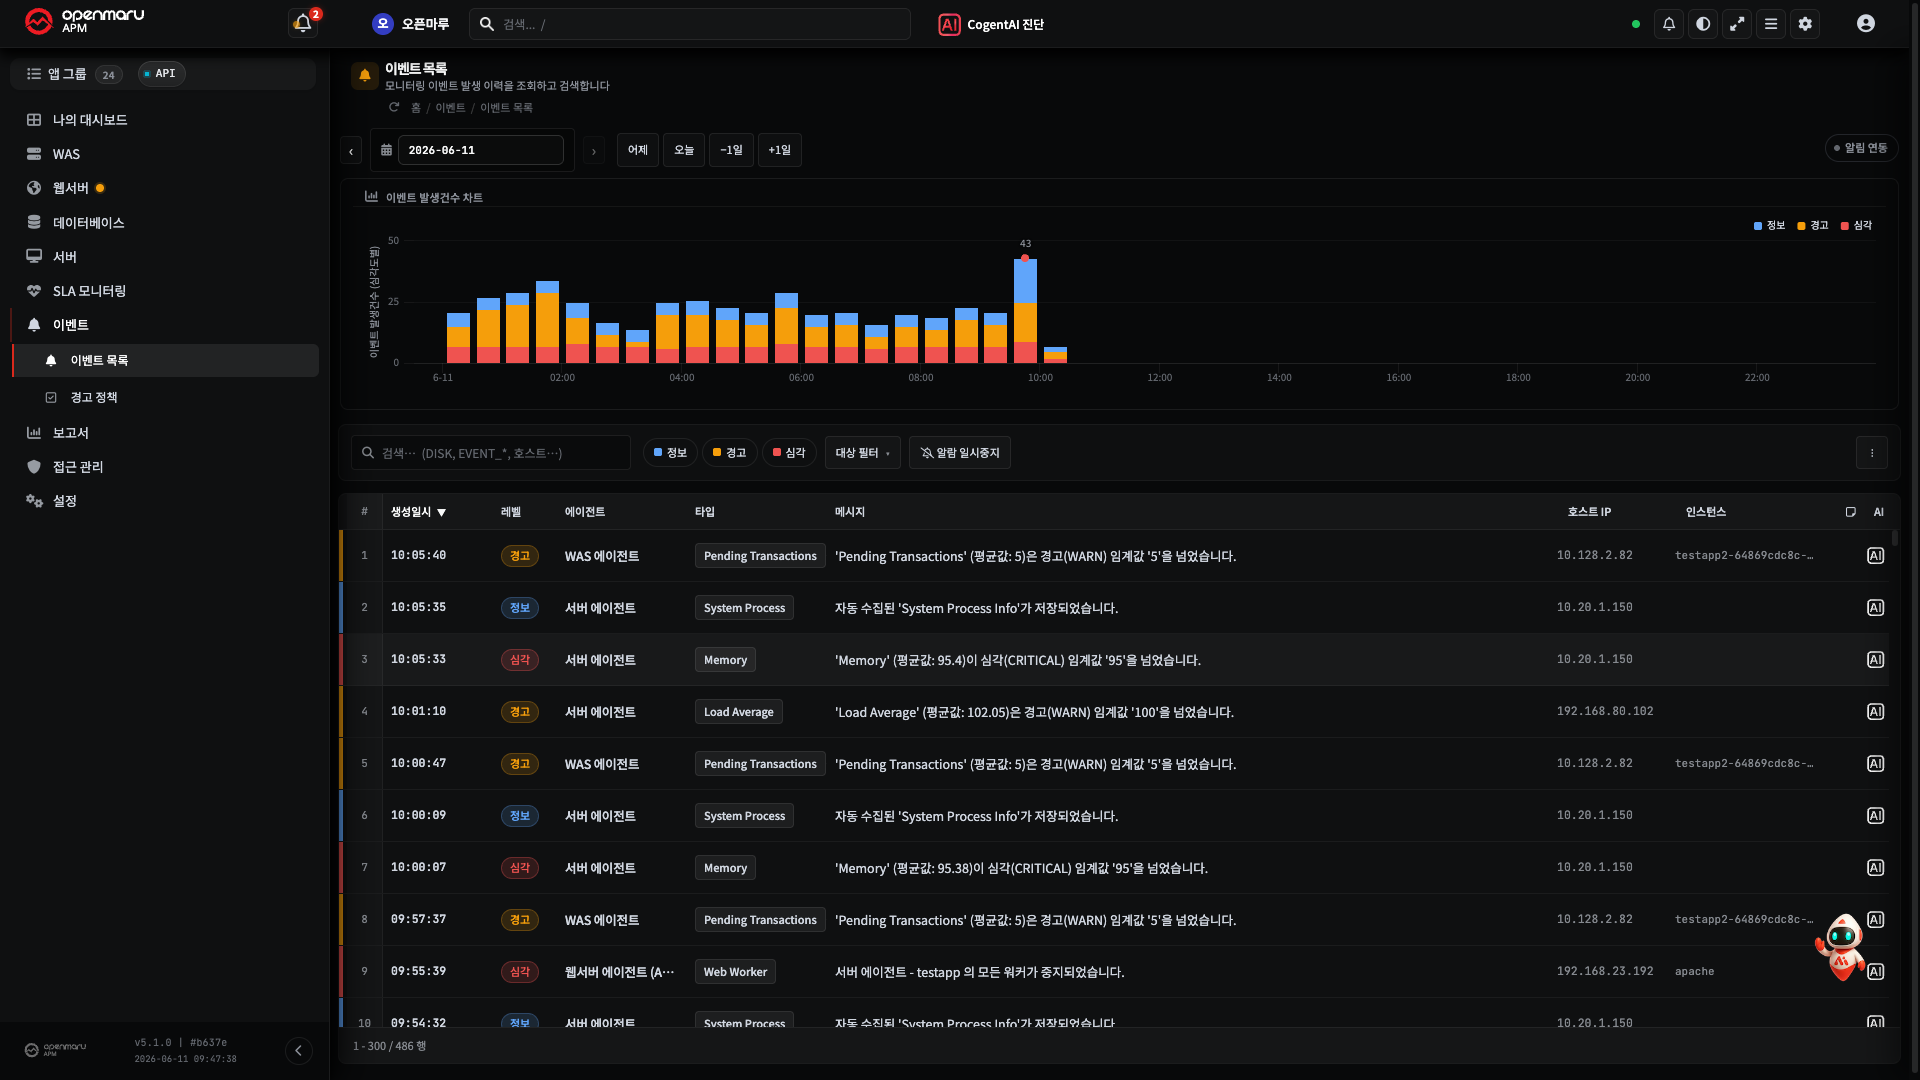
Event Levels (Severity)
| Level | Shown as | Meaning |
|---|---|---|
| INFO | Information | A state change or the result of an action. Usually no action needed |
| WARN | Warning | A level needing attention. A threshold exceeded, and so on |
| CRITICAL | Critical | A level needing immediate response. Close to a failure |
| FORECAST | Forecast | An advance warning that at the current trend it will soon reach critical |
| NOTI | Notification | Information such as an administrator announcement |
R3.1 Thresholds, Forecasts, and Outliers (Metric Based)
These are the events raised when a metric leaves the policy threshold. The kind of event (below) says "how it left", and the metric (the next table) says "which metric it was". The cause, likely problem, and points to investigate differ by metric.
| Event | Meaning |
|---|---|
| Threshold exceeded (WARN/CRITICAL) | The average of that metric passed the configured warning or critical threshold |
| Forecast threshold reached (FORECAST) | At the current trend it is forecast to reach the critical threshold soon (not yet exceeded) |
| Outlier detected (WARN) | The metric recorded a value statistically far from the usual pattern |
A forecast is the signal for judging whether advance action before the threshold is possible (securing resources, stopping work, relocating), while an outlier has limited impact once but is a precursor to passing the threshold when it repeats.
Cause, Likely Problem, and Points to Investigate, per Metric
| Metric | Cause (common) | Likely problem | Points to investigate |
|---|---|---|---|
| CPU utilization | Traffic, CPU-intensive work, an infinite loop, DDoS | Slow response, falling TPS | CPU per process, splitting user/system/IOWait, batch jobs |
| Memory utilization | A leak, excessive caching, bulk processing | Swapping starts → a sharp drop, OOM | Memory per process, the rising trend (a leak), when swapping starts |
| Load average | More processes waiting to run (CPU saturation or IO wait) | General processing delay | Compare with CPU (if CPU is low but load is high, it is I/O), disk response time |
| Disk usage | Logs and temporary files accumulating, data growth | Write failures → errors and stoppages | Large files, the retention policy, the rate of growth |
| Swap | A shortage of physical memory | Response tens of times slower (critical) | Processes holding excessive memory, adding or clearing |
| Network errors | A faulty NIC, driver, or cable | Packet loss, retransmission, disconnection | The interface error type, the hardware and switch |
| Network traffic | A traffic spike, a large transfer, an attack | Bandwidth saturation → slow communication | Where it comes from (connection, process), whether it is normal work |
| JVM heap | A leak, excessive caching, bulk objects | Frequent and slow GC, OOM | The top classes in the heap histogram and their trend, GC time |
| GC | Frequent GC from a heap shortage or a leak | STW accumulating → slow response | Together with heap utilization (still high after reclamation means a leak) |
| Pending transactions | Slow external calls or database, lock contention, an exhausted pool | Slow response, timeouts | The common stack of BLOCKED/WAITING in the thread dump |
| APDEX | Slow response, rising errors | Worse quality as users experience it | Break down response time and error rate, the slow URLs |
| Response time | Slow queries or external calls, a resource shortage, locks | More waiting, timeouts | Time per segment (database, external), CPU and GC |
| Error rate | Exceptions, bad requests, a dependent service failing | Requests fail | The URLs errors concentrate on and the exception types, the dependent services |
| Database connection pool | Rising use, a leak, too small a pool, long holds | Pool exhaustion → waiting and failures | The active connection trend, leak events, slow queries |
| Database response time | Slow queries, a missing index, locks | The delay spreads across the whole application | Long-running queries and their execution plans |
| Metaspace (perm) | Repeated redeployment, classes accumulating | A Metaspace OOM | The redeployment history and the class count trend |
| Web worker utilization | A request surge, backend delay | Worker exhaustion → connection failures | Backend response time, busy/idle, the worker count setting |
| Web traffic | A surge, large responses, crawlers, an attack | Bandwidth and worker saturation | The top URLs and clients, whether it is a normal event |
| CUBRID CAS | Slow queries, a surge in connections | Broker saturation → waiting and failures | busy/wait CAS, jobQ, longT/longQ |
| MySQL connections | An oversized pool, a leak, traffic | The limit reached → connections refused | PROCESSLIST, the pool and max_connections |
The table above lists only the common metrics. Detailed DBMS metrics -- temporary tables, full table scans, the buffer pool, write delays, and so on -- have the same four items described in the event detail.
R3.2 Diagnostic Data Collection (Automatic and Manual)
These are the events reporting that data for cause analysis has been saved, on a critical excursion or a user request. They are mostly INFO, and the automatic ones are triggered by the threshold or anomaly situation just before.
| Event | Meaning / points to investigate |
|---|---|
| Full thread dump | Collected on a user request or automatically on a surge in pending transactions. Check the common BLOCKED/WAITING stack, deadlocks, and the targets of slow calls |
| Active thread dump | For seeing the requests in flight (user request). Check the stack and call targets of long-running threads |
| System process information | On a user request, or automatically on critical CPU or memory. Check the top CPU and memory, and abnormal or new processes |
| JVM heap histogram | On a user request, or automatically on critical heap. Check the top classes by memory, the instance counts, and the rising trend (a leak) |
| Open files (lsof) | For analysing FD usage (on request). Check processes with excessive FDs and leak patterns |
| Network connections (netstat) | For analysing TCP state (on request). Check the ESTABLISHED/TIME_WAIT/CLOSE_WAIT distribution |
| CUBRID broker state | On request, or automatically on critical CAS. Check busy/wait CAS, jobQ, and long-running queries |
| DBMS statistics/diagnosis | On request, or automatically on a DBMS metric threshold. Check long-running queries, lock waits, and status variables |
| Full GC run | Triggered manually by a user. Check how much heap was reclaimed after GC (little reclaimed suggests a leak) |
| Container information | On a user request. Check containers in an abnormal state and their resource usage |
Note This automatically collected data is summarized and analysed by AI Diagnosis (H14). For the steps to use a dump, see H7. Checking for a Memory Leak and H20. Checking Agents.
R3.3 JVM Danger (Critical)
| Event | Meaning | Likely problem | Points to investigate |
|---|---|---|---|
| Deadlock detected | Two or more threads wait on each other's locks and are stuck for good | The related requests wait for good → pool exhaustion spreads | The lock acquisition order in the thread dump; unify the lock order in the code |
| OutOfMemory | A heap shortage (a leak, caching, bulk processing, too small a setting) | Requests fail, the process stops (critical) | The objects holding memory, from the heap dump or histogram; fix the leak or add heap |
R3.4 Agents (Connection State)
| Event | Meaning | Likely problem | Points to investigate |
|---|---|---|---|
| Agent connected | The agent started or reconnected (startup, restart, deployment, network recovery) | Normal, but if unexpected, suspect an abnormal termination just before | The gap from the previous stop event, whether the restart was intended |
| Agent stopped | The connection dropped (a stop, restart, abnormal termination, network break) | Monitoring stops -- it may be an actual service outage | Whether the stop was intended, whether the process is alive, the host and network |
| Agent unresponsive | No response (a hang, overload, network delay) | It is likely requests cannot be handled | The process state, host resources, a thread dump |
| Agent duplicate detection | Two agents connected with the same identity (IP + instance.id for WAS, the IP for SYS), and the collection server rejected one of the connections | The rejected one is not collected. For SYS, the Agent Status screen may merge the two into one line and show RUNNING | WAS: change instance.id in khan-agent.conf, then restart. SYS: check khan.agent.ip in khan-sys-agent.conf on each server, check whether a /32 virtual IP on the lo interface is reported as the agent address, stop the duplicate agent on the same host |
The agent status screen and the response steps are in H20. Checking Agent Status.
Agent duplicate detection is not an event stored in the event list; it is shown on the Agent Duplicate Detection tab of the Alert bell window in the header. It disappears once no rejection occurs for 15 minutes after the last one -- H20. Responding to Agent Duplicate Detection.
R3.5 Web Server Load Balancer (Workers)
| Event | Meaning | Likely problem | Points to investigate |
|---|---|---|---|
| Whole group stopped | Every worker in the LB group has stopped | Every request to this group fails (5xx) -- a service outage | The backend state, the web server error log, the deployment history (immediately) |
| Group recovered | An available worker has appeared in the group | It has resumed, but the effect of the outage window remains | Whether every member has recovered, whether the cause is resolved |
| Member stopped | A particular member's worker stopped (the backend is down, or the health check failed) | Redistribution to the remaining members → a risk of overload | The member's backend state, the load on the remaining members |
| Member started | The member became active as the backend started or recovered | Handling capacity is back to normal | Whether it was planned work, the state of the group members |
| Member recovered | A failed member passed the health check and returned | Traffic distribution is back to normal | The stability of the recovery (recurrence), whether the cause is resolved |
R3.6 Transaction and Database Problems
| Event | Meaning | Likely problem | Points to investigate |
|---|---|---|---|
| URL state problem (WARN/CRITICAL) | An abnormal response in the URL check (code or time) | Request failures, perceived delay | The response code and time, the target instance, the error rate |
| Datasource suspended | The pool went into protection mode from an unreachable database or accumulated errors | Requests on that pool fail or wait | The database state and network, the pool settings (validation query, retries) |
| Connection leak | A code path that does not return a connection (a missing close) | Accumulating, it exhausts the pool → waiting and failures | A missing close or try-with-resources on the detected URL |
| Excessive fetch | One request queried an abnormally large number of rows (missing paging) | A memory spike, slow response | Check the LIMIT and conditions of that URL's query |
| Transaction index missing | The query index was deleted or never created (found in an internal check) | Query performance drops (automatic repair is attempted) | Whether the repair succeeded; create it manually if it failed |
The steps for diagnosing an exhausted database pool are in H8. Database Connection Pool Exhaustion.
R3.7 Service Checks (SLA)
| Event | Meaning | Points to investigate |
|---|---|---|
| Health check failed | A response code or content mismatch, a closed port, a timeout | The reason for the failure (code, regular expression, port), the target process and network |
| Health check test | A user ran a test of the configuration (no effect on production) | Whether it matches the expected success or failure condition |
| Recovery command succeeded | The configured recovery command ran successfully on a health check failure | Confirm it actually recovered with the following health check |
| Recovery command failed | An error in the recovery command (permission, path, script) | Check the error code and message; recover manually |
SLA configuration and reports are in H17. SLA Configuration and Reports.
R3.8 Licences, Policies, Security, and Other
| Event | Meaning / points to investigate |
|---|---|
| Licence expired | The validity period has passed -- features may be limited. Check for the information change event after renewing |
| Licence expiring soon | Due to expire within 3 days -- renew before it does |
| Licence error | A key, host, or capacity mismatch -- check the key and what it applies to |
| Licence information changed | It has been renewed or reapplied -- check the applied capacity and expiry date |
| Alert policy reapplied | An administrator edited a threshold or policy -- check the alert frequency is appropriate after the change |
| Invalid instance ID | The naming rule (lower-case alphanumerics and hyphens) was broken -- fix the agent instanceId |
| Brute force attack detected | Repeated attempts passed the threshold -- check the source IP and account, and consider blocking or locking |
| Administrator notice (NOTI) | An administrator announcement -- read the content |
| Kubernetes/OpenShift | A cluster pod or node event -- a WARN can affect scheduling and restarts. Check the pod and node state |
| Web server ingress control | The result of a traffic block or allow command -- on failure it was not applied. Check the applied state on the target workers and group |
| Thread control | The result of a control action such as a thread interrupt -- recheck the thread state on the target instance |
| Disk usage warning | The collection server's disk usage is at 90% or above -- an early warning separate from automatic cleanup |
| Disk auto-cleaned | The predicted usage passed the threshold and old transaction detail data was deleted automatically -- check the deleted range and the usage after cleanup |
| Disk cleanup limit reached | Data was deleted down to the minimum retention days but usage is still over the threshold -- there is no more data to delete; manual action is needed |
| Legacy storage mode | Automatic disk usage management does not run in legacy transaction storage mode |
For an event not in the table above, refer to the event message and parameters and judge the impact by the level (information/warning/critical). AI Diagnosis in the event detail can give an estimate of the cause (H14).
Related Documents
- H15. Creating and Tuning Alert Policies · H16. Reducing an Alert Flood
- R2. Chart Metric Reference -- the metric that raised the event, as a chart
- E3. What the Metrics Mean -- the metric concepts
- Diagnostic procedures: H7 · H8 · H10 · H20