4.10. Pods
Overview
The Pods page shows every pod in the multi-cluster environment in one place. A pod is the smallest deployable unit in Kubernetes -- a logical host holding one or more containers.
What it is for:
- Viewing multi-cluster pods together
- Monitoring pod status and resource usage
- Reading container logs live
- Checking the pod status conditions
What a pod is like:
- The smallest deployable unit in Kubernetes
- Holds one or more containers
- Shares network and storage
- Is ephemeral by nature
How the Screen Is Laid Out
The Pods page shows the pod list as a table. This resource is of the Managed type, so it shows the resources that exist on the member clusters.
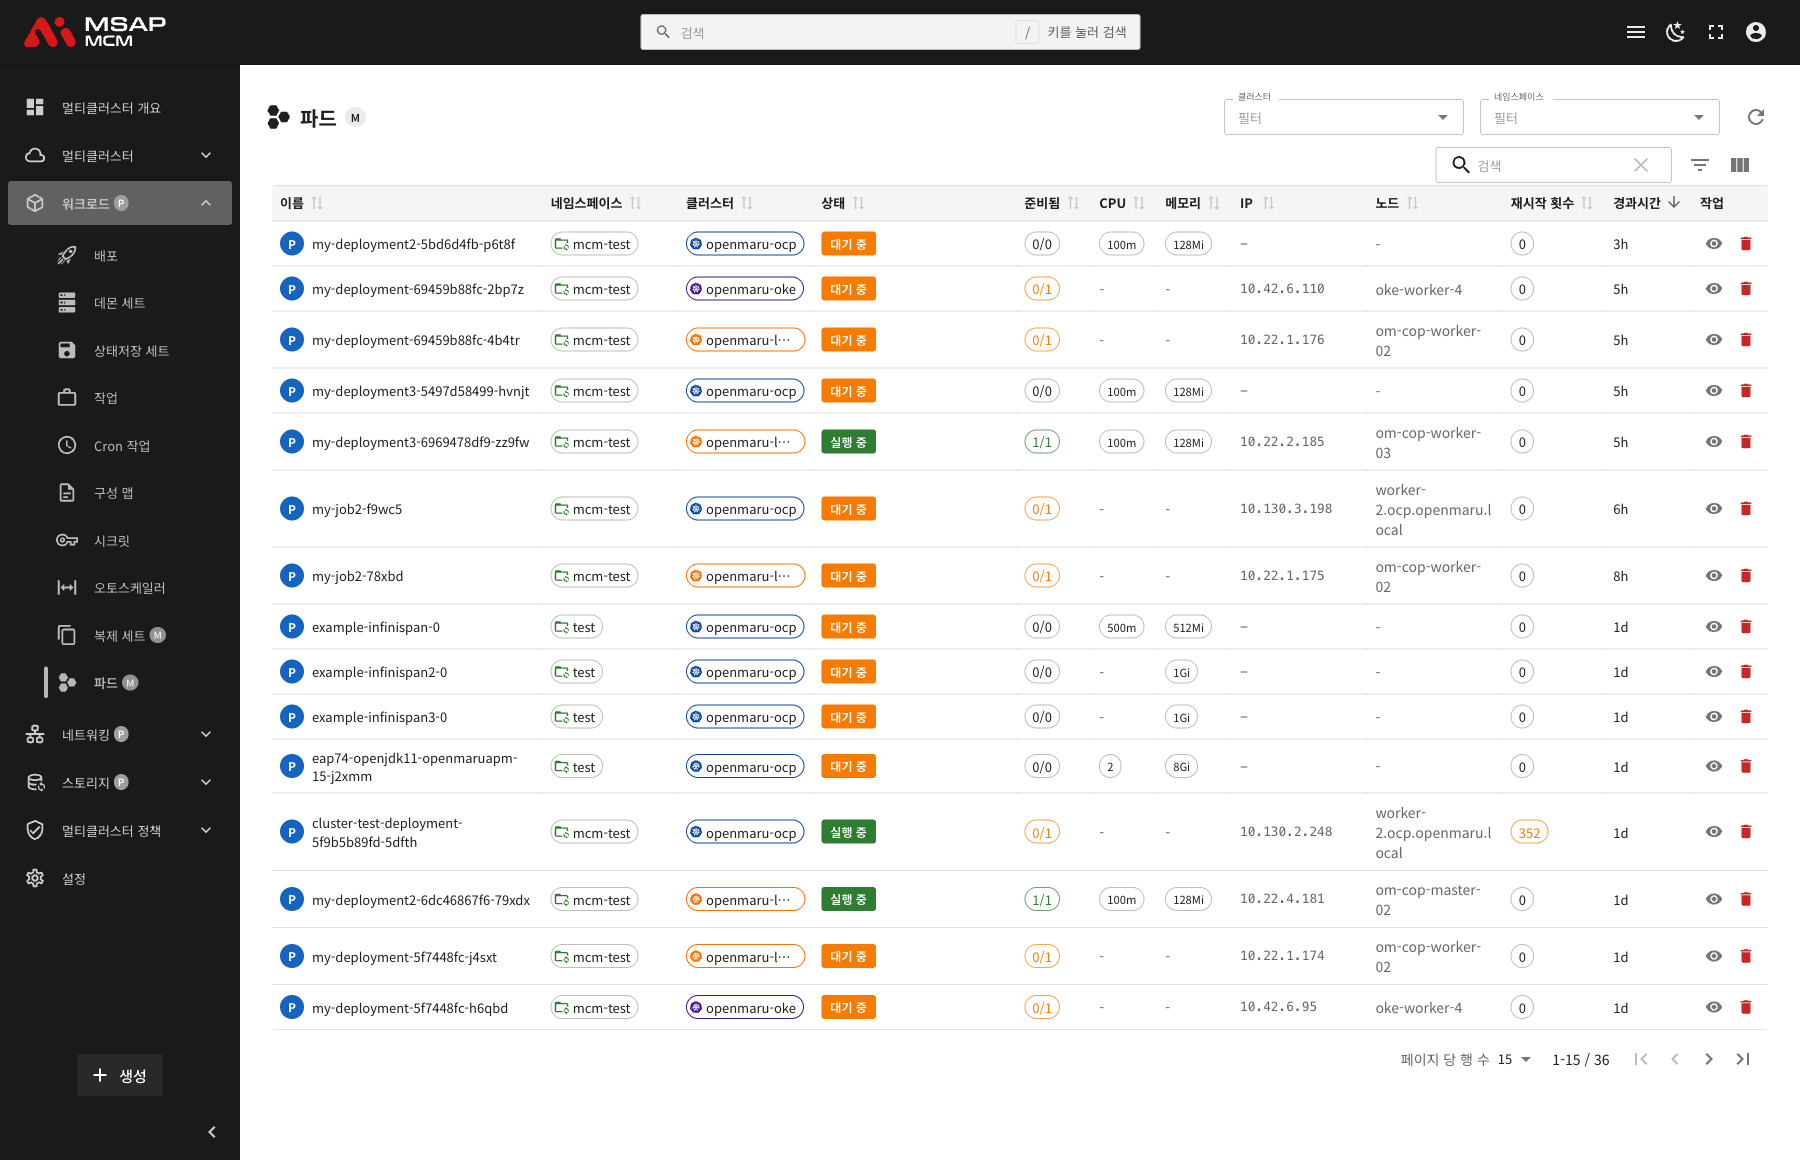
The Elements at the Top of the Page
| Element | Description |
|---|---|
| Cluster filter | Shows only the pods of a particular cluster |
| Namespace filter | Shows only the pods of a particular namespace |
| Refresh button | Refreshes the pod list |
| Search box | Searches by pod name |
Table Columns
| Column | Description | Sortable |
|---|---|---|
| Name | The pod name | ✅ |
| Namespace | The namespace the pod belongs to | ✅ |
| Cluster | The cluster the pod is running on | ✅ |
| Status | The pod state (Running / Pending / Failed and so on) | ✅ |
| Ready | Ready containers / total containers | ✅ |
| CPU | The CPU request and limit (request: 100m / limit: 500m, for example) | ✅ |
| Memory | The memory request and limit (request: 128Mi / limit: 256Mi, for example) | ✅ |
| IP | The pod IP address | ✅ |
| Node | The node the pod is scheduled on | ✅ |
| Restarts | The container restart count | ✅ |
| Age | The time since the pod was created | ✅ |
| Actions | The view and delete buttons | - |
How Status Is Shown
The Status column shows the pod's current state:
| Status | Description | How it is shown |
|---|---|---|
| Running | The pod is running normally | Green |
| Pending | Waiting to be scheduled, or pulling the image | Yellow |
| Succeeded | Every container ended successfully | Blue |
| Failed | One or more containers failed | Red |
| Unknown | The pod state cannot be determined | Grey |
How the Resources Are Shown
The CPU and Memory columns show the resource requests and limits:
- Format:
request: [value] / limit: [value] - For example
request: 100m / limit: 500m(CPU) - For example
request: 128Mi / limit: 256Mi(memory) - Where no resources are set,
-is shown
Pod Detail
Clicking a pod row opens the detail panel.
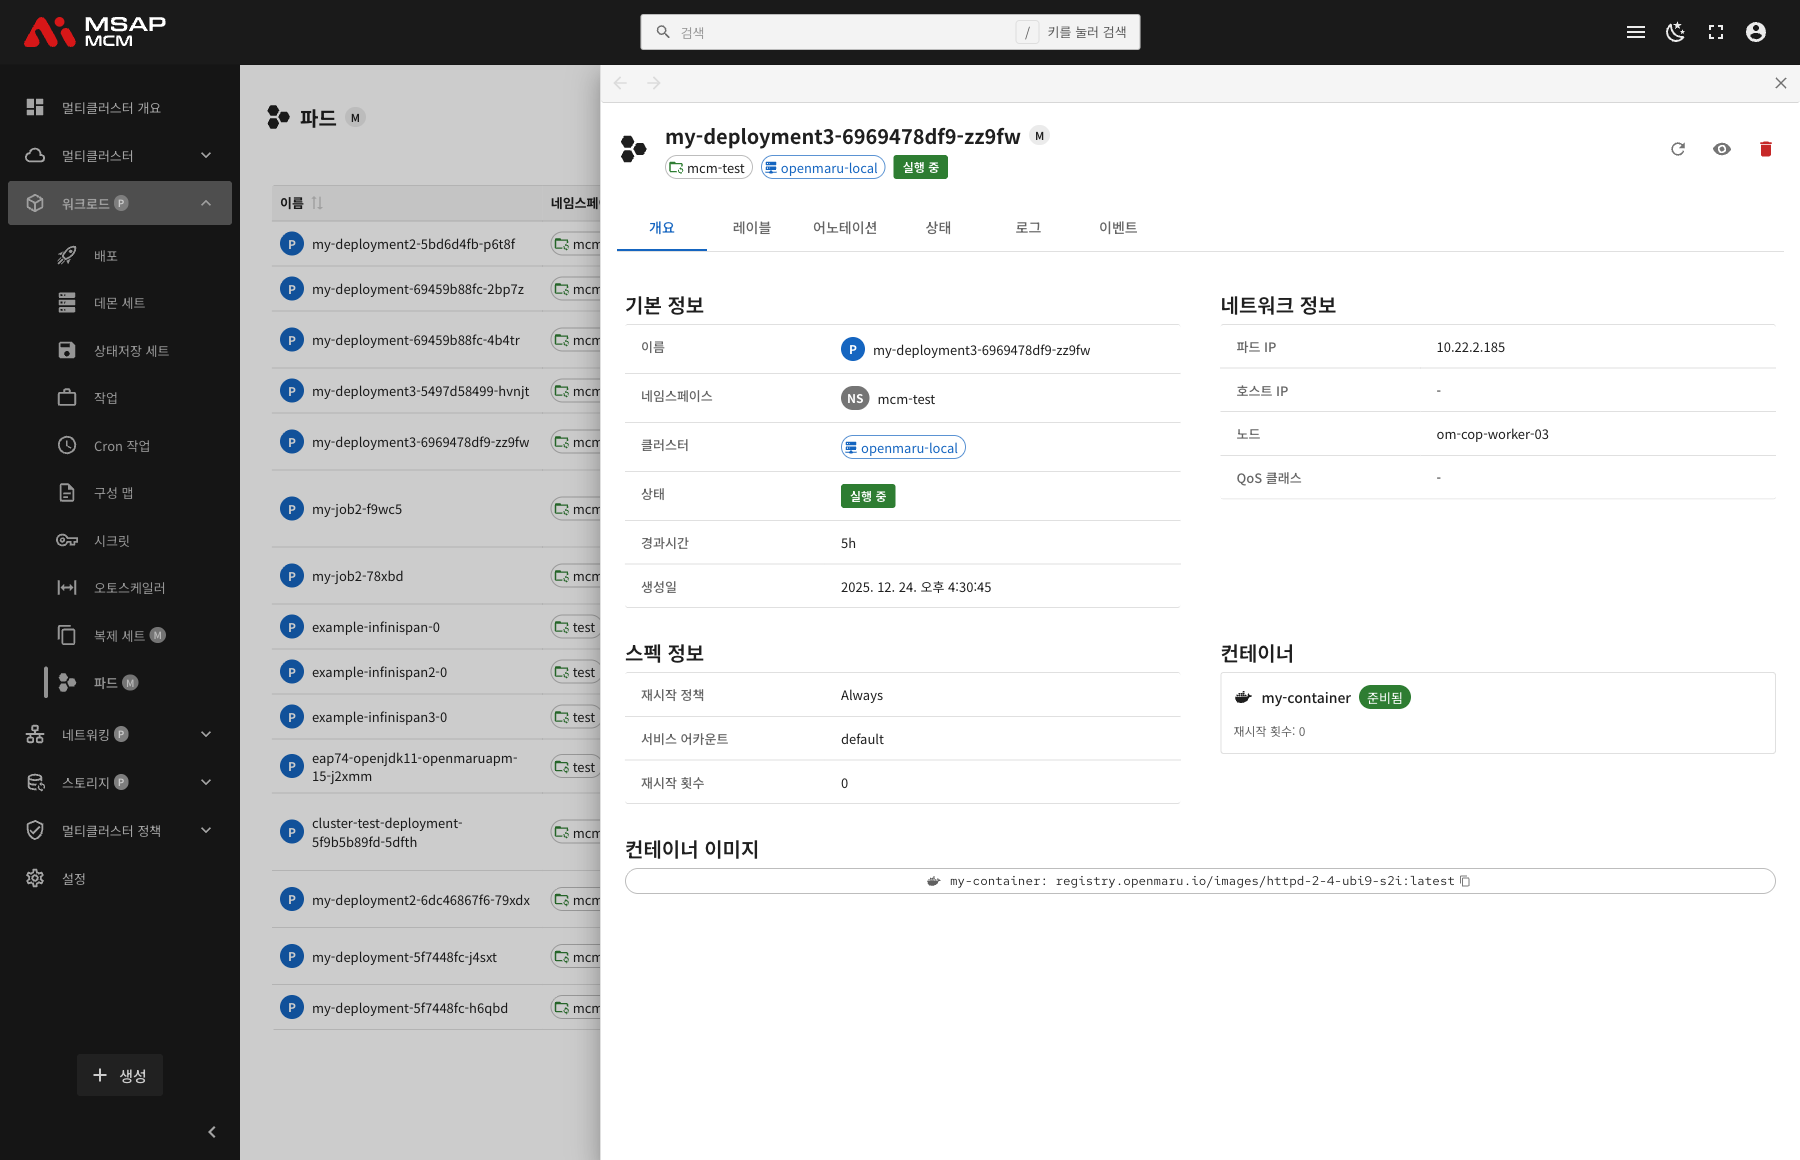
The Detail Panel Header
| Element | Description |
|---|---|
| Pod name | The name of the chosen pod |
| Managed badge | Marks it as a member cluster resource |
| Namespace | The namespace the pod belongs to |
| Cluster | The cluster the pod is running on |
| Status | The pod state (Running / Pending and so on) |
The Action Buttons
| Button | What it does |
|---|---|
| Refresh | Refreshes the pod information |
| View | Opens the YAML view mode |
| Delete | Deletes the pod |
The Tabs
The Overview Tab
Shows the pod's basic information, network information, specification, and containers.
Basic information:
| Item | Description |
|---|---|
| Name | The pod name |
| Namespace | The namespace the pod belongs to |
| Cluster | The cluster the pod is running on |
| Status | The pod state |
| Age | The time since creation |
| Created | When the pod was created |
Network Information:
| Item | Description |
|---|---|
| Pod IP | The IP address assigned to the pod |
| Host IP | The IP of the node the pod runs on |
| Node | The name of the node the pod is scheduled on |
| QoS Class | The quality of service class (Guaranteed / Burstable / BestEffort) |
Spec Information:
| Item | Description |
|---|---|
| Restart Policy | The container restart policy (Always / OnFailure / Never) |
| Service Account | The service account the pod uses |
| Restarts | The total container restart count |
Containers:
Shows the list of containers in the pod:
- The container name
- The state (ready / waiting / failed)
- The restart count
Container images:
Shows the image of each container. The copy button copies the image URL to the clipboard.
The Labels Tab
Shows the list of Kubernetes labels applied to the pod.
The Annotations Tab
Shows the list of annotations applied to the pod.
The Conditions Tab
Shows the pod's status conditions.
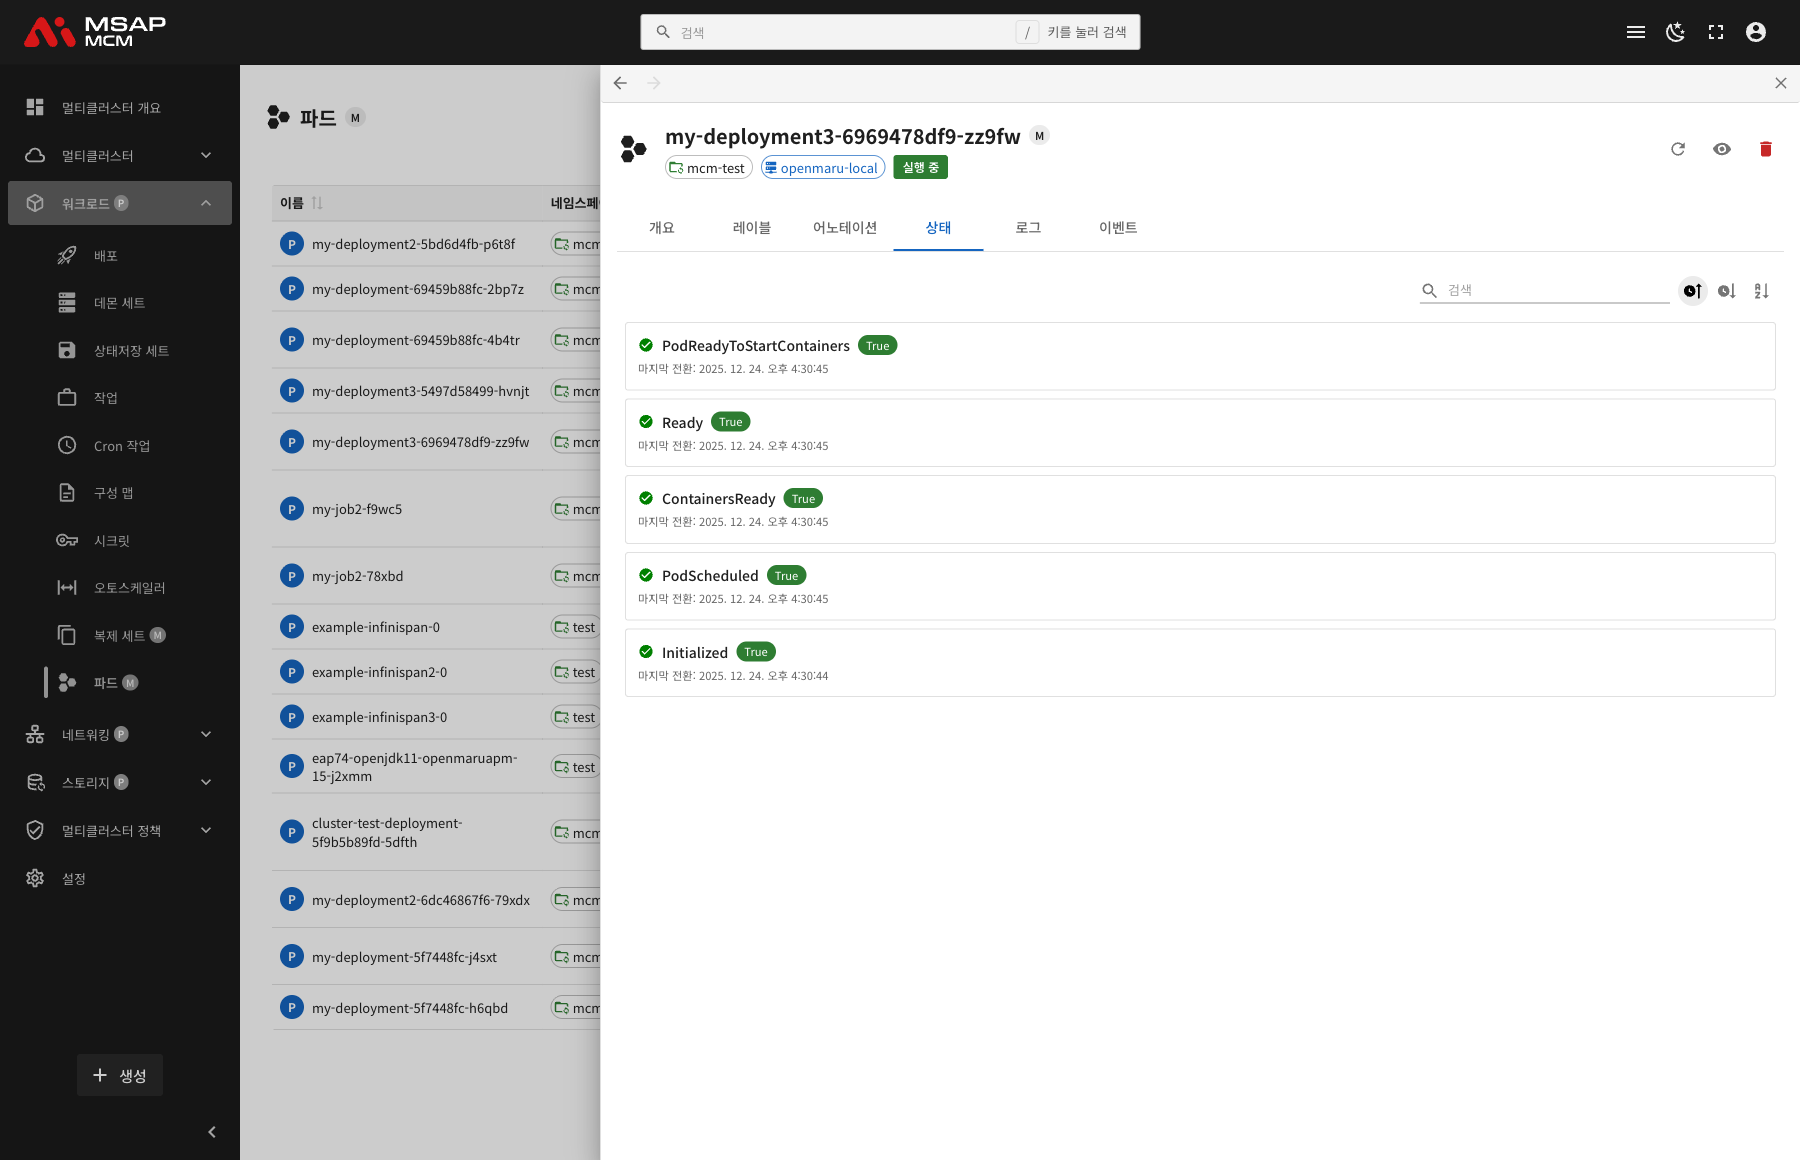
The conditions:
| Condition | Description |
|---|---|
| Initialized | The init containers completed successfully |
| PodScheduled | The pod has been scheduled on a node |
| ContainersReady | Every container is ready |
| Ready | The pod is ready to handle requests |
| PodReadyToStartContainers | The pod is ready to start its containers |
Each condition shows:
- The condition name
- Its state (True / False / Unknown)
- The last transition time
Sort options:
- Newest: by last transition time, newest first
- Oldest: by last transition time, oldest first
- By type: alphabetically by condition type
The Logs Tab
Shows the container logs live.
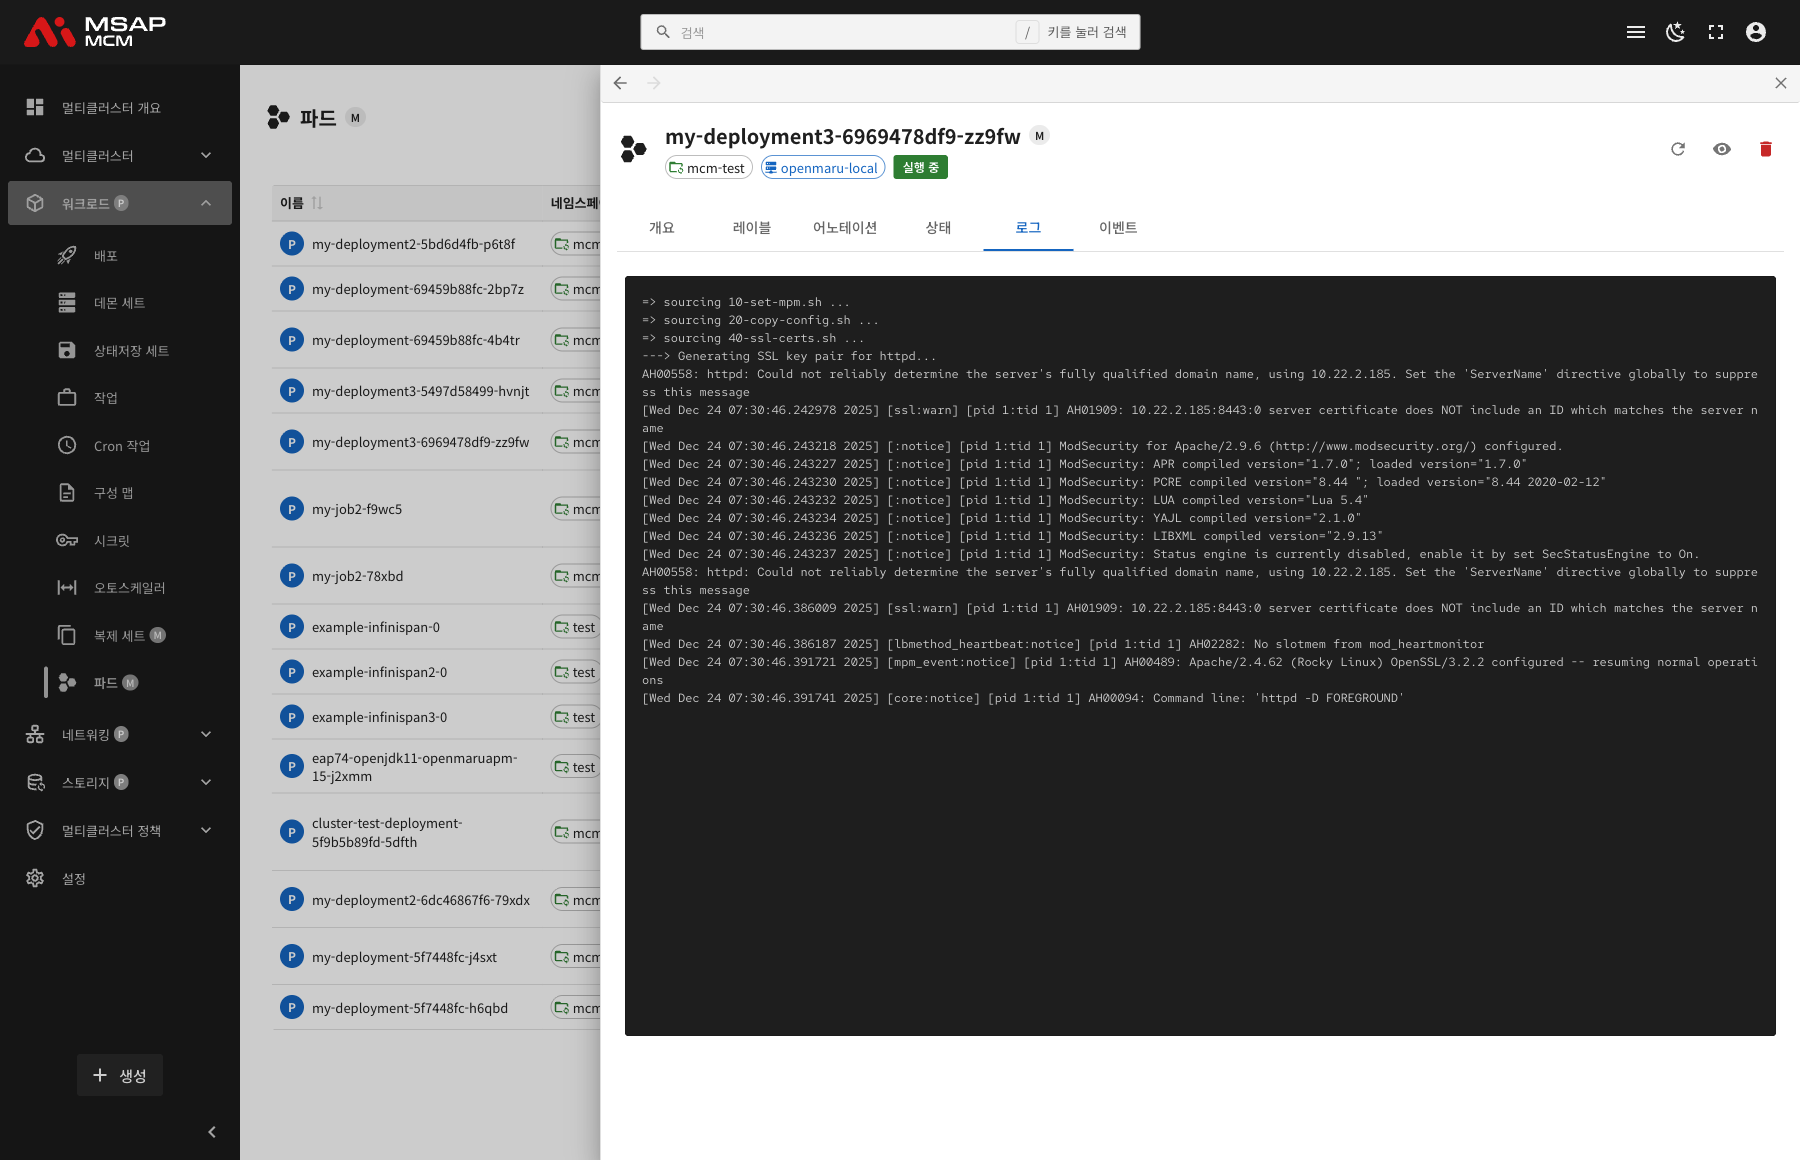
Main features:
- Reading container logs live
- Choosing the container on a multi-container pod
- Scrolling and searching the logs
Note: the logs are read directly from the member cluster the pod runs on.
The Events Tab
Shows the Kubernetes events related to the pod.
Pod Operations
Viewing the Pod YAML
- Choose the pod
- Press the "View" button in the detail panel
- Read the pod definition in the YAML viewer
Deleting a Pod
⚠️ Caution: deleting a pod ends its containers at once. A pod managed by a Deployment is recreated automatically.
- Choose the pod to delete
- Press the "Delete" button in the detail panel
- Type the pod name in the confirmation dialog
- Press the "Delete" button
Worked Examples
Scenario 1: Checking Pod Status
- Click the pod you want to check on the Pods page
- Check the basic information on the Overview tab:
- The pod state (Running / Pending and so on)
- Whether the containers are ready
- Check the detailed conditions on the Conditions tab:
- The True/False state of each condition
- The last transition time
- Where there is a problem, find the cause on the Events tab
Scenario 2: Reading Container Logs
- Click the pod whose logs you want
- Choose the Logs tab
- Read the container logs live
- Choose the container on a multi-container pod
- Search and scroll the logs as needed
Scenario 3: Viewing Pods per Cluster
- Click the cluster filter dropdown
- Choose the cluster to check
- Only that cluster's pods are shown
- Add the namespace filter as well if needed
Scenario 4: Debugging a Problem Pod
- Find the pods showing "Pending" or "Failed" in the Status column
- Click the pod for its detail
- Check which condition is False on the Conditions tab
- Check the error message on the Events tab
- Check the container logs on the Logs tab
- Act once the cause is found
Scenario 5: Checking Resource Usage
- Check the CPU and Memory columns in the pod list
- Check the resource request and limit values
- Check the QoS class in the detail panel
- Change the Deployment where the resources need adjusting
Related Concepts
The Pod Lifecycle
A pod goes through these phases:
- Pending: waiting to be scheduled, or pulling the image
- Running: one or more containers are running
- Succeeded: every container ended successfully
- Failed: one or more containers ended in failure
- Unknown: the pod state cannot be determined
The Pod Status Conditions
| Condition | Description |
|---|---|
| PodScheduled | The pod has been scheduled on a node |
| Initialized | Every init container completed |
| ContainersReady | Every container is ready |
| Ready | The pod is ready to take traffic |
QoS (Quality of Service) Classes
| Class | Condition | Priority |
|---|---|---|
| Guaranteed | Every container has the same request and limit | Highest |
| Burstable | Requests or limits are set in part | Middle |
| BestEffort | No requests or limits | Lowest |
When resources run short, BestEffort pods are evicted first.
Restart Policies
| Policy | Description | Where it is used |
|---|---|---|
| Always | Always restarts (the default) | Deployment, StatefulSet |
| OnFailure | Restarts only on failure | Job |
| Never | Never restarts | One-off work |
Container States
| State | Description |
|---|---|
| Waiting | Waiting for the container to start |
| Running | The container is running |
| Terminated | The container has ended |
Managed Resources
A pod is a Managed resource:
- A resource that exists directly on a member cluster
- It can only be viewed from the MCM control plane
- The cluster filter shows a particular cluster's resources
- Logs and status are read directly from the member cluster
Resolving Problems
When a pod stays Pending:
- Resources are short: the node has not enough CPU or memory
- The image pull failed: check the image name and registry authentication
- The node selector: no node matches the condition
- Waiting on a PVC binding: check the PersistentVolume
When a pod is in CrashLoopBackOff:
- The container fails over and over
- Check the error message on the Logs tab
- An application configuration or dependency problem
When a pod is in ImagePullBackOff:
- The image name is wrong
- The registry cannot be reached
- The image pull secret is missing
Next Steps
- Services -- managing multi-cluster services
- Deployments -- the Deployment that manages the pods
- ReplicaSets -- ReplicaSet management