2.1. Overview (the Dashboard Home)
Overview
The Overview page is the main screen shown first after signing in to the OPENMARU MCM Console. It is designed so the whole state of the multi-cluster environment can be taken in at a glance.
What it is for:
- Monitoring the whole state of the multi-cluster environment
- Checking resource usage per cluster
- Seeing how workloads are deployed
- Quickly identifying resources with a problem
How the Screen Is Laid Out
The Overview page is made up of four areas.
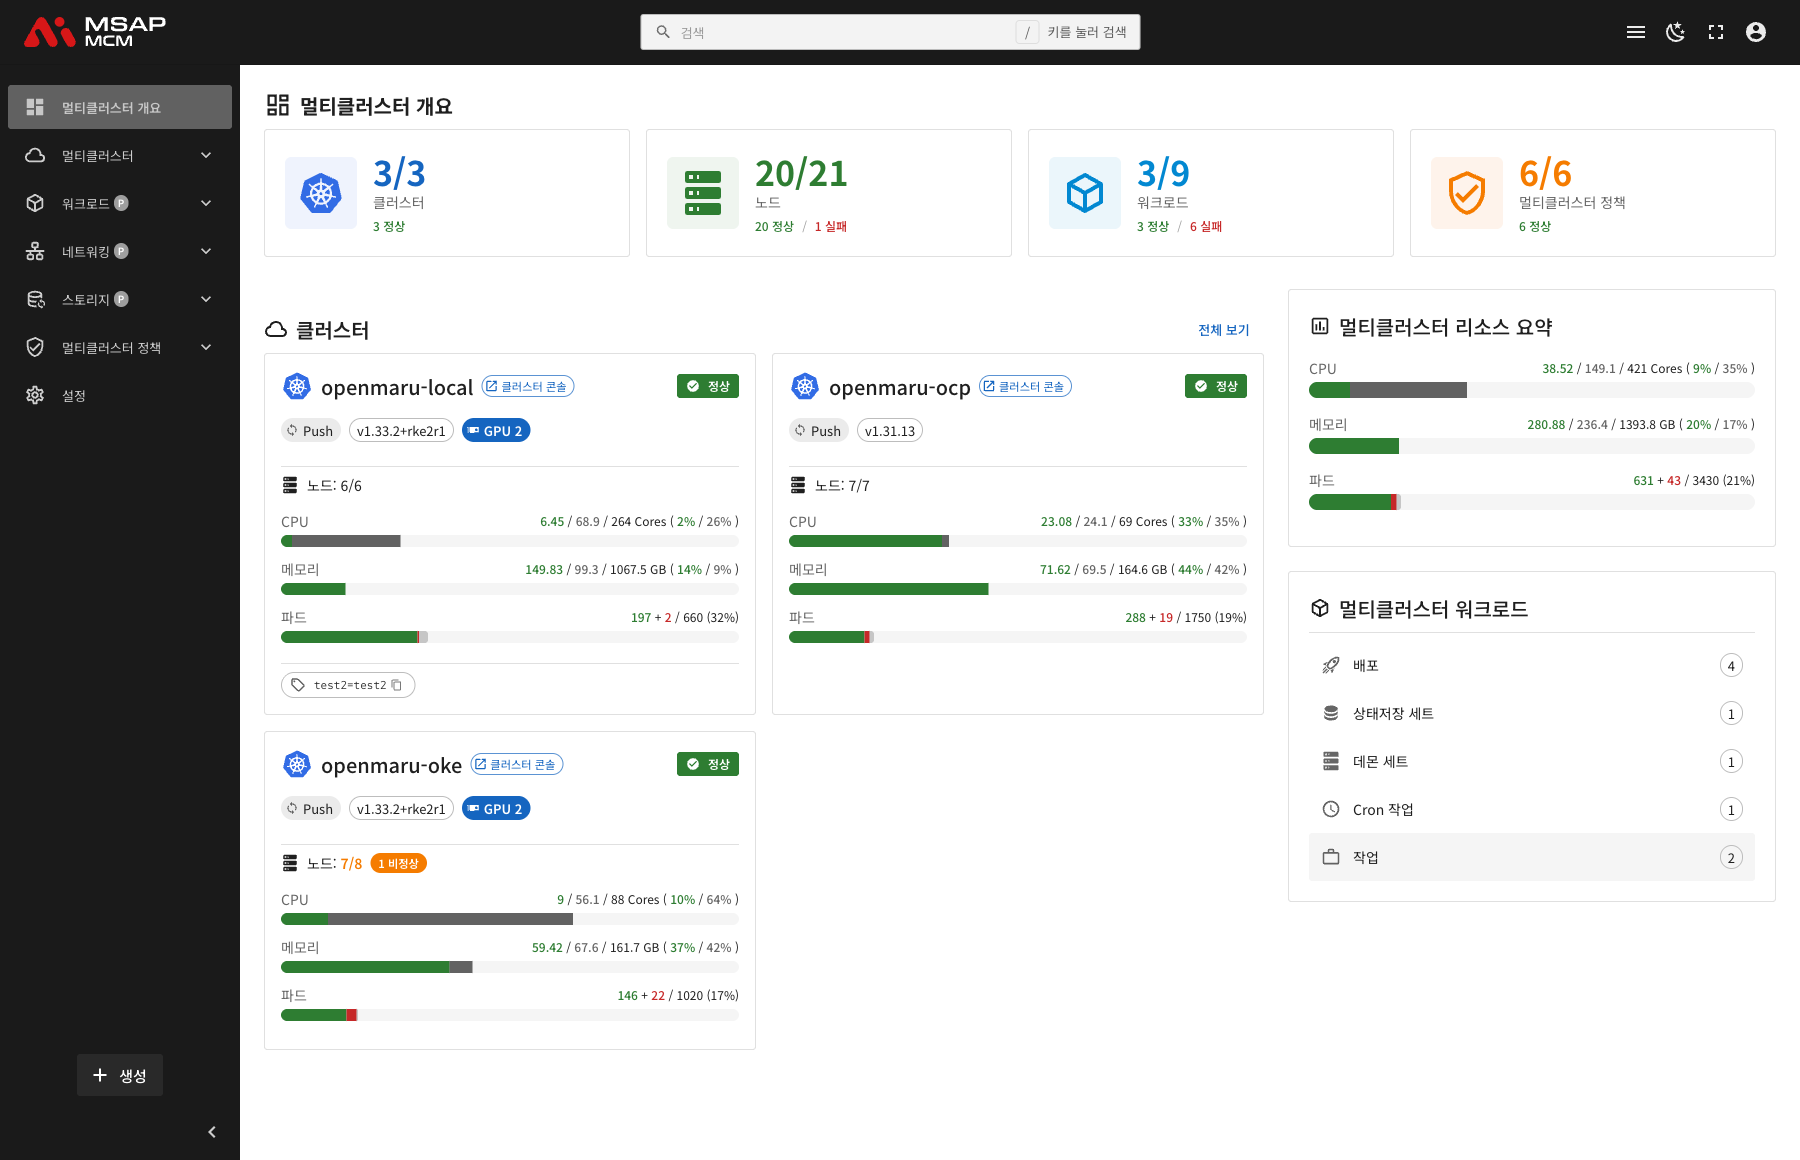
1. Summary Cards
The summary cards at the top of the page show the key measures of the multi-cluster environment.
| Card | Description | What is shown |
|---|---|---|
| Clusters | The state of the registered clusters | Ready / total clusters |
| Nodes | The state of all nodes | Ready / total nodes, and the failed count |
| Workloads | The state of the multi-cluster workloads | Ready / total workloads, and the failed count |
| Multi-Cluster Policies | The state of the propagation policies | The number of policies applied |
How status is shown:
- Green text: a healthy state
- Red text: failed or unhealthy
Note: clicking a card takes you to the detail list page for that resource.
2. Cluster List
Shows the detail of the registered member clusters as cards.
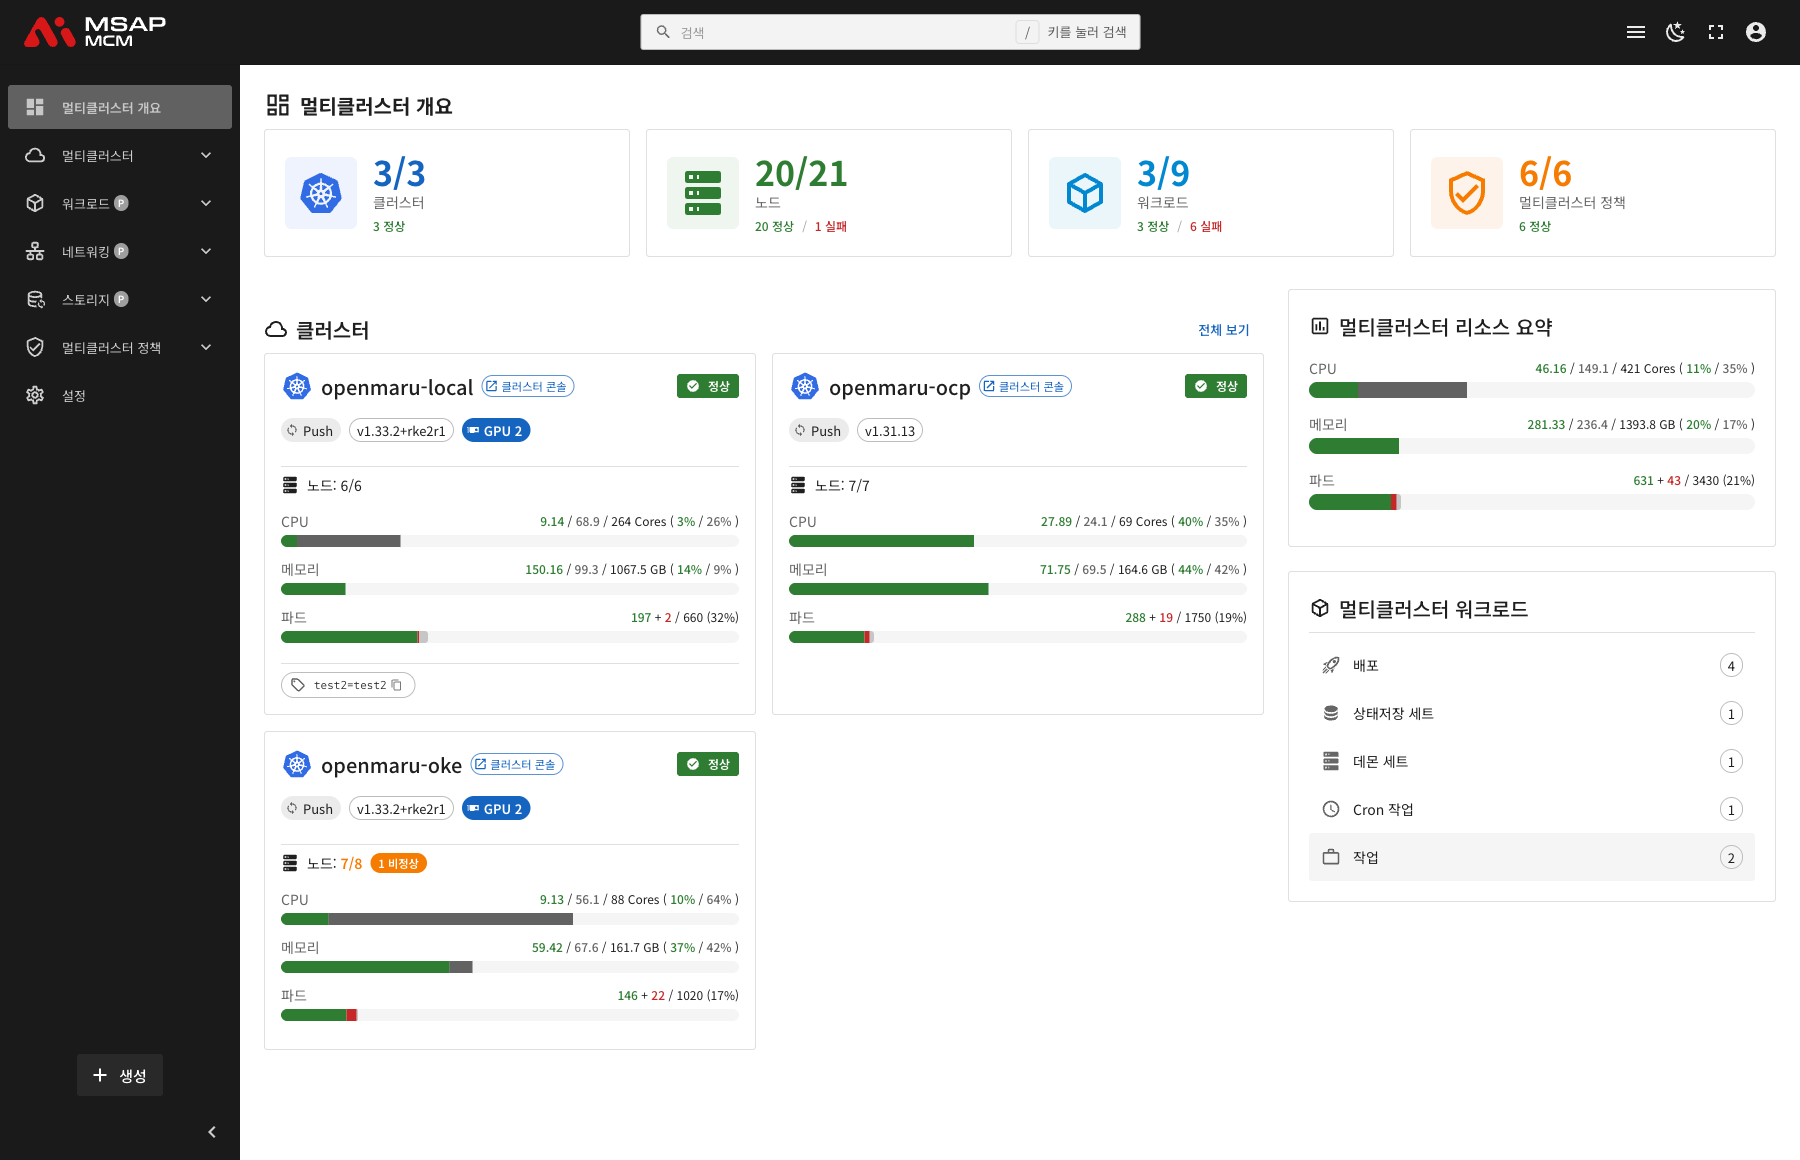
The Parts of a Cluster Card
| Element | Description |
|---|---|
| Cluster Name | The name that identifies the cluster |
| Status badge | Shows Ready or Not Ready |
| Cluster Console button | Goes to that cluster's own management console |
| Sync Mode | Shows Push or Pull mode |
| Kubernetes Version | The cluster's Kubernetes version |
| GPU badge | Shown when the cluster has GPU nodes |
| Node status | Ready / total nodes |
| CPU Usage | Used / requested / allocatable cores |
| Memory Usage | Used / requested / allocatable GB |
| Pods | Current pods / allocatable pods |
| Labels | The labels applied to the cluster |
The format resource usage is shown in:
used / requested / allocatable ( usage% / request% )
For example 7.57 / 68.8 / 264 Cores ( 3% / 26% )
- Actually used: 7.57 cores
- Requested: 68.8 cores
- Allocatable: 264 cores
- Usage 3%, requests 26%
Cluster Card Actions
- Clicking the card: goes to the cluster detail page
- The Cluster Console button: opens that cluster's own management console
- The copy label button: copies the label value to the clipboard
3. Multi-Cluster Resource Summary
Shows the combined resource usage of every cluster.
| Resource | What is shown |
|---|---|
| CPU | The CPU usage and allocation across all clusters |
| Memory | The memory usage and allocation across all clusters |
| Pods | The pod count across all clusters |
The format pods are shown in:
current pods + multi-cluster managed pods / maximum pods (usage%)
For example 628 + 39 / 3430 (20%)
- 628: the member clusters' pods
- 39: the pods Karmada manages
- 3430: the maximum allocatable pods
- 20%: usage
4. Multi-Cluster Workloads
Shows the multi-cluster workloads deployed through MCM.
| Workload type | Description |
|---|---|
| Deployments | The number of multi-cluster Deployments |
| StatefulSets | The number of multi-cluster StatefulSets |
| DaemonSets | The number of multi-cluster DaemonSets |
| CronJobs | The number of multi-cluster CronJobs |
| Jobs | The number of multi-cluster Jobs |
Note: clicking a workload entry takes you to that workload's list page.
Main Features
Live Monitoring
Everything on the Overview page updates live:
- Cluster status changes are reflected at once
- Resource usage is refreshed periodically
- Workload status updates automatically
Quick Navigation
Every card and entry can be clicked to reach a detail page:
- Summary card → the resource list page
- Cluster card → the cluster detail page
- Workload entry → the workload list page
Cluster Console Integration
Pressing the "Cluster Console" button on a cluster card takes you to that cluster's own management console (the OpenShift Console, the Rancher Dashboard, and so on).
Worked Examples
Scenario 1: Checking Cluster Status
- Look at the summary cards at the top of the Overview page
- A red "failed" figure on the Nodes card means there is a problem
- Check the "Not Ready" node count on that cluster's card
- Click the cluster card to reach the detail page
Scenario 2: Checking Capacity
- Check the overall usage in the multi-cluster resource summary
- Where CPU or memory usage is high (80% or more), consider adding capacity
- Compare usage per cluster on the individual cluster cards
Scenario 3: Seeing How Workloads Are Deployed
- Check which workload types are deployed in the multi-cluster workloads section
- Click the workload type you want to reach its list page
- Check the deployment detail and how it is distributed per cluster
Next Steps
- Topology (the topology view) -- visualising the cluster topology
- Clusters (cluster management) -- managing clusters in detail