3.1. Topology (the Topology View)
Overview
The topology map visualises, as a graph, the relationships between the MCM control plane, the member clusters, and the resources deployed on them. In a complex multi-cluster environment it lets you take in at a glance how resources are deployed and how they depend on one another.
What it is for:
- Visualising multi-cluster resource relationships
- Seeing how workloads are deployed
- Checking the reach of a policy
- Analysing dependencies between resources
How the Screen Is Laid Out
The topology map page is laid out as follows.
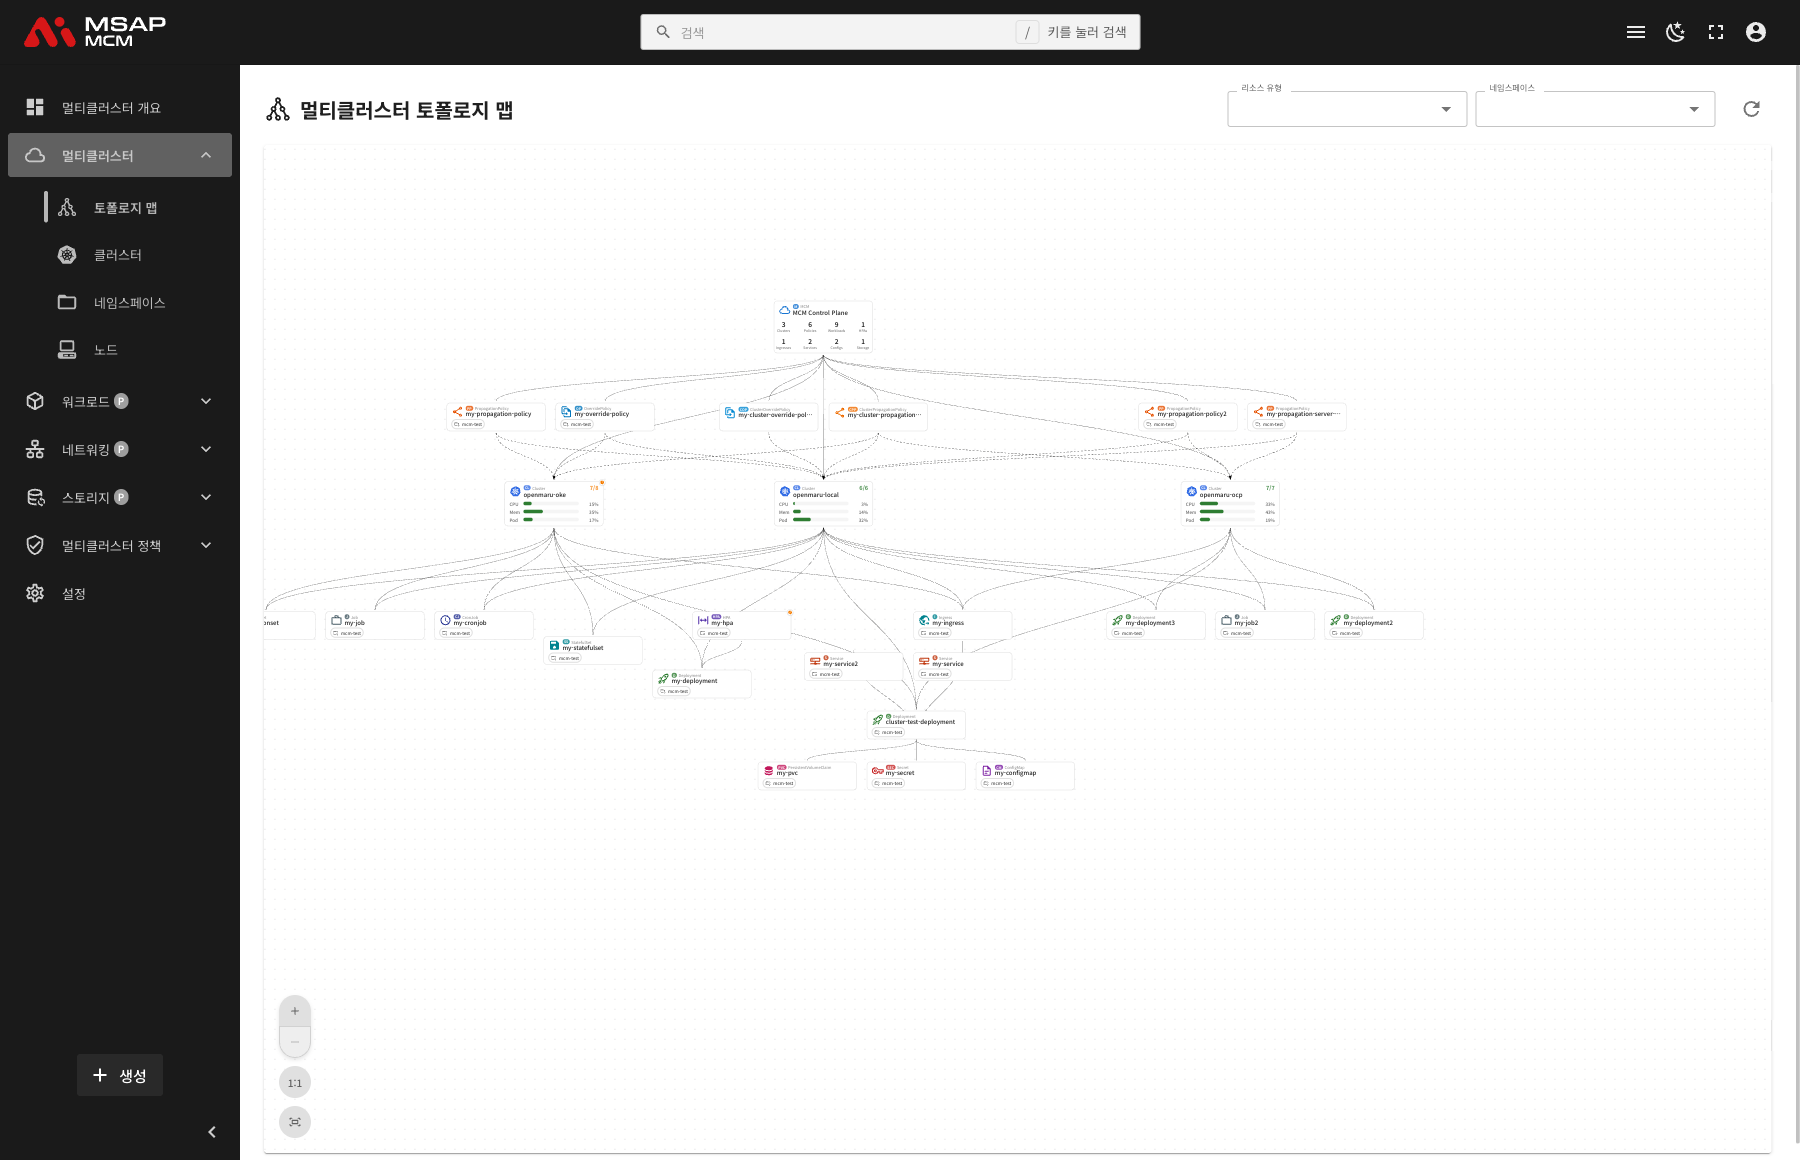
1. The Filter Area
The filters at the top of the page select which resources to show.
| Filter | Description |
|---|---|
| Resource Type | Chooses the kinds of resource to show (Workloads, Networking, Configs, Storage) |
| Namespace | Shows only the resources of a particular namespace |
| Refresh | Refreshes the topology data |
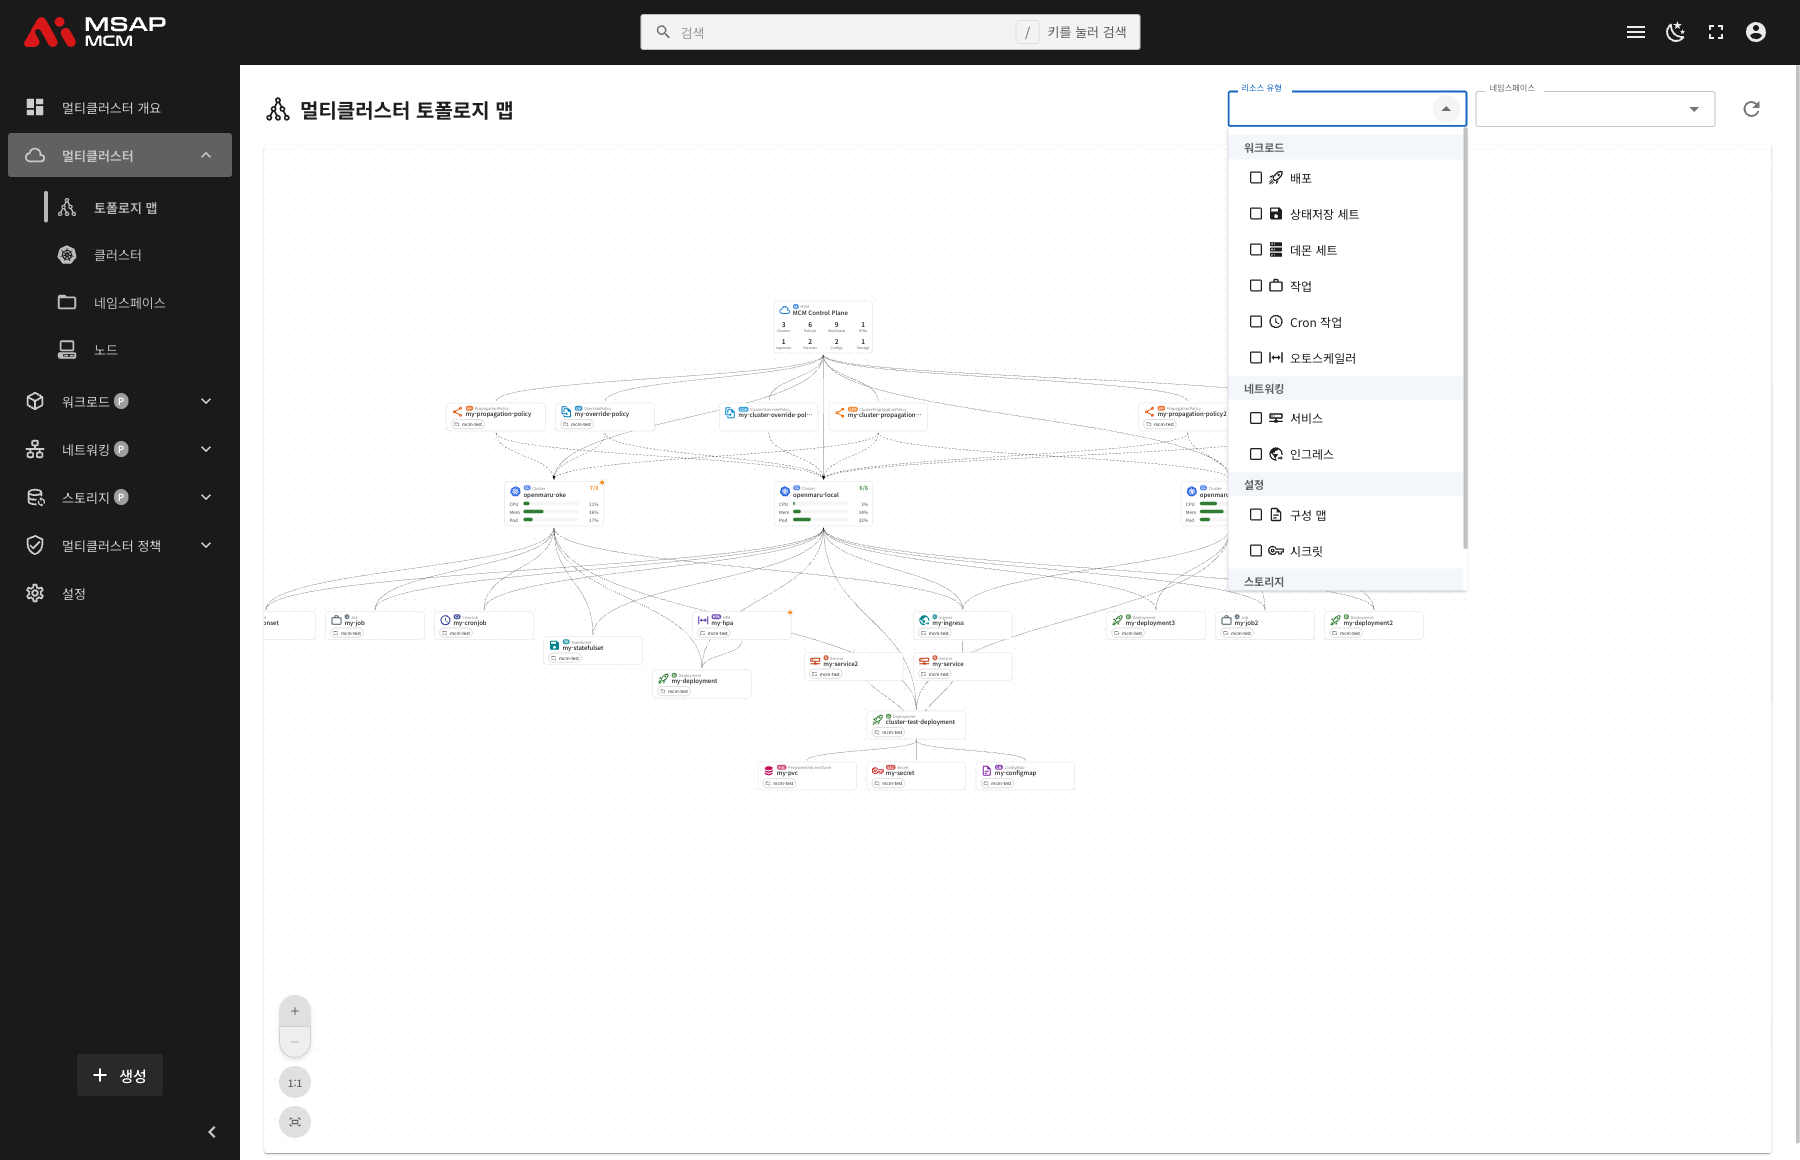
The Resource Type Filter
| Category | Resource types |
|---|---|
| Workloads | Deployment, StatefulSet, DaemonSet, Job, CronJob, Autoscaler (HPA) |
| Networking | Service, Ingress |
| Configs | ConfigMap, Secret |
| Storage | Volume Claim (PVC) |
2. The Topology Graph
The central area shows a graph made of nodes and edges.
Node Types
| Node | Abbreviation | Description | Icon colour |
|---|---|---|---|
| MCM Control Plane | M | The multi-cluster control plane | Red |
| Cluster | CL | A member cluster | Green |
| Deployment | D | A Deployment | Green |
| StatefulSet | SS | A StatefulSet | Green |
| DaemonSet | DS | A DaemonSet | Green |
| Job | J | A Job | Green |
| CronJob | CJ | A CronJob | Green |
| Service | S | A Service | Purple |
| Ingress | I | An Ingress | Purple |
| ConfigMap | CM | A ConfigMap | Blue |
| Secret | SEC | A Secret | Blue |
| PVC | PVC | A PersistentVolumeClaim | Blue |
| HPA | HPA | An autoscaler | Yellow |
| PropagationPolicy | PP | A propagation policy | Red |
| ClusterPropagationPolicy | CPP | A cluster propagation policy | Red |
| OverridePolicy | OP | An override policy | Red |
| ClusterOverridePolicy | COP | A cluster override policy | Red |
Edges (the Connecting Lines)
The lines between nodes show the relationships between resources:
- Control plane → Cluster: the cluster registration
- Control plane → Policy: policy ownership
- Policy → Cluster: the clusters the policy applies to
- Cluster → Workload: where the workload is deployed
- Workload → Service/ConfigMap/Secret/PVC: a resource reference
- Ingress → Service: the ingress routing target
- HPA → Workload: the autoscaling target
The MCM Control Plane Node
The MCM control plane node at the top centre shows a summary of the whole multi-cluster environment:
- Clusters: the number of registered clusters
- Policies: the number of policies applied
- Workloads: the number of workloads deployed
- HPAs: the number of autoscalers
- Ingresses: the number of ingresses
- Services: the number of services
- Configs: the number of config resources (ConfigMap plus Secret)
- Storage: the number of storage resources
Cluster Nodes
Each cluster node shows:
- The cluster name
- The node status (ready / total)
- CPU usage
- Memory usage
- Pod usage
3. The Zoom Controls
The zoom controls at the bottom left of the screen zoom the graph in and out.
| Button | What it does |
|---|---|
| + | Zoom in |
| - | Zoom out |
| 1:1 | Zoom to 100% |
| Fit to screen | Adjusts so the whole graph fits the screen |
The Detail Panel
Clicking a node on the topology graph opens the detail panel on the right.
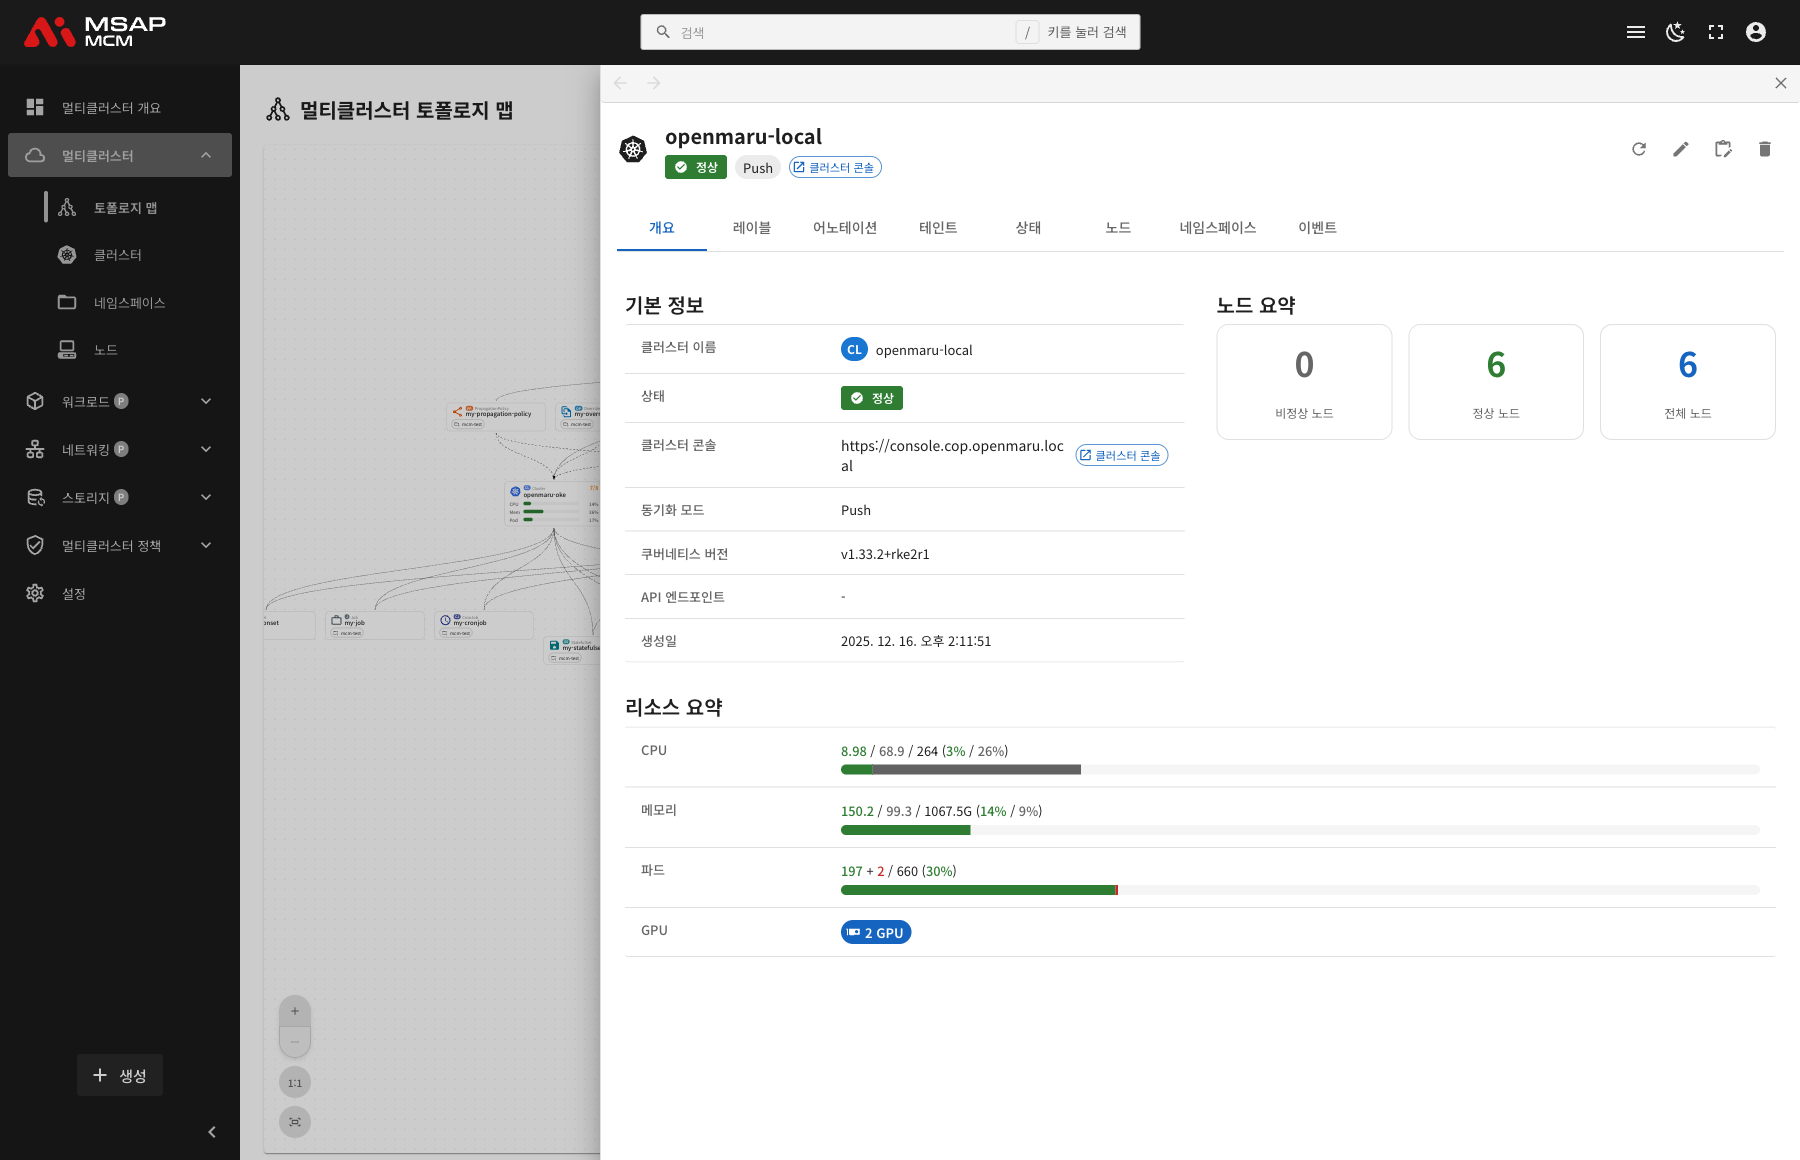
How the Panel Is Laid Out
| Area | Description |
|---|---|
| Header | The resource name, its status, and the quick action buttons |
| Tabs | Overview, Labels, Annotations, Status, Events, and so on |
| Detail | The content of the chosen tab |
Cluster Detail
What is shown when a cluster node is clicked:
| Tab | Content |
|---|---|
| Overview | Basic information, the node summary, the resource summary |
| Labels | The labels applied to the cluster |
| Annotations | The cluster annotations |
| Taints | The cluster taint settings |
| Status | The cluster status conditions |
| Nodes | The list of nodes in the cluster |
| Namespaces | The list of namespaces in the cluster |
| Events | The related Kubernetes events |
The Panel Action Buttons
| Button | What it does |
|---|---|
| Refresh | Refreshes the resource information |
| Edit | Opens the YAML edit mode |
| Edit cluster | Edits the cluster settings (clusters only) |
| Delete | Deletes the resource |
| Cluster Console | Opens that cluster's management console (clusters only) |
Main Features
Interactive Exploration
- Drag: drag the graph area to move it
- Scroll: zoom in and out with the mouse wheel
- Click: click a node for its detail
- Hover: hovering over a node highlights it
Tracing Resource Relationships
The topology map lets you check:
- Which clusters a particular workload is deployed on
- Which policy applies to which clusters
- The ConfigMaps, Secrets, and PVCs a workload references
- The routing relationship between services and ingresses
Focused Analysis Through Filters
Using the filters to show only one kind of resource lets you focus on what you want even in a complex environment.
Worked Examples
Scenario 1: Checking Where a Workload Is Deployed
- Find the workload node you want on the topology map
- Look at the edges from that node to clusters
- The connected clusters are where the workload is deployed
Scenario 2: Checking the Reach of a Policy
- Find the policy node (PP, CPP, OP, COP)
- Look at the edges from the policy to clusters
- The connected clusters are what the policy applies to
Scenario 3: Analysing Service Dependencies
- Choose "Services" and "Ingress" in the resource type filter
- Check the workloads connected to a service
- Check the routing path from an ingress to a service
Scenario 4: A Quick Look at Cluster Status
- Check the CPU, memory, and pod usage on the cluster nodes
- Identify clusters with not-ready nodes (from the node status shown)
- Click the cluster node for its detail
Next Steps
- Clusters (cluster management) -- managing clusters in detail
- Namespaces -- namespace management