R6. Settings Reference
Diátaxis: Reference (a dictionary to look things up in) · Audience: administrators -- apart from Guide & Downloads, the submenus under Settings are visible only to accounts with administrator permission ← Back to contents
This sets out what each screen under the left menu Settings covers. For the screens with a great many items (Monitoring Settings), only the tab and group structure is described, with a link to a separate reference for the detail of each key.
The Settings menu at a glance (left menu ▸ Settings) -- only Guide & Downloads is visible to every user; the rest are visible only to accounts with administrator permission.
| Menu path | Purpose |
|---|---|
| Settings ▸ Agent Status | Agent connections and versions → H20 |
| Settings ▸ Monitoring Settings | The collection, threshold, alert channel, and other environment settings |
| Settings ▸ APM Server | The state of the APM server and cluster |
| Settings ▸ Data Management | Data retention and cleanup |
| Settings ▸ Transaction Index | Checking the state of the query index |
| Settings ▸ Licenses | Registering licence keys and their position |
| Settings ▸ Guide & Downloads | Downloading agents and documents |
Users, groups, and application groups (Access Management) are covered in H18 and H19.
Monitoring Settings (Settings ▸ Monitoring Settings)
This configures server alerts and monitoring behaviour generally. There are a great many items, so they are split into tabs → groups.
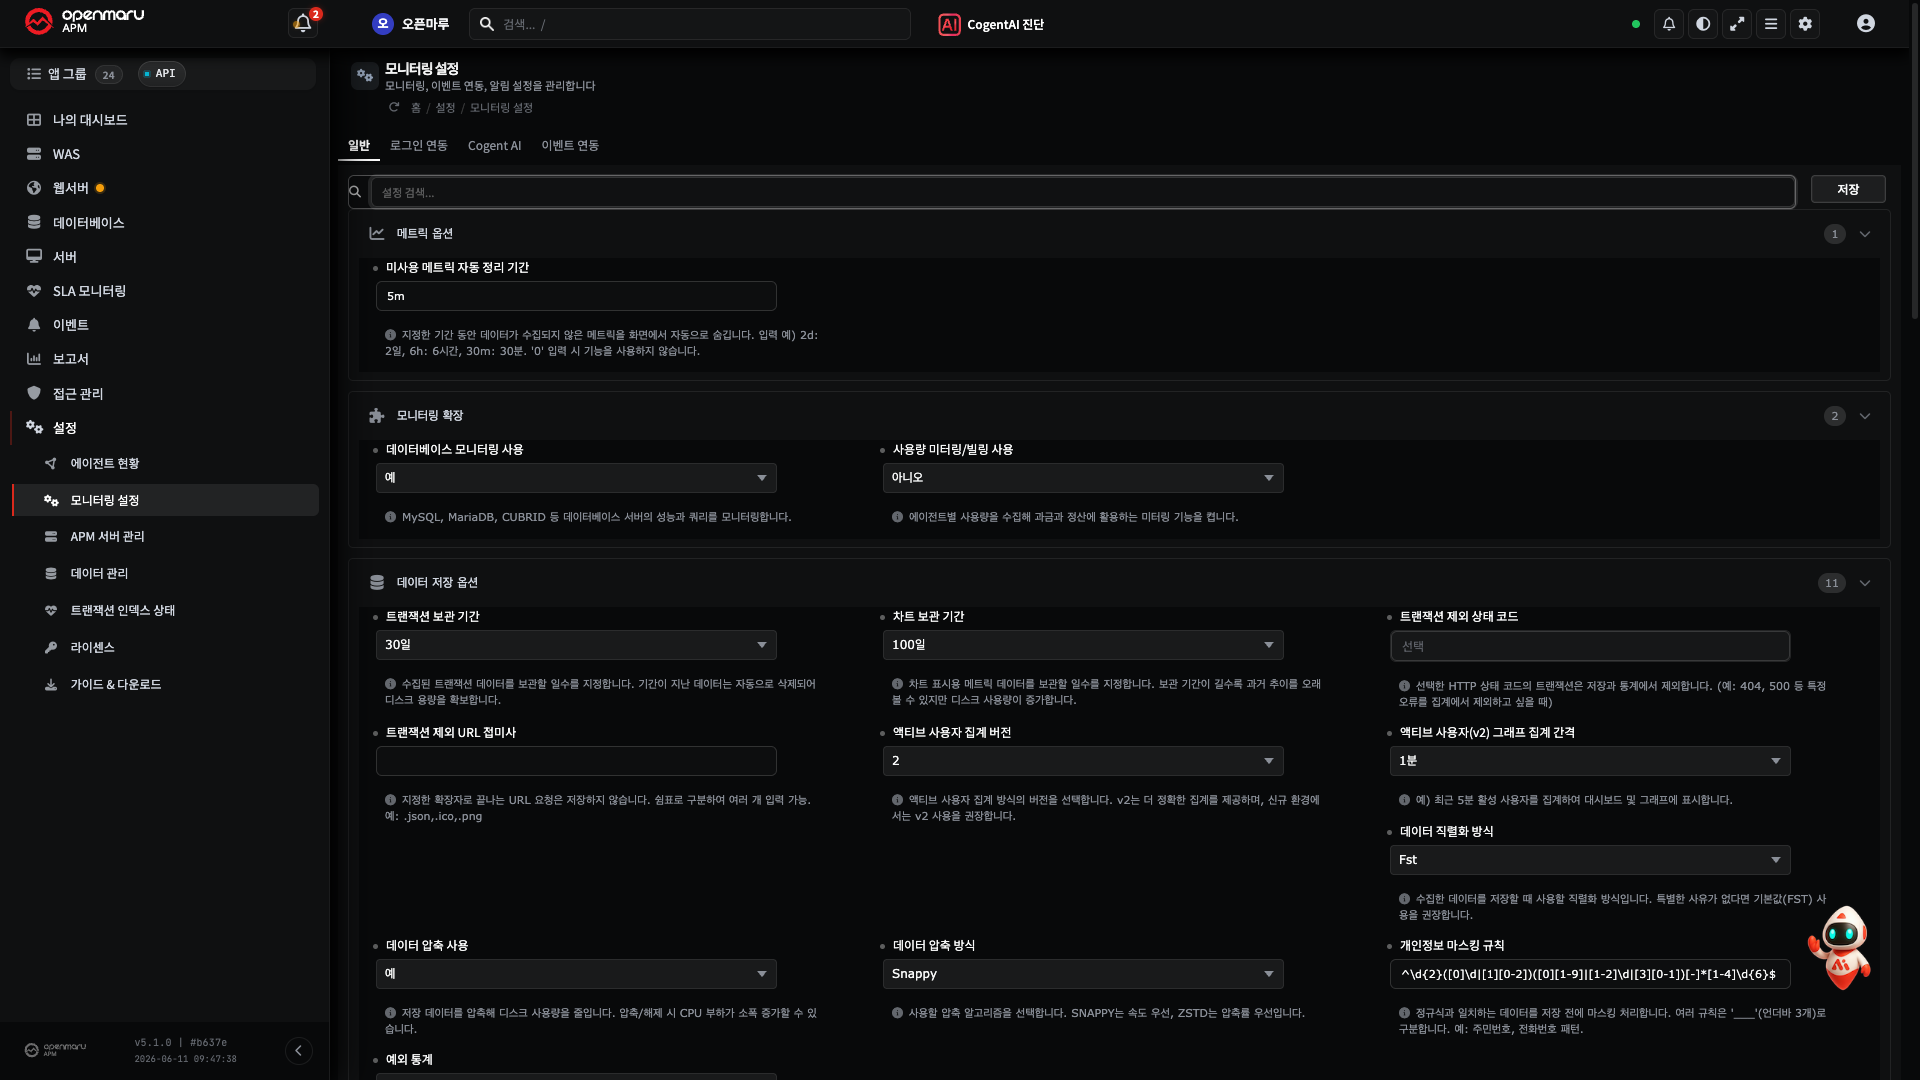
| Tab | Groups (examples) |
|---|---|
| General | Metric options · monitoring extensions (plugins) · data storage options · Excel report options · control options · dashboard options · general options |
| Sign-in Integration | LDAP · OIDC |
| Cogent AI | Whether AI diagnosis is used, and so on (the on/off for the H14 features) |
| Event Channels | Default settings · Mail · Slack · SMS · Synology Chat · MS Teams |
- The Event Channels tab is where the routes for sending alerts (email, Slack, and so on) are registered -- the "channel" in an alert policy points at a channel configured here (H15).
- Excel report options decides things such as the display language of automatically generated reports (R5).
Note The detailed meaning, format, and default of each of the 170 or so individual settings keys are gathered in the internal reference
docs-plan/data/settings/MONITORING_SETTINGS_REFERENCE.md. This manual covers only the tab and group structure.
APM Server (Settings ▸ APM Server)
This shows the state of the APM server itself and the cluster configuration. (Not a monitored target -- the server of the APM product.)
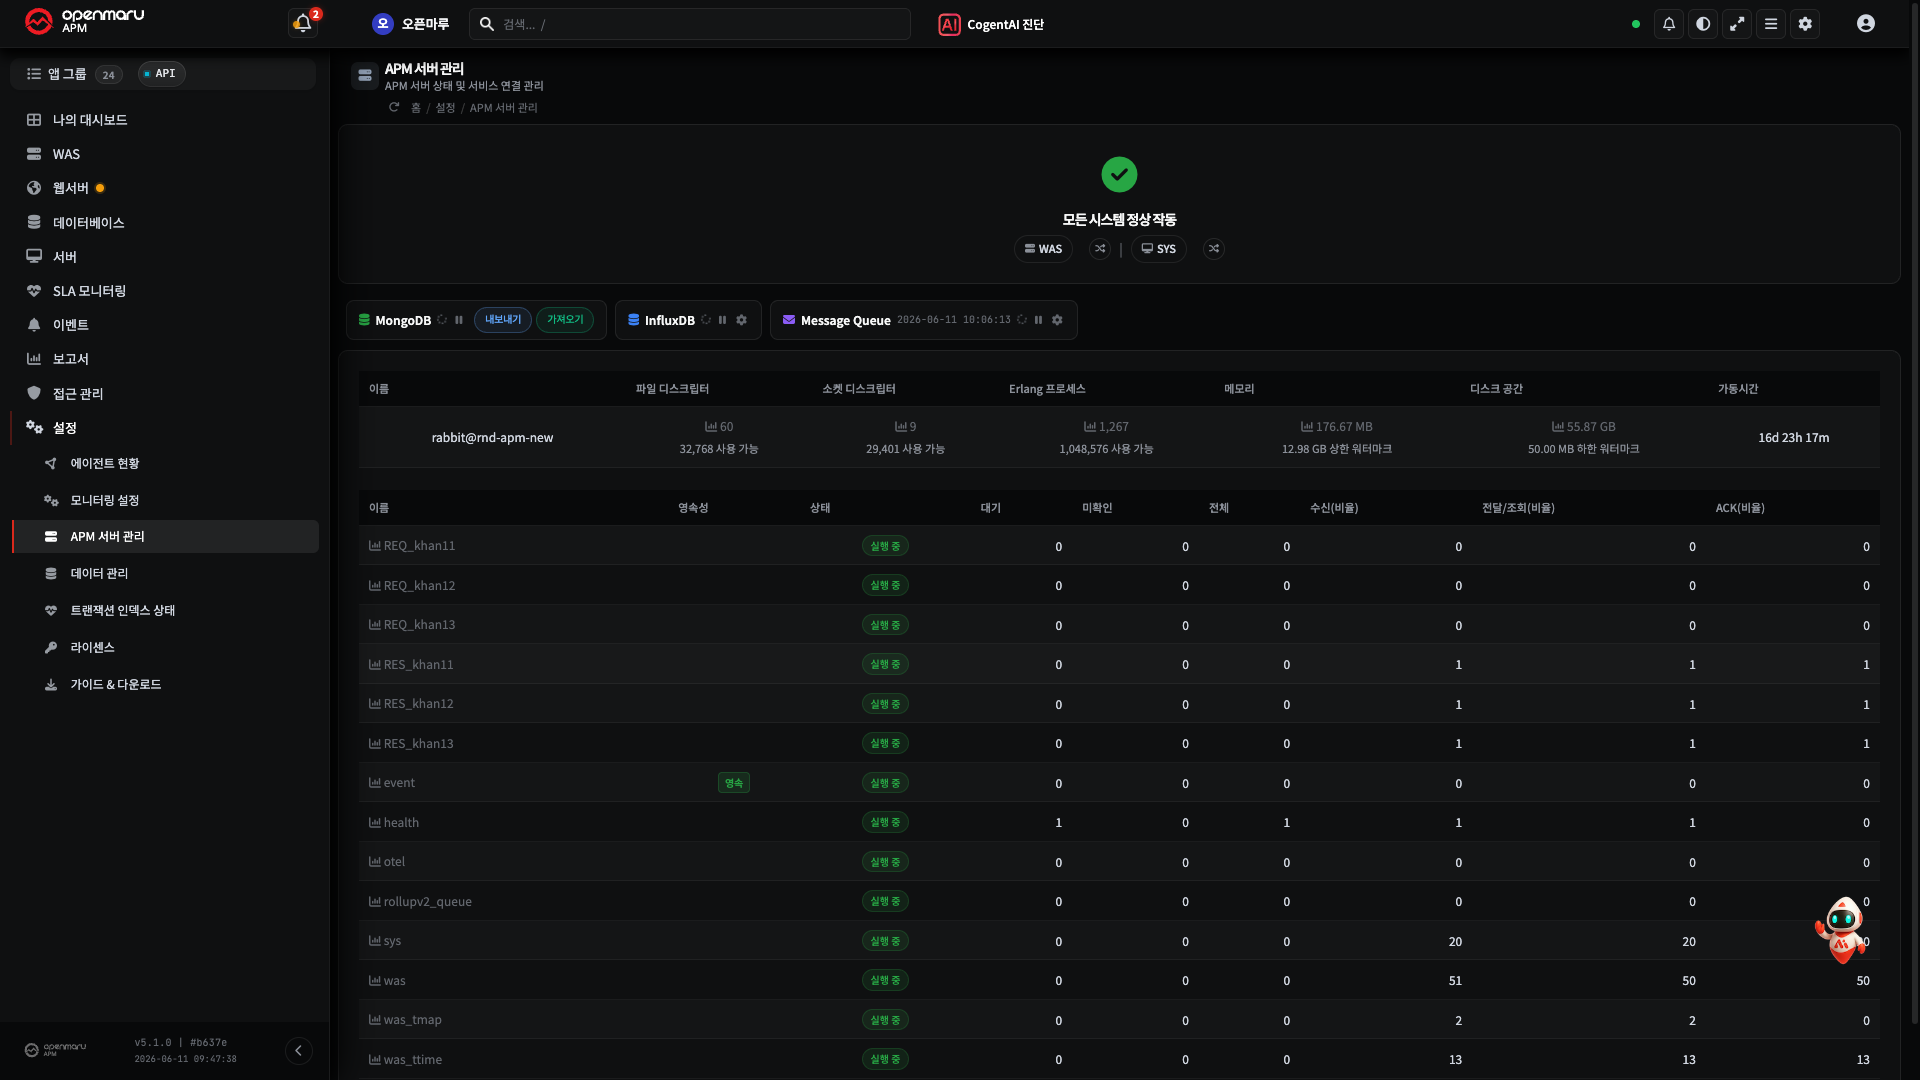
- When running as a cluster, the node composition and state are visible at a glance.
Data Management (Settings ▸ Data Management)
This manages the retention and cleanup of the collected monitoring data.
- Old data is cleaned up according to the retention period and cleanup policy.
- Export data: downloads the data for the chosen items as a JSON file, for moving to another APM server or for backup.
- Disk usage display: a disk usage bar for the collection server is shown at the top of the screen. It separates the space used by MongoDB from everything else, so you can judge how much headroom cleanup actually frees up.
- Automatic disk usage management: if the disk is predicted to fill up within the next few days, the oldest transaction detail data is automatically cleaned up first to prevent usage from reaching 100%. This can happen even while the retention period set above has not yet elapsed, if disk space is running low. Manual cleanup can only be run by an administrator.
For related events (usage warning, auto-cleaned, cleanup limit reached), see R3 -- Licences, Policies, Security, and Other.
Transaction Index Health (Settings ▸ Transaction Index)
This checks whether the index that governs transaction query performance is healthy.
- It shows the index state (last 7 days) and whether any index is missing.
- A missing index can make transaction queries slow, and the system attempts to repair it automatically (the related event: R3 -- Transaction and Database Problems).
Licenses (Settings ▸ Licenses)
This registers and manages the product licence keys and shows their position.
| State | Meaning |
|---|---|
| Valid | The licence is in order |
| Expiring soon | Expiry is close (renewal needed) |
| Expired | The validity period has passed |
| Unverified / invalid | A key or target mismatch, and so on |
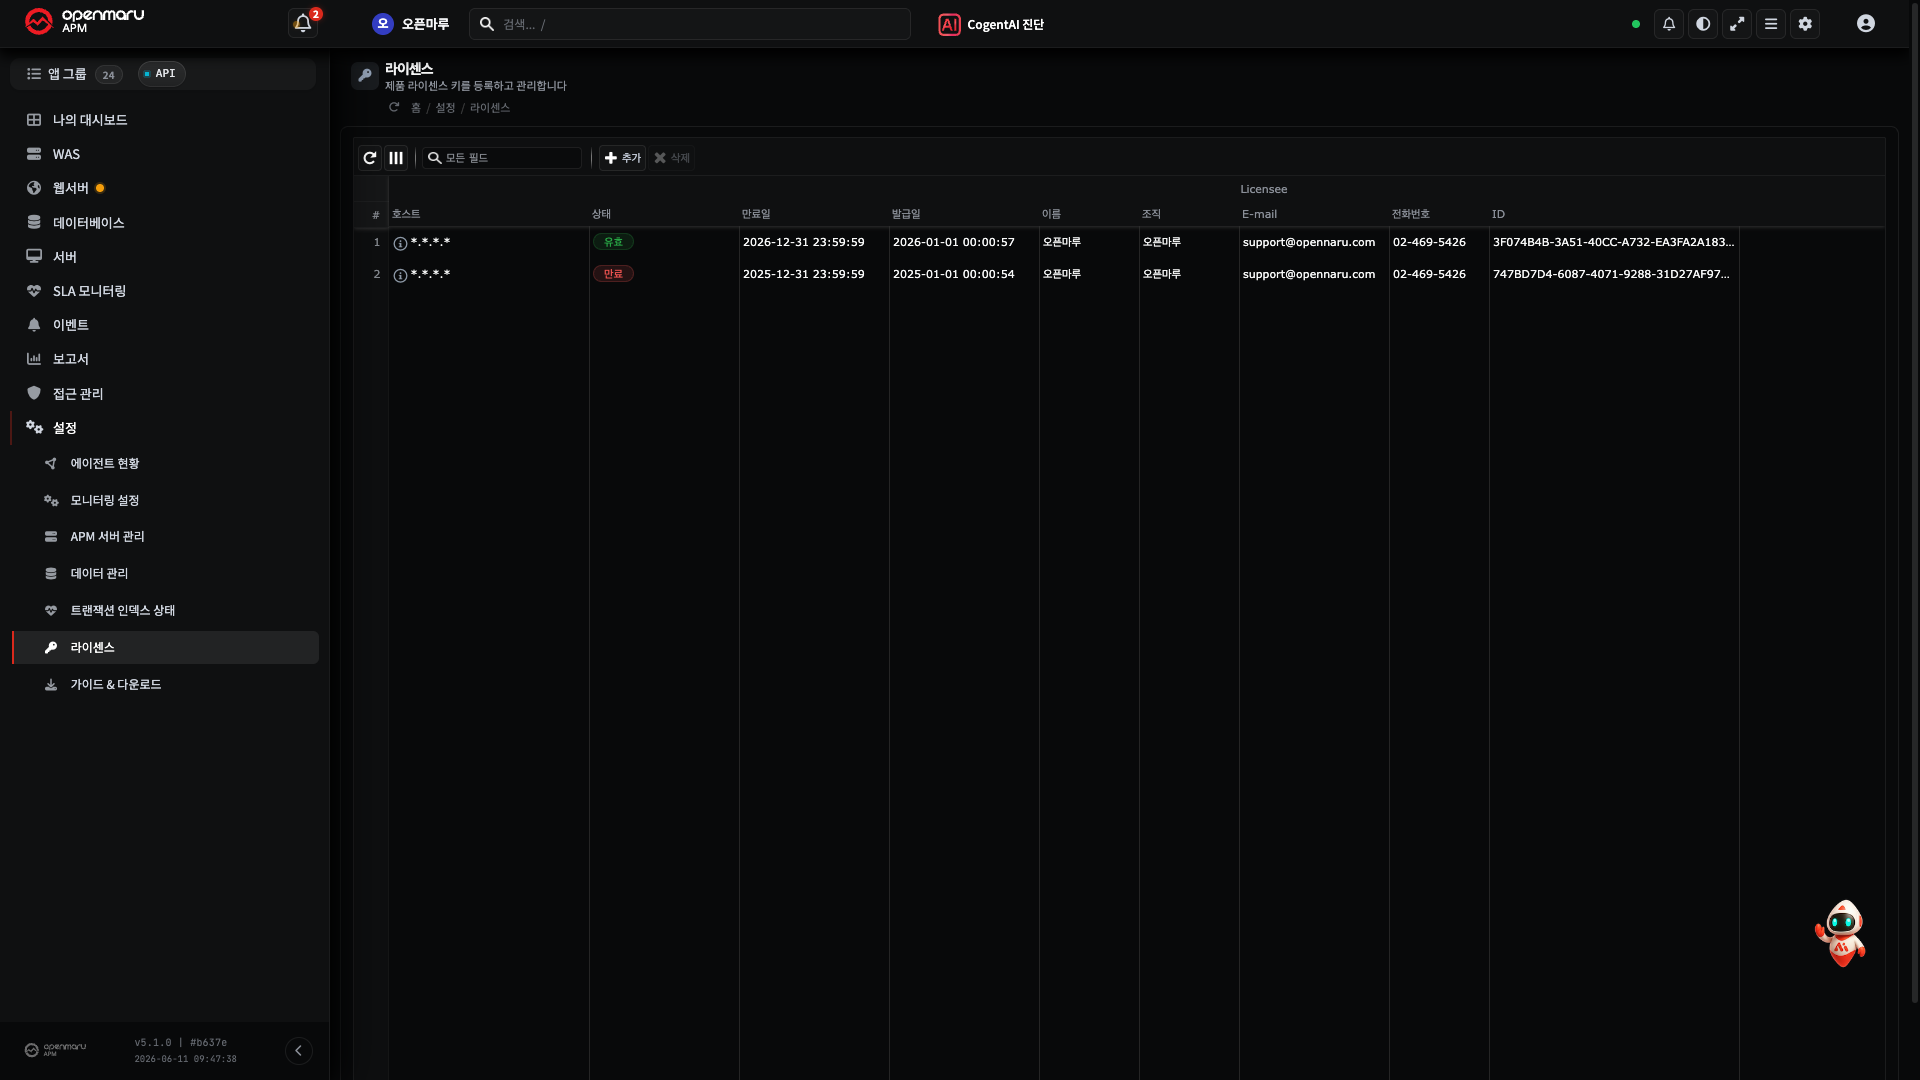
For the related events (expiry, imminent expiry, errors), see R3 -- Licences, Policies, Security, and Other.
Guide & Downloads (Settings ▸ Guide & Downloads)
The screen for downloading the agent installation files and documents (the user manual and so on).
- Get them here when installing an agent anew or bringing versions into line (when H20 reveals a version mismatch).
Related Documents
- H18. Users, Groups, and Permissions · H19. Application Groups -- access management
- H20. Checking Agent Status · H15. Alert Policies
- R3. Event Reference · R5. Kinds of Report
- R1. Screen Map -- the whole Settings menu