5.1. Incidents
The alerts raised automatically when an SLO (service level objective) is breached or a system anomaly is detected, and the analysis of their root cause.
Overview
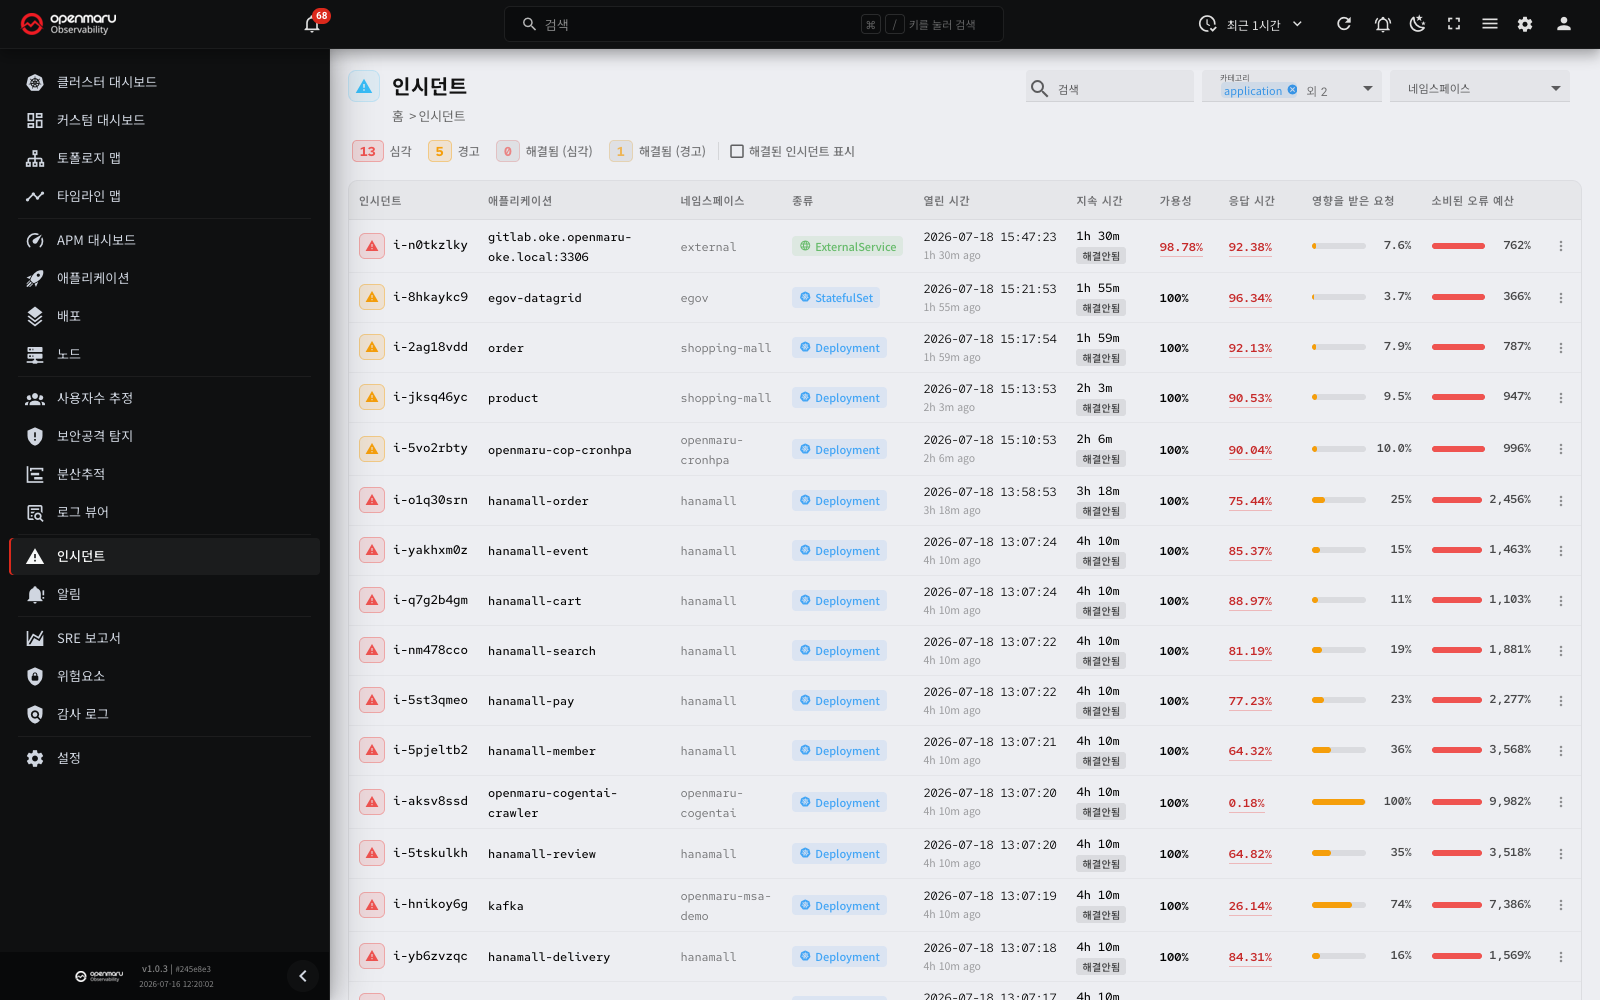
The Incidents menu shows every incident OPENMARU Observability detected automatically. An incident is an alert raised when a service level objective (SLO) is breached or an application anomaly is detected.
On this screen you can look at both ongoing and resolved incidents and check each one's severity, duration, the proportion of requests affected and how much of the error budget it consumed. Click an incident to open its detail page, where root cause analysis (RCA) helps you establish why it happened.
Screen layout
The Incidents page is made up of the following areas.
- Top header: the application filters
- Status summary strip: incident counts by severity, and the option to show resolved incidents
- Incident list table: every incident, with its SLO impact
Main features
Reading the status summary strip

The status summary strip at the top of the screen gives the incident count per severity at a glance.
| State | Meaning |
|---|---|
| Critical | Incidents needing immediate action |
| Warning | Incidents needing attention |
| Resolved (Critical) | Incidents resolved from a critical state |
| Resolved (Warning) | Incidents resolved from a warning state |
Click an entry to filter the list to incidents in that state. Click again to clear the filter.
Tip: clicking Critical gets you quickly to the incidents that need an immediate response.
Showing resolved incidents
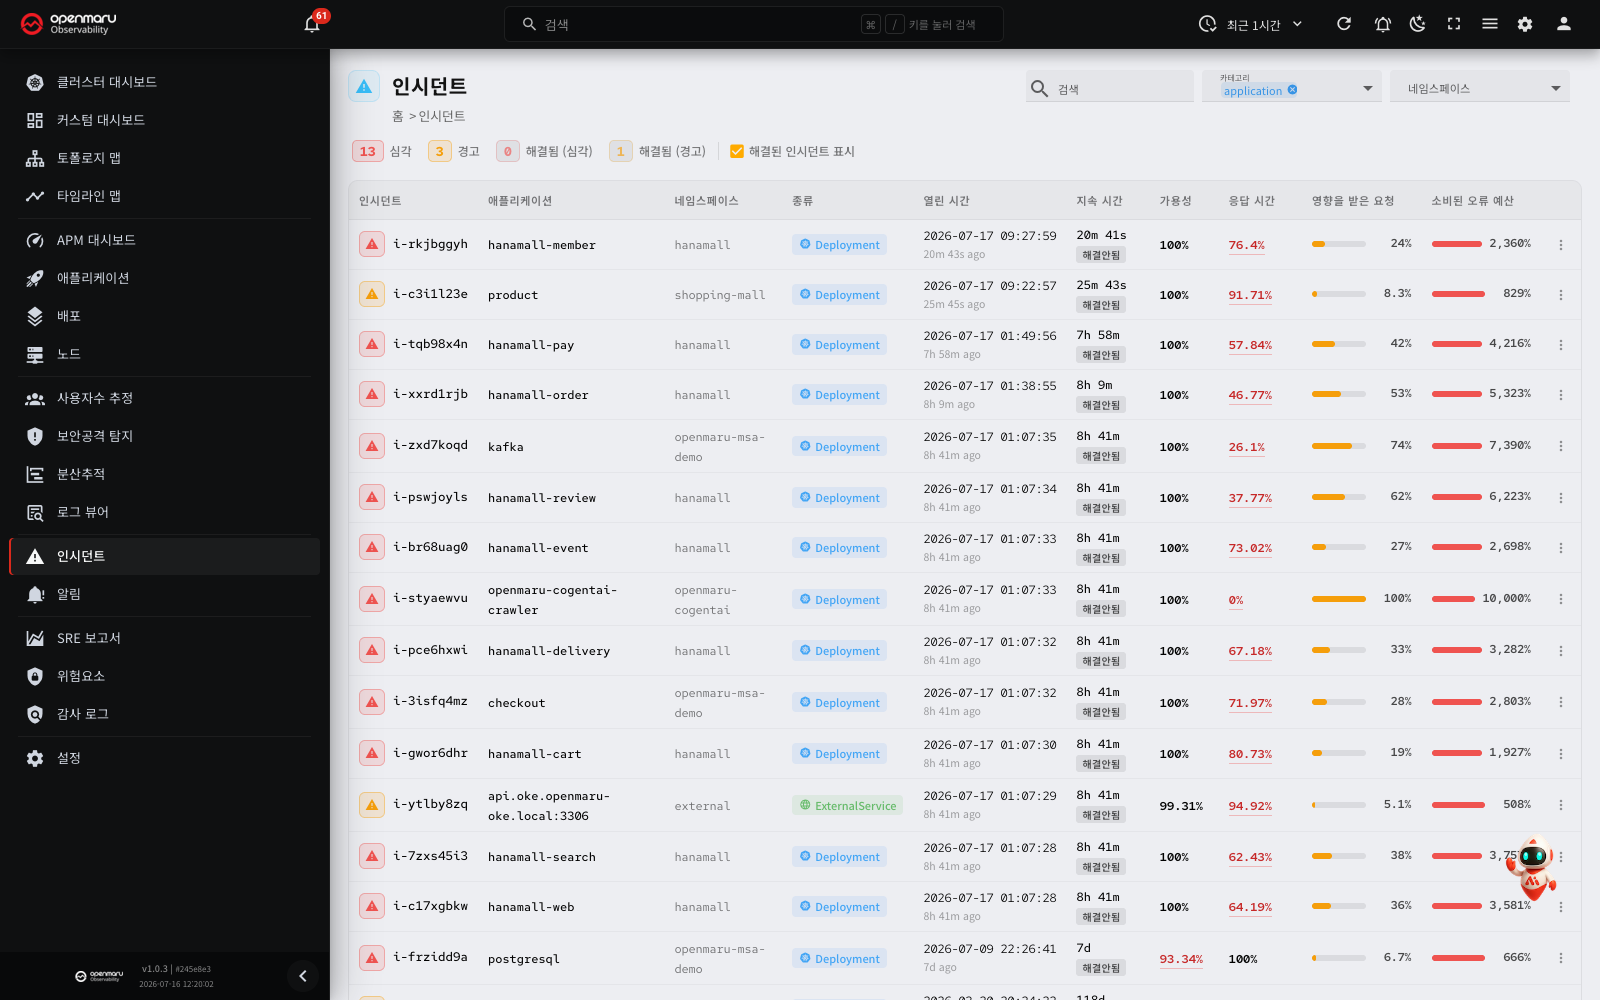
By default only ongoing (unresolved) incidents are shown. Tick Show resolved to include resolved ones as well.
Resolved incidents appear translucent in the list, with a Resolved badge in the duration column.
Note: the show-resolved setting is saved in the browser, so your last choice persists into your next visit.
Incidents are resolved after the incident resolve hold
When the SLO status of an application returns to normal, the server does not resolve the incident at once. The server waits for a set time (the incident resolve hold) and then resolves the incident. This feature decreases the number of times that the same failure resolves and opens an incident again, and the notifications sent each time.
| Item | Behaviour |
|---|---|
| Default | 5 minutes (300 seconds). The maximum is 3600 seconds. |
| Set to 0 | The hold is off. The server resolves the incident at the evaluation where the SLO status becomes normal. |
| Start of the count | The evaluation time when the SLO status returned to normal |
| The SLO is breached again during the hold | The same incident continues. No new incident opens and no notification is sent. When the status returns to normal again, the count starts again. If the severity changes, only the severity changes and a notification is sent. |
| The SLO stays normal for the full hold | The server resolves the incident and sends the resolve notification. |
| Recorded resolve time | The time when the SLO status returned to normal |
- During the hold, the incident stays Open in the list, although the SLO status is normal. Thus you get the resolve notification after the SLO becomes normal and the hold time passes.
- If the SLO status cannot be evaluated during the hold because there is no data, the server resolves the incident when the hold time passes.
- The hold does not apply to the automatic resolve in "Incidents of removed workloads" below.
Each project has one hold value. Change it on the Incident resolve hold card of the Settings > Notifications tab. For details, refer to the "Incident resolve hold" section in Settings. This value is a different setting from Keep firing for (seconds) of an alerting rule. The section "Timing: For duration and Keep firing for" below gives the differences.
Incidents of removed workloads are resolved automatically
When you delete a Deployment, StatefulSet or DaemonSet from Kubernetes, the incidents of that application change to Resolved automatically within about 1 hour. They are not resolved at once, because the collected data of the last hour still contains the application.
- An automatic resolve does not send a resolve notification to the alert channels (Slack, MS Teams, email, Webhook).
- If you deploy again with the same name and a problem occurs again, a new incident opens.
- If collection from a cluster stops for more than 1 hour, the incidents of the workloads in that cluster can be resolved without a notification.
These incidents are not resolved automatically.
| Case | Result |
|---|---|
| Calls to an external service (ExternalService) stop | The incident stays Open. |
| The pods run but the application gets no requests | The incident stays Open. It is removed from the list by the rule below. |
Note: the incident list has no manual resolve menu. You can resolve manually only for an alert in the Alerts menu.
Old incidents are removed automatically
The server removes old incidents once a day. The rule uses the metric cache retention period of the server (cache-ttl, default 60 days).
The charts on the incident detail screen use this data.
| Incident state | When (retention period - 1 day) has passed since it opened |
|---|---|
| Resolved | Removed. |
| Open, and the application is in error now | Kept. |
| Open, and there are no requests to evaluate or the application is gone | Removed. |
With the default setting (60-day retention), incidents that opened about 59 days ago are removed. If the retention period is 1 day or less, incidents are not removed. The detail screen of a kept incident shows the data of the last 6 hours. Refer to the section Detail screen of an old incident below.
Alert history uses a different rule. A resolved alert is removed when (retention period + 2 days) has passed since it was resolved. Unresolved alerts are not removed.
Note: if you open a removed incident from a link in an alert channel message, the screen shows "failed to get incident" and goes back to the incident list.
To keep history longer, increase the cache retention setting of the server (cache-ttl, environment variable CACHE_TTL). You cannot change this value on the screen.
A longer retention period needs more metric storage.
Application filters

Use the application filters at the top right of the page to show incidents for particular applications or namespaces only. You can also search by incident ID or keyword to find one quickly.
The incident list table
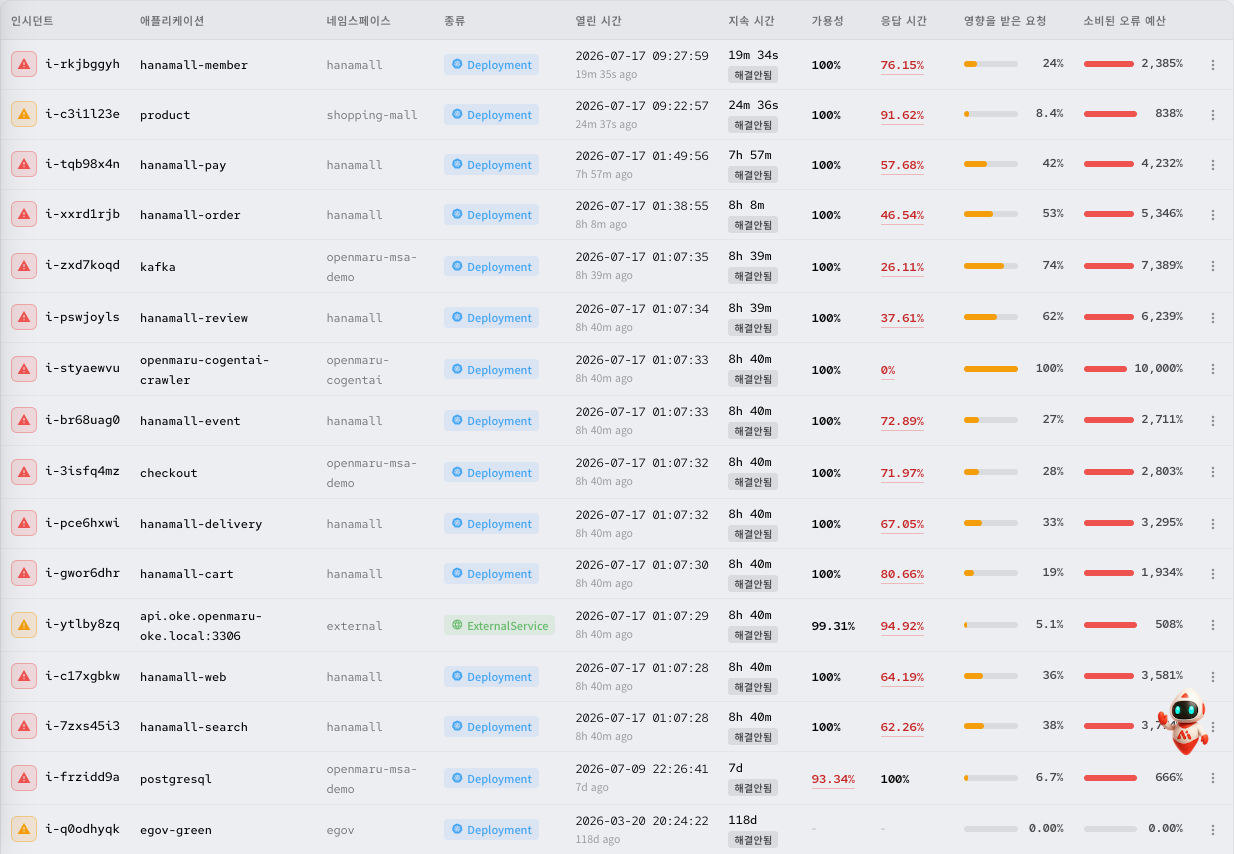
The incident list table carries the following.
| Column | Description |
|---|---|
| Incident | The incident ID (for example i-123), coloured by severity. |
| Application | The application the incident occurred on |
| Namespace | The namespace the application belongs to |
| Kind | The Kubernetes workload kind (Deployment, StatefulSet and so on), or ExternalService |
| Opened at | When the incident was first detected, and how long ago |
| Duration | How long the incident lasted. Ongoing incidents get an Open badge, finished ones a Resolved badge |
| Availability | The availability SLO compliance rate. A breach is highlighted in red. |
| Latency | The latency SLO compliance rate. A breach is highlighted in red. |
| Affected requests | The proportion of requests the incident affected (as a bar) |
| Consumed error budget | How much of the error budget was consumed (as a bar). Above 100% it turns red. |
Note: the Availability, Latency, Affected requests and Consumed error budget values come from further analysis of the incident data, so a spinner may appear while they load.
Click a column header to sort by it, ascending or descending.
Adjusting SLOs
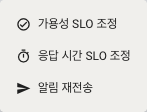
Click the more (...) button at the right of an incident row to adjust that application's SLO thresholds quickly.
- Adjust Availability SLO: change the availability SLO threshold
- Adjust Latency SLO: change the latency SLO threshold
- Resend notification: resends the notification (shown for unresolved incidents only).
Note: an SLO threshold adjustment applies to that application only. Change the defaults for everything under Settings > Inspections.
Incident details
Click an incident ID or an application name in the list to open that incident's detail page.
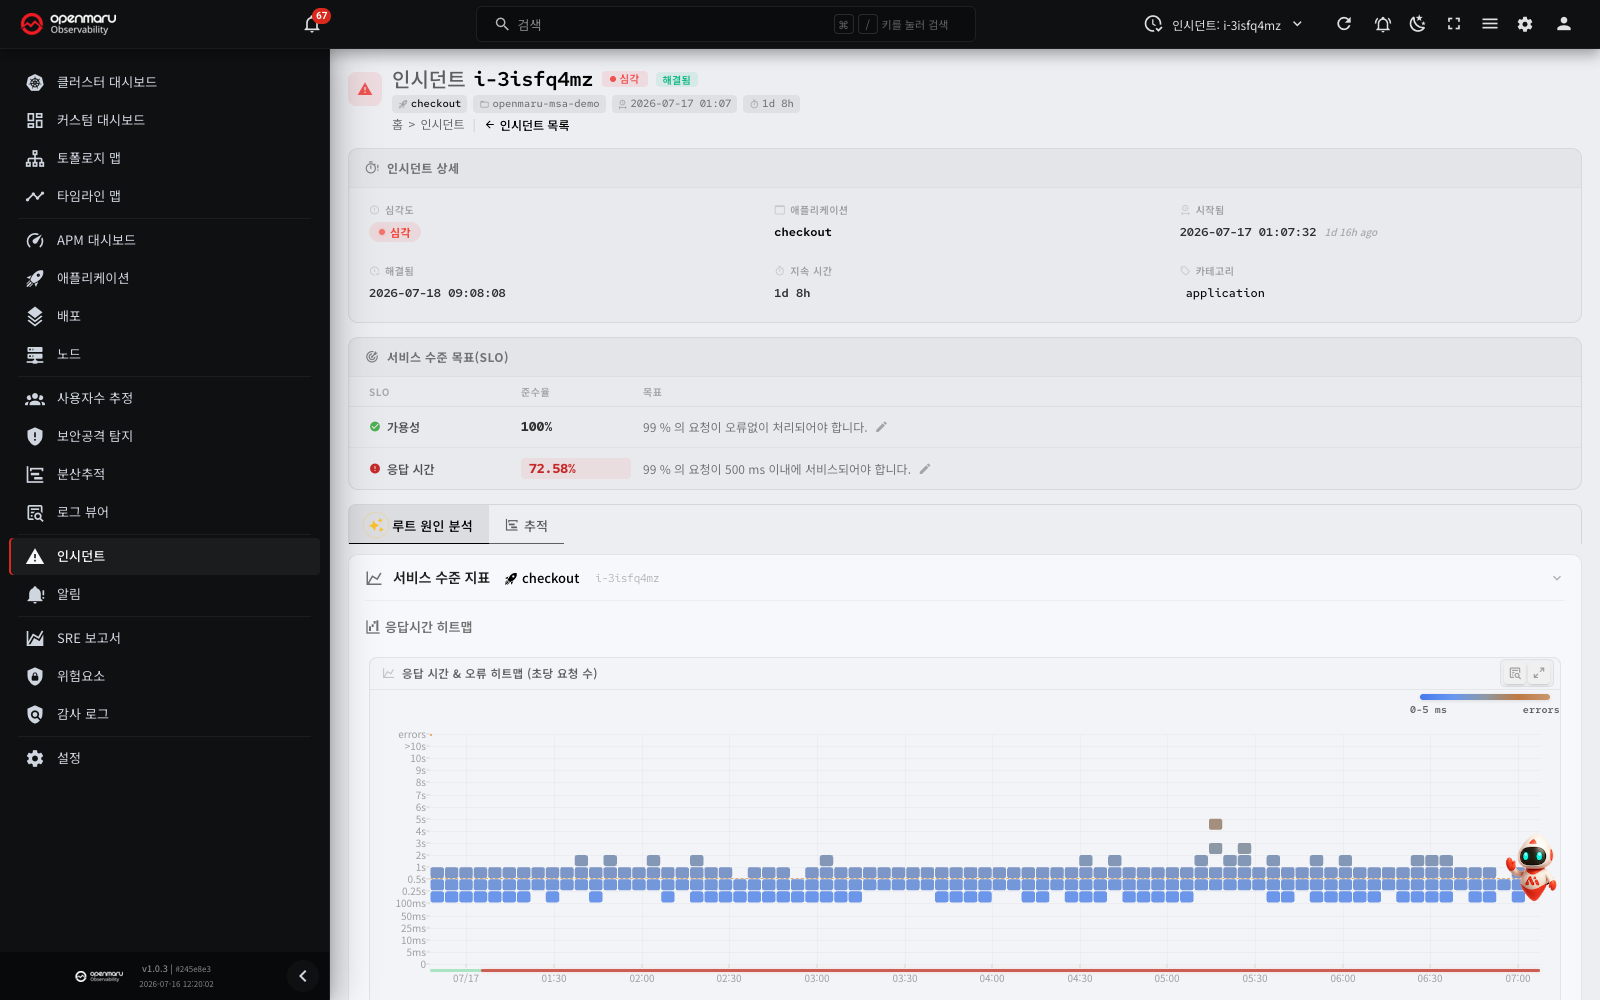
Header information

The top of the detail page carries the following.
- Incident ID: a unique identifier prefixed with
i- - Severity badge: Critical or Warning
- State badge: Still Open while it continues, Resolved once it has finished
- Metadata: application name, namespace, start time, duration
Click the Incidents List link to return to the incident list page.
Detail screen of an old incident
An incident stays in the list if its application is in error now, even when the data from its open time is past the retention period. The top of the detail screen of such an incident shows this message.
"Ongoing since 2026-07-21 13:53. Data from when it opened has passed the retention period, so the charts, affected requests and consumed error budget show the last 6 hours."
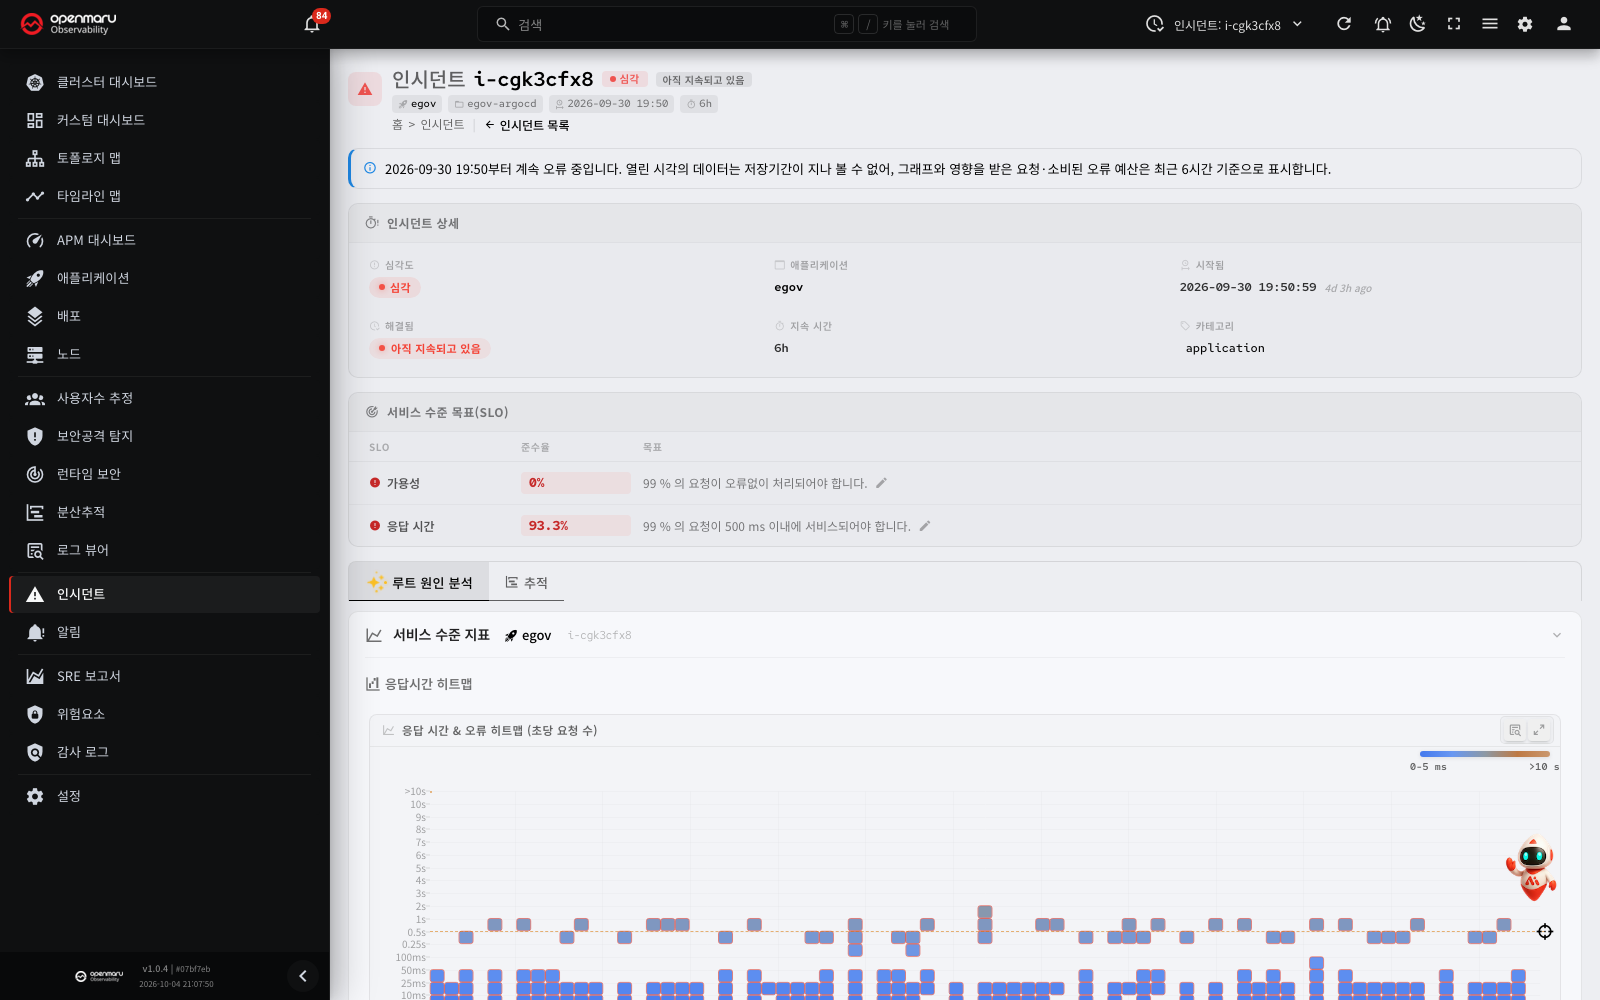
| Item | Time basis |
|---|---|
| Opened at and Duration in the list, start time in the detail | The original open time |
| Charts (including the SLO heatmap), the root cause analysis tab | The last 6 hours |
| Availability, Latency, Affected requests, Consumed error budget (list and detail) | The last 6 hours |
The same message also shows in the incident window that you open from the timeline map.
Incident details

The Incident Details section lays out the incident's basic properties as a grid.
| Item | Description |
|---|---|
| Severity | Critical or Warning, as a coloured badge. |
| Application | The application affected. Click it to open that application's detail dialog. |
| Started | When the incident was first detected, and how long ago |
| Resolved | The resolution time, or the Still Open state |
| Duration | The total duration of the incident |
| Category | The application category. Click it to open that application's detail page. |
Service level objectives (SLO) section

The Service Level Objective(SLO) section shows which SLO the incident occurred on, as a table.
| Column | Description |
|---|---|
| SLO | The SLO's name (Availability or Latency). It carries a green check or a red warning icon depending on whether it was breached. |
| Compliance | The actual SLO compliance rate. A breach is highlighted in red. |
| Objective | The SLO target (for example "99 % of requests should be served faster than 500 ms"). Click the pencil icon to edit the SLO threshold directly. |
Analysis tabs

Two analysis tabs sit at the bottom of the incident detail page.
| Tab | Description |
|---|---|
| root cause analysis (RCA) | The system's automatic analysis of the incident's cause. Selected by default. |
| traces | Trace data from the period the incident covered |
The RCA (root cause analysis) tab
The RCA tab is selected by default on the incident detail page and shows the system's automatic analysis of why the incident happened. It has five sections. You can collapse and expand four of them: SLI, propagation path, causal timeline and detailed report. You cannot collapse the root cause analysis summary.
1. Service level indicators (SLI) section
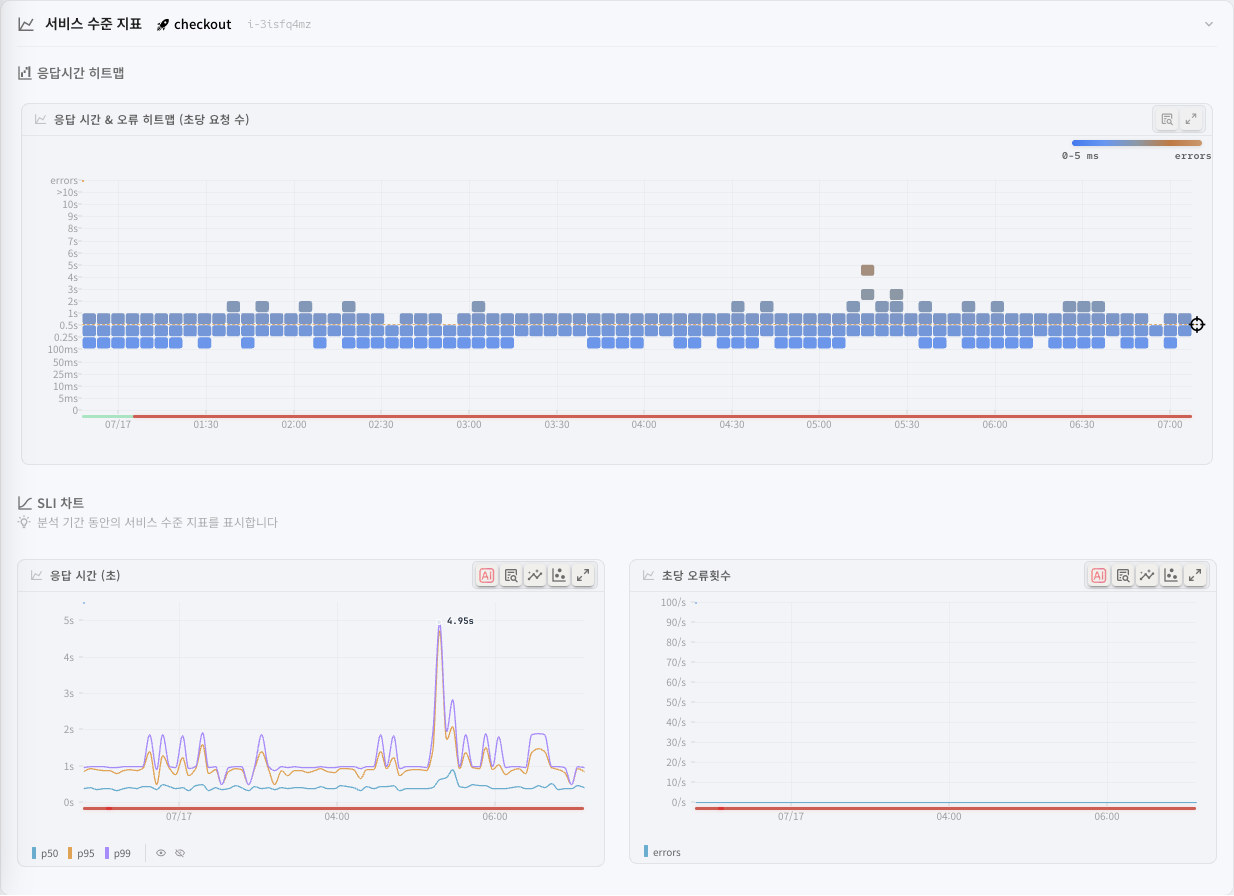
The Service Level Indicators (SLI) section charts the state of the service over the incident's analysis period. The section header carries the target application's name and the incident ID.
It contains two sub-areas.
The latency heatmap
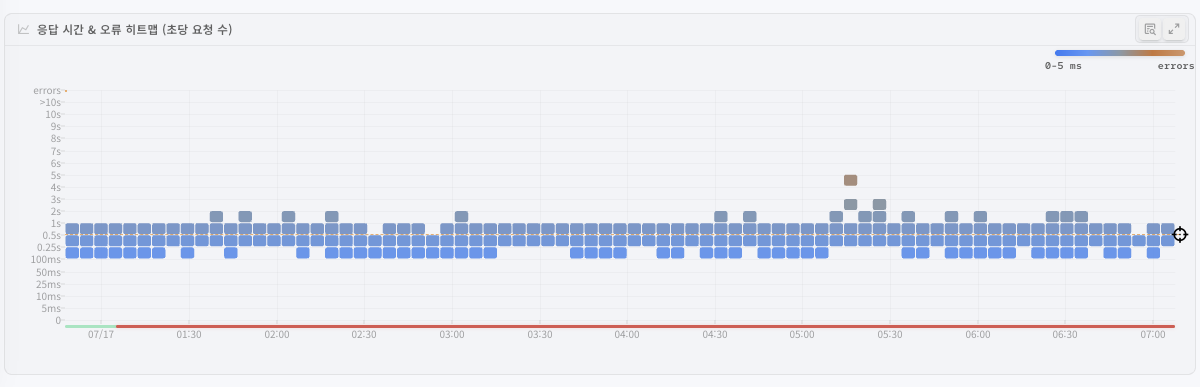
The Latency Heatmap visualises the distribution of response times over the incident period. The X axis is time, the Y axis is response time, and colour intensity is the density of requests in that cell.
The heatmap shows only the requests that the application received. This is the same data that the SLO compliance uses. To see the calls that the application sent (for example DB queries), use the Outbound only filter on the Tracing tab.
The time width of one cell depends on the query period.
| Query period | Cell width |
|---|---|
| 1 hour or less | 15 seconds |
| More than 1 hour | 1 minute |
| More than 6 hours | 5 minutes |
The query period starts 20 minutes before the incident started. It ends at the latest 6 hours after the incident started. Thus the query period is approximately 6 hours 20 minutes at most, and the cell width is one of the three values above.
When you drag a region on the heatmap, the Tracing tab of the application detail dialog opens with the Inbound only filter. The selected range starts at the start of the first cell and ends at the end of the last cell. Short received requests, such as health checks, also show in the Inbound only filter.
The SLI charts
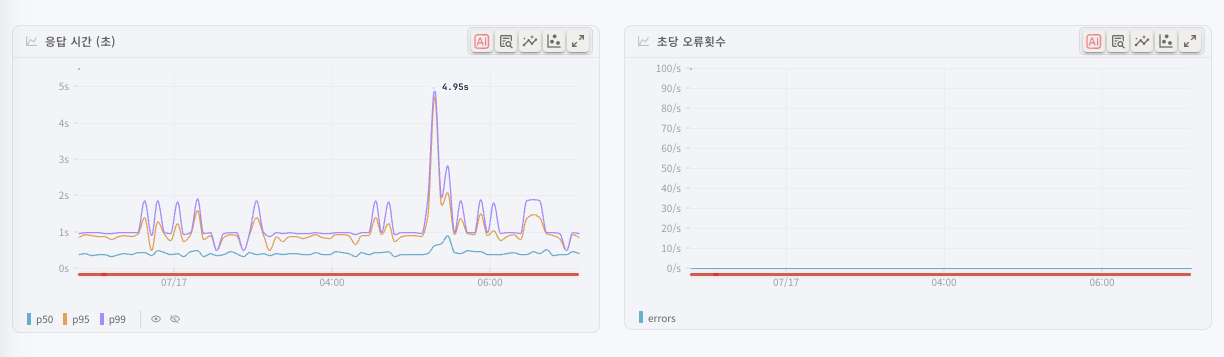
The SLI Charts area shows a response time chart and an error rate chart side by side. They show how the service's performance moved over the analysis period.
- Latency, seconds chart: how request response times trended over the analysis period
- Errors, per second chart: how errors trended over the analysis period
A note below the charts reads "Charts show service level indicators during the analysis window".
Tip: drag to select a period on the SLI charts and you get a detailed analysis of it (an RCA confined to that time range). The selected period is highlighted on the chart.
2. Root cause analysis summary

The Root Cause Analysis card summarises the system's automatic analysis of the incident's cause. It has three parts.
Findings by severity
Badges at the top right of the card give the number of findings by severity.
| Badge | Meaning |
|---|---|
| Critical | Findings needing immediate action |
| Warning | Findings needing attention |
| N findings | The total number of findings |
The estimated root cause

The most likely cause of the incident is shown in a highlighted Probable Root Cause card, containing the following.
- Cause title: what is believed to be the root cause (a deployment change, resource saturation, an upstream failure, and so on)
- Application name: the application the root cause occurred on
- Description: further explanation of the cause (the deployment at a particular time, an error count, and so on)
Categorisation
The findings are grouped into the following categories and shown as chips, each carrying that category's finding count.
| Category | Description |
|---|---|
| Deployment | Causes relating to deployment changes (a new version, a rollout event) |
| Upstream | An upstream service's failure or SLO breach affecting this service |
| Resource | Causes relating to resource saturation (CPU, memory, disk) |
| Log | Causes relating to anomalous log patterns |
| SLO | Another service's SLO breach affecting this one in a chain |
| Database | Database-related issues |
3. Issue propagation path
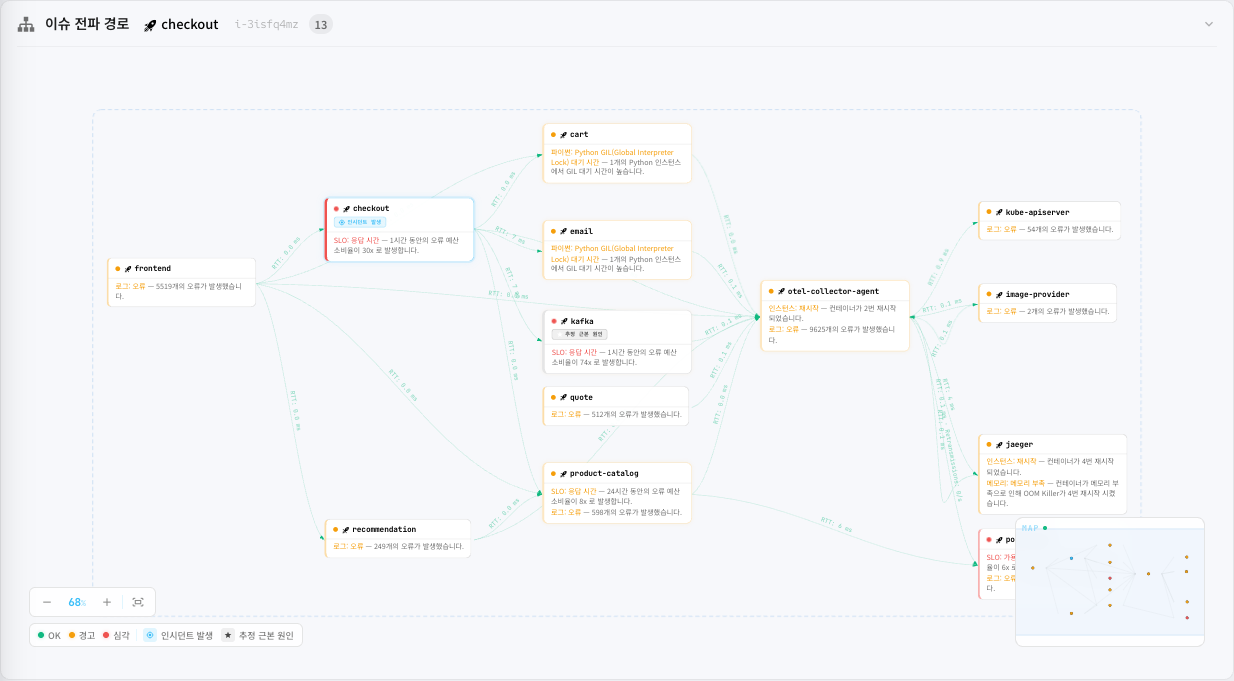
Where an incident affected several applications, this visualises the path the failure propagated along as a service dependency map. The section header gives the number of applications involved.
Reading the propagation path
- Nodes (applications): each rectangle is one application. The node's border colour is that application's state (red: critical, yellow: warning, green: healthy).
- Arrows (connections): the direction of traffic between applications. The arrow's colour is that connection's state. Connections in a critical or warning state carry a flow animation.
- Incident marker: the application the incident occurred on (the target application) carries a crosshair icon.
- Root cause marker: the application believed to be the root cause carries a star icon.
- The causal path: the nodes and connections on the causal path from the root cause to the incident target are highlighted.
- Traffic statistics: traffic statistics labels sit on the connections. Hover over an application and only the services directly connected to it stay highlighted; the rest dim.
Tip: click an application name to open its detail dialog and analyse its metrics, logs and distributed traces further.
Note: you can zoom the map area with the mouse wheel and pan it by dragging. Double-click an empty area to restore the default position.
4. Causal timeline
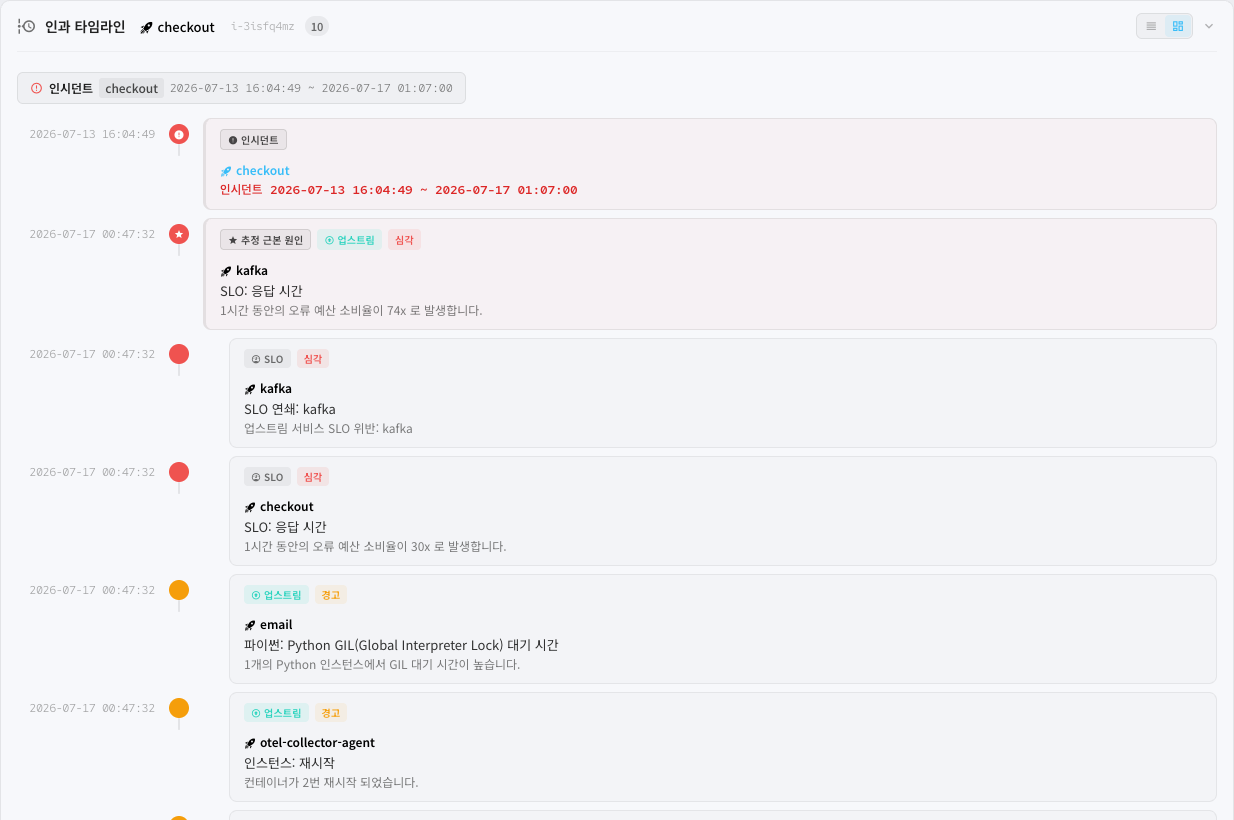
Lists the related events either side of the incident in time order, so you can follow the chain of causation that led to it. The section header gives the event count.
Switching view mode
The causal timeline offers two view modes, switched with the buttons at the right of the section header.
Compact view
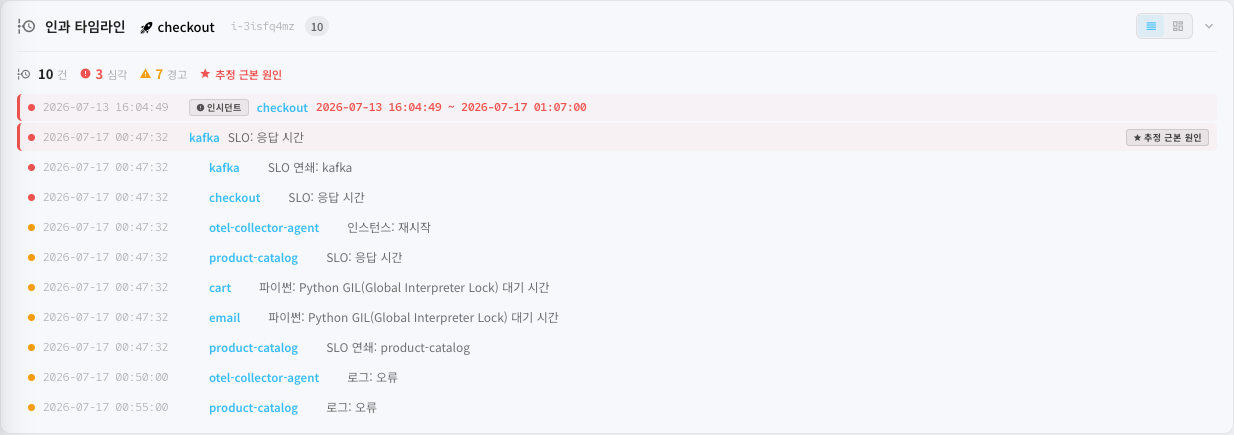
Summary statistics for the events appear at the top.
| Statistic | Meaning |
|---|---|
| N events | The total number of events on the timeline |
| Critical | Events at critical level |
| Warning | Events at warning level |
| Probable Root Cause | Marks the event believed to be the root cause |
Below the statistics, each event is listed compactly on one line carrying the time, a severity dot, the application name and the event title. The root cause event gets a Probable Root Cause badge, and the moment of the incident gets an Incident badge.
Full view
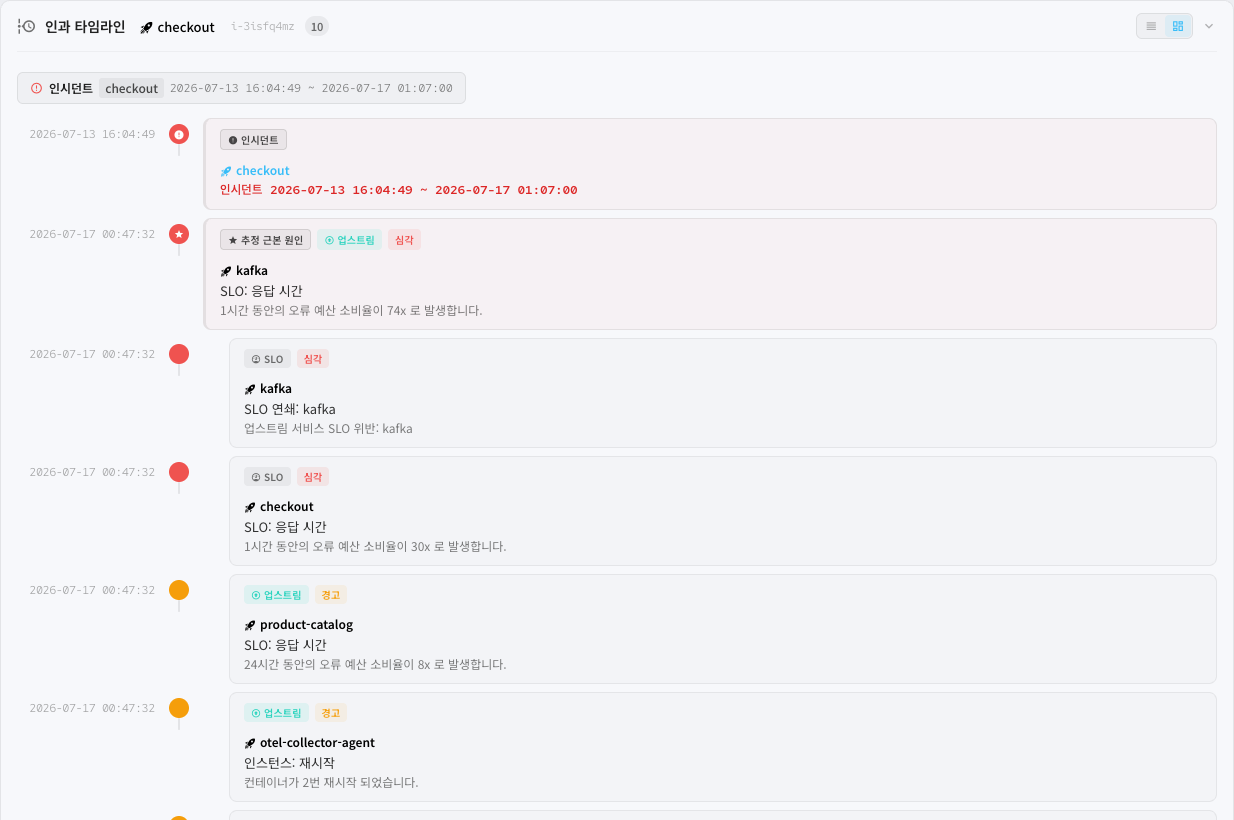
Each event is shown in detail as a card, arranged vertically along the time axis. Each event card carries the following.
- Time: when the event was detected
- Severity marker: a coloured round marker for the severity (red: critical, yellow: warning, green: informational)
- Category chip: the event's cause category (deployment, database, resource, upstream, log, SLO)
- Severity chip: the event's severity level
- Application link: the related application's name (click to open its detail dialog)
- Event title: the finding's title (for example "SLO: availability", "Deployment change: v2.1.0")
- Description: further information about the event
The card for the event believed to be the root cause is highlighted with a red left border and a blinking effect, and carries a Probable Root Cause badge.
The moment of the incident is inserted into the timeline as its own incident card, so you can see visually which events came before and after. Where the incident is still running, ongoing appears instead of an end time.
Tip: comparing the time of the root cause event with the time of the incident on the causal timeline tells you the interval between cause and effect.
5. The detailed RCA report
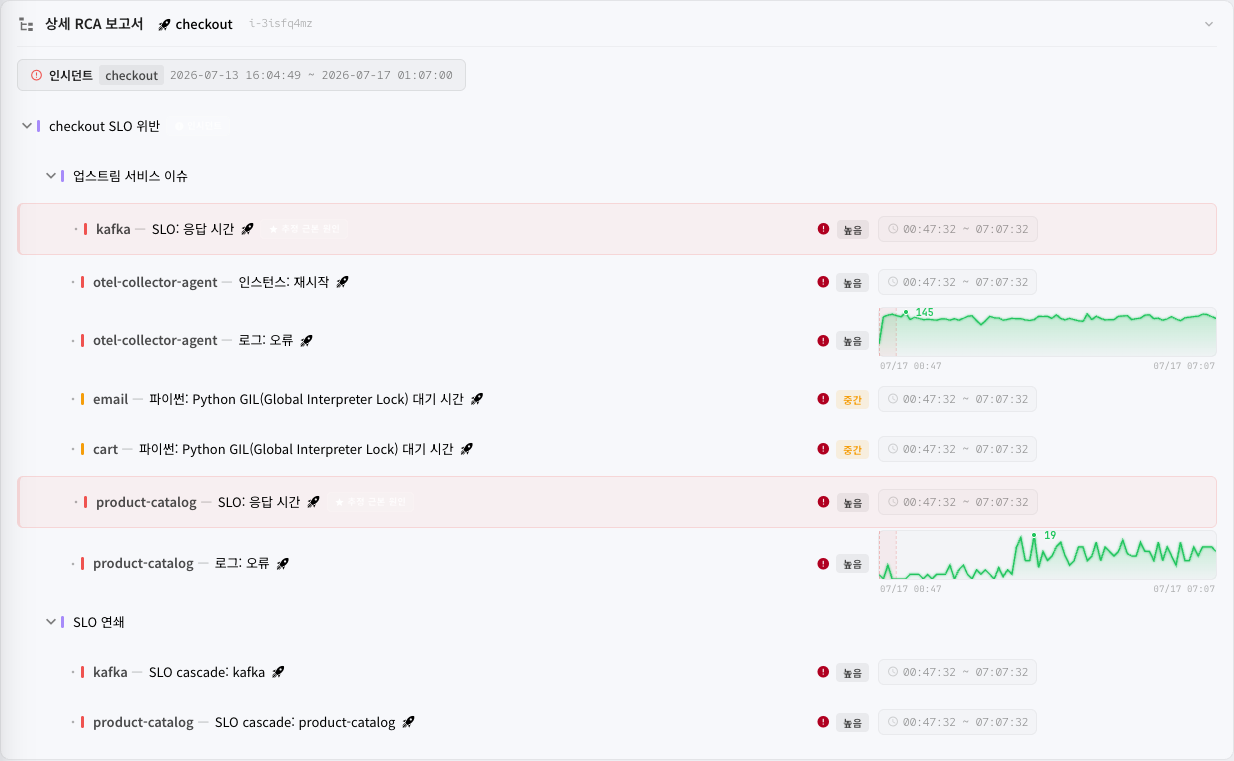
Presents the analysis of each individual finding as a tree, letting you explore the incident's causes hierarchically.
The incident time range
A bar at the top of the detailed RCA report gives the incident's time range. It carries the target application's name and the incident's start and end times. Where the incident is still running, ongoing appears instead of an end time.
Understanding the tree
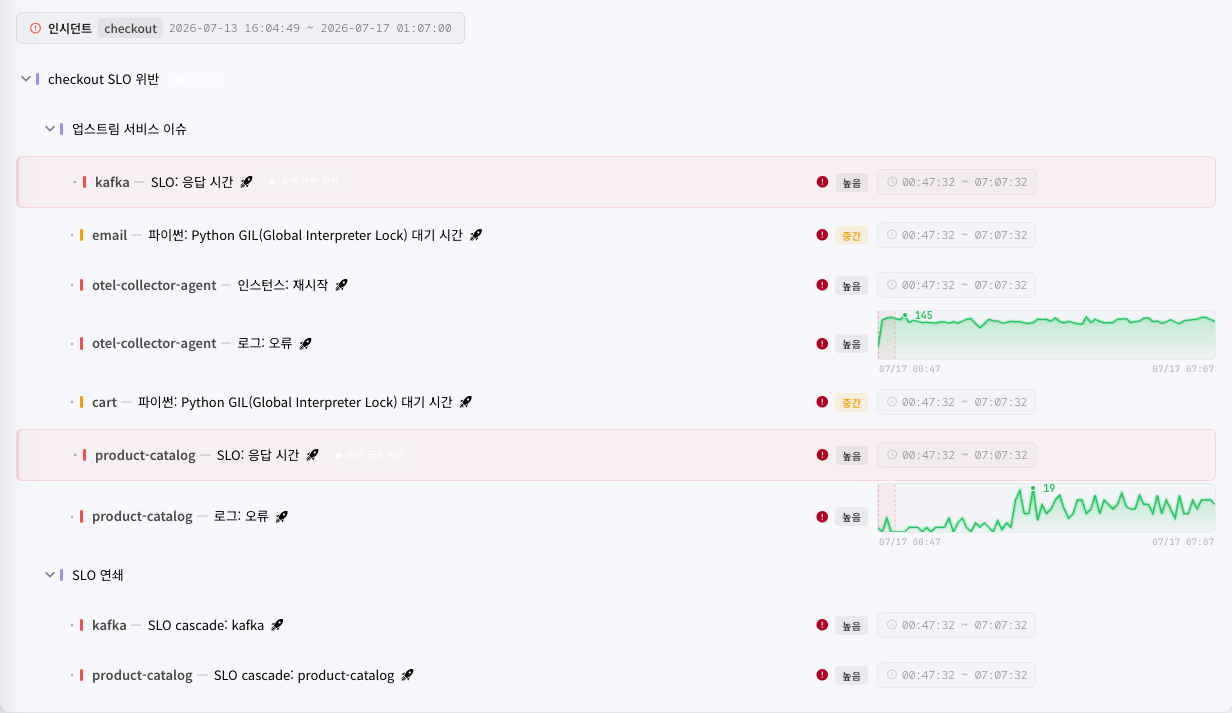
The tree's root node is the SLO breach on the application the incident occurred on. Below it sit group nodes for each cause category, and below each group, the individual finding nodes.
What a tree node carries
Each node shows the following.
| Element | Description |
|---|---|
| Collapse/expand arrow | Where the node has children, click to collapse or expand them |
| Node name | The category name or the finding's title |
| Application link | An icon that takes you to the related application (click to open its detail dialog) |
| Probable Root Cause badge | A red badge on the node judged to be the root cause |
| Incident badge | Shown on the incident's target node |
| Possible cause icon | A red warning icon on nodes that may be a cause |
| Confidence badge | The confidence level of the cause (High, Medium, Low) |
| Sparkline | The item's time-series data as a small line chart. The incident's period is shaded red. |
| Time range | The period over which the event occurred |
Category group nodes
The category group nodes gather the findings by type.
| Category | Description |
|---|---|
| Deployment Changes | Deployments and rollout events during the analysis period |
| Upstream Service Issues | A failure or SLO breach in an upstream service |
| Resource Saturation | Saturation of infrastructure resources (CPU, memory, disk) |
| Log Anomalies | A spike in error or warning level log patterns |
| SLO Cascade | Another service's SLO breach affecting this one in a chain |
| Database Issues | Degraded database response times, connection problems and so on |
Finding nodes
The leaf nodes, the findings, carry the specifics of each cause.
- Application name: the application the cause occurred on
- Report category: the relevant report area (SLO, CPU, memory, network and so on)
- Inspection item: the name of the inspection condition whose threshold was passed
- Sparkline: how that metric trended. Hover over the chart and a tooltip gives the value and time at that point.
Each finding's sparkline also shades the incident's period in red with a dotted line, so you can see visually how the cause event and the incident relate in time.
Looking at a node in detail
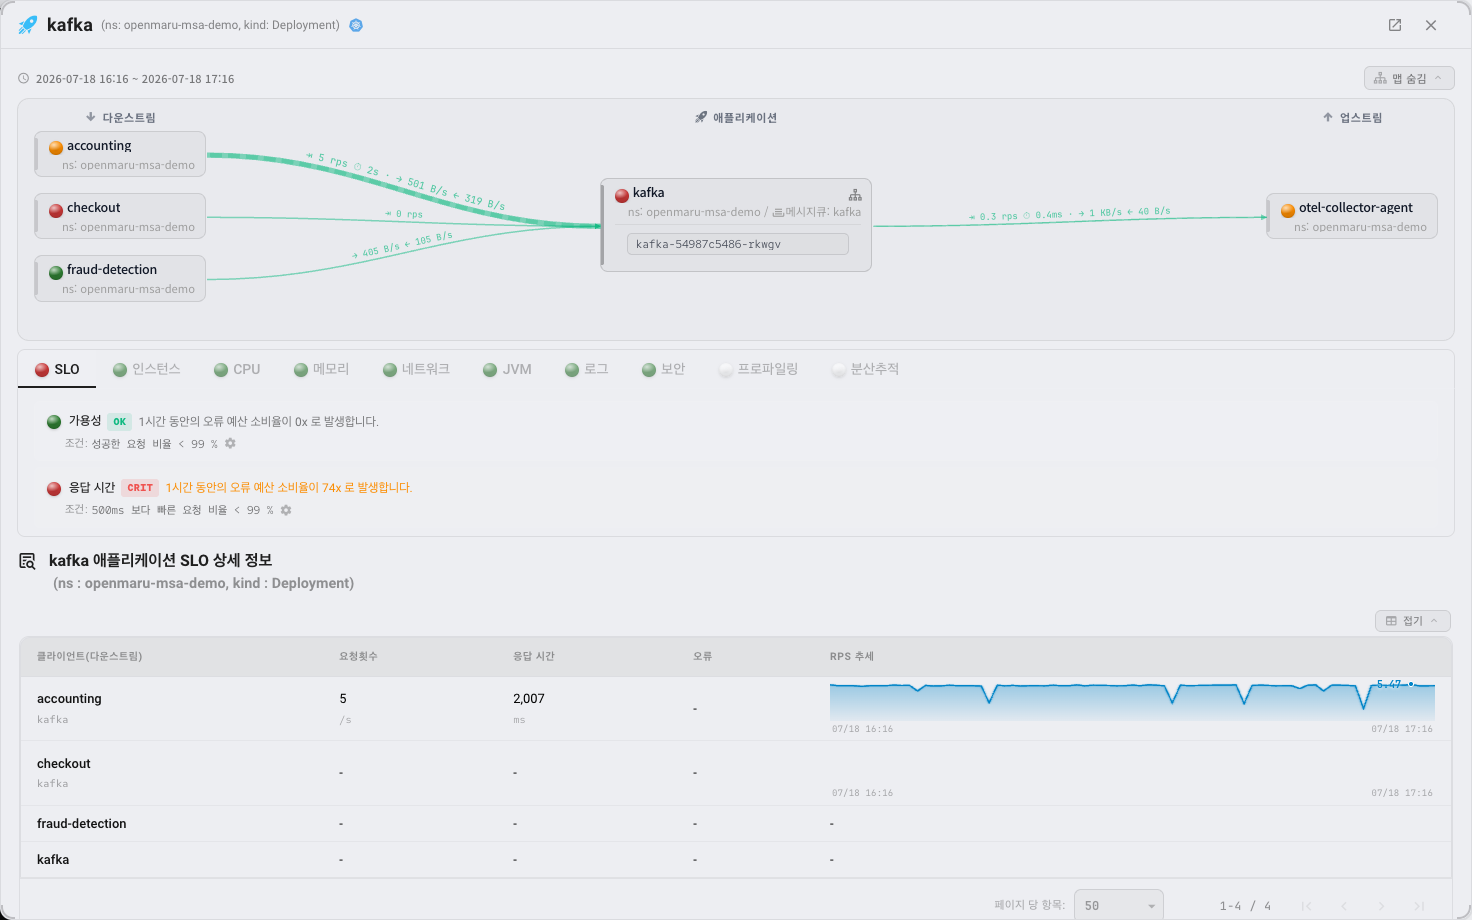
Click a finding node and a detail dialog opens. What it offers depends on the type of cause.
Log pattern details
Click a finding in the log anomaly category and a log pattern dialog opens carrying the following.
- Severity: the log level (critical, error, warning, info, debug)
- N events: how many times that log pattern occurred in total
- Time-series chart: how the log pattern's occurrences trended
- Sample: actual log messages matching that pattern
Click Show messages at the bottom of the dialog to see every log message with the same pattern on that application's logs tab.
Metric details
Click a metric-based finding, such as a resource or an SLO. A Details dialog opens with that metric's detail widget (a chart), so you can compare visually how the metric moved either side of the incident.
The traces (distributed tracing) tab
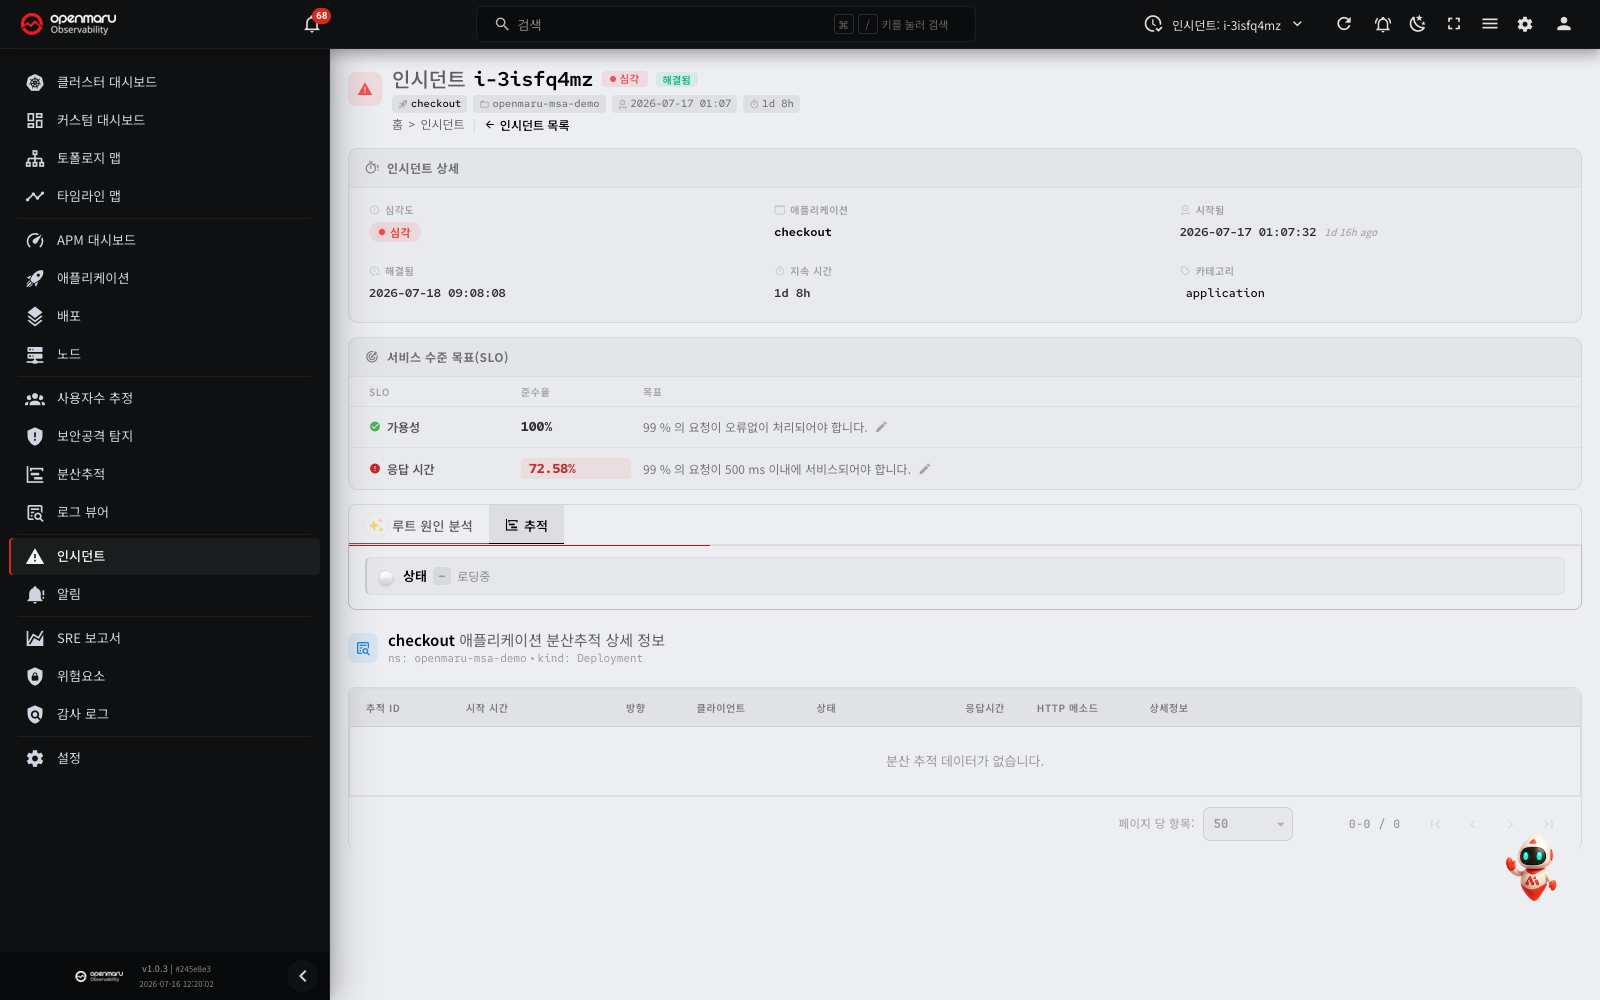
The traces tab of the incident details shows trace data from the period the incident covered. The trace heatmap and trace list are filtered automatically to the incident's application and its time range.
Where a response time SLO is configured, traces that passed that threshold are filtered in automatically. Click a trace to see its span details.
Tip: analysing the traces whose response time spiked lets you verify the root cause RCA estimated, at the level of an actual request flow.
The incident investigation workflow
To investigate an incident effectively, follow these steps.
- Read the situation from the incident list: check the critical and warning incident counts on the status summary strip.
- Choose the incident: use the severity or application filters to pick the incident to investigate.
- Check the SLO breach: on the incident detail page, check the compliance rates of the availability and latency SLOs.
- Establish the cause from the RCA summary: read the estimated root cause and the categorisation in the root cause analysis summary on the RCA tab.
- Analyse the propagation path: see from the issue propagation path where the failure started and where it spread.
- Review the causal timeline: work out from the causal timeline how the root cause event and the incident relate in time.
- Go deeper: where necessary, explore the individual causes as a tree in the detailed RCA report, or analyse the actual request flow on the distributed tracing tab.
- Move to the application details: click an application link to analyse its metrics, logs and distributed traces further.
The Alerts menu
The Alerts menu sits immediately below Incidents in the left sidebar. Where an incident is the higher-level event raised automatically by an SLO breach or anomaly detection, an alert is the notification raised when an individual inspection item or a user-defined alerting rule fires. On the Alerts screen you can look at the alerts that fired, resolve or suppress them, and manage the rules that raise them.
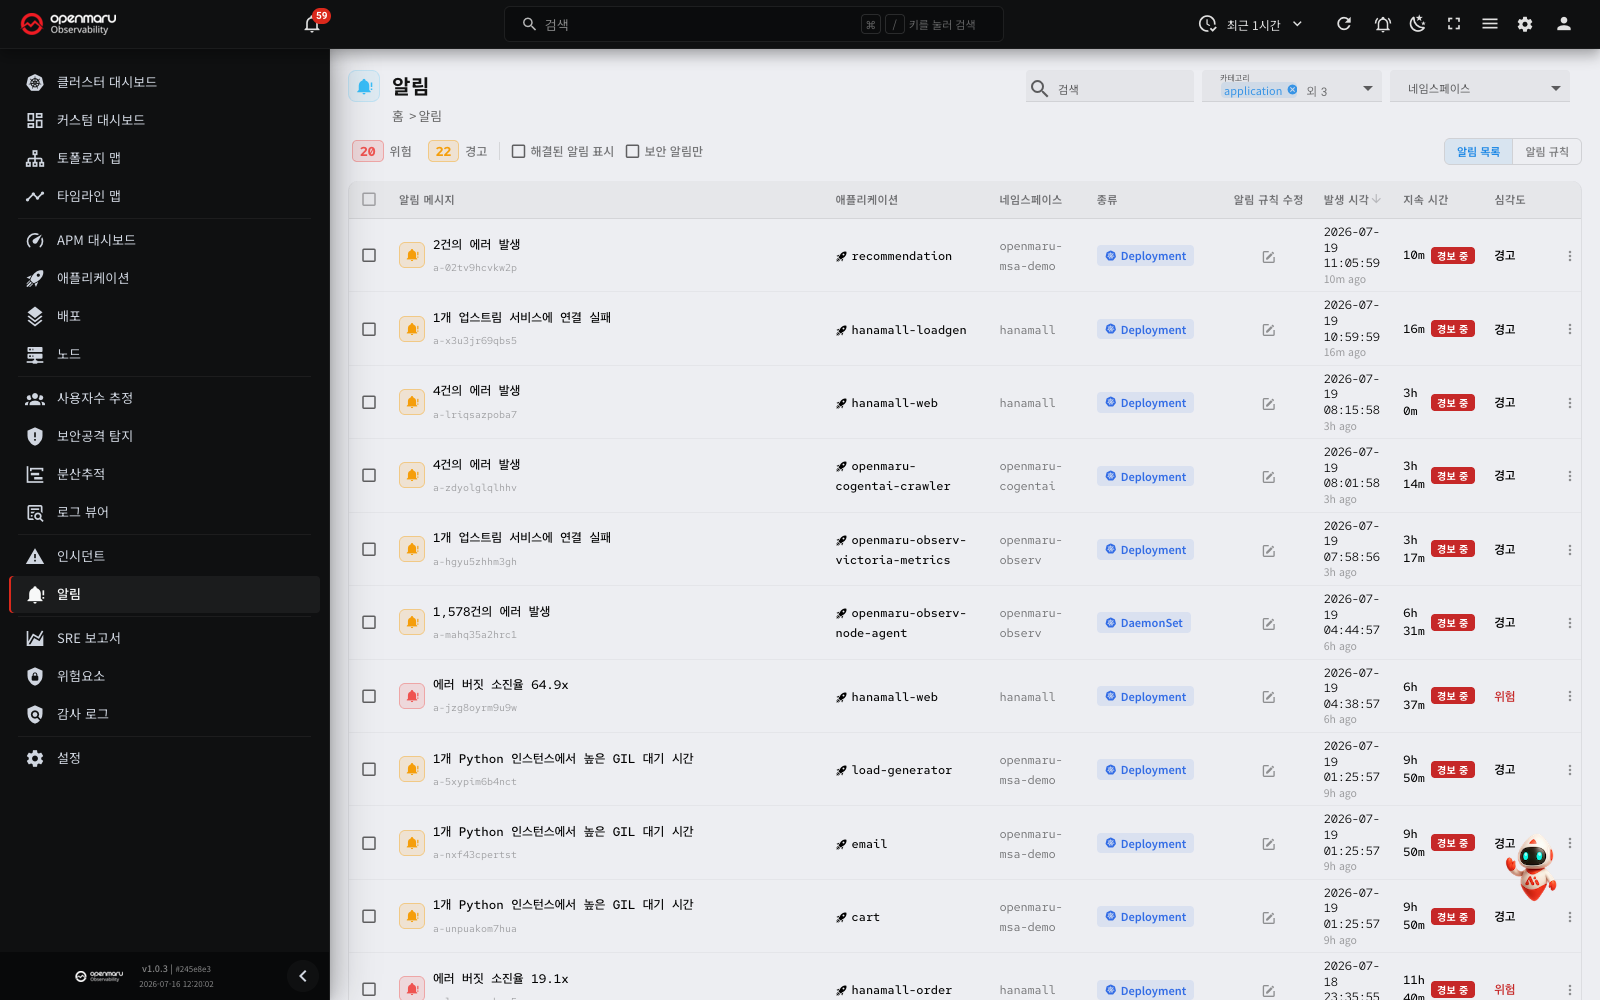
The screen is split by the tabs at the top into Alert List and Alerting Rules.
The Alert List tab
Shows firing and resolved alerts as a table.
- Status summary counters: firing counts by severity (critical, warning) at the top left; click one to filter to that severity.
- Show resolved: only firing alerts are shown by default; turn the toggle on to include resolved ones.
- Security only: filters to alerts raised by security attack detection.
- Application filters: use the category and namespace filters at the top right to look at one group of applications only.
The list table has the following columns.
| Column | Description |
|---|---|
| Alert Message | The alert summary and its ID (a-...). The icon before it gives the state: Firing (mdi-bell-alert), Resolved (✓ mdi-check-circle), Suppressed (mdi-bell-off) |
| Application | The application the alert fired on. Click it to open the application details |
| Namespace | The namespace the application belongs to |
| Kind | The workload kind (Deployment, DaemonSet, StatefulSet and so on) |
| Edit Rule | The edit icon for the rule that raised this alert. Click it to go to the rule editor |
| Fired at | When the alert first fired, and how long ago |
| Duration | How long it has been firing, and its current state (Firing / Resolved) |
| Severity | Warning or Critical |
Select several alerts with the checkboxes and a bulk action bar appears at the top, letting you Resolve, Suppress or Reopen them all at once.
Alert details
Click an alert row to open its Alert Detail dialog.
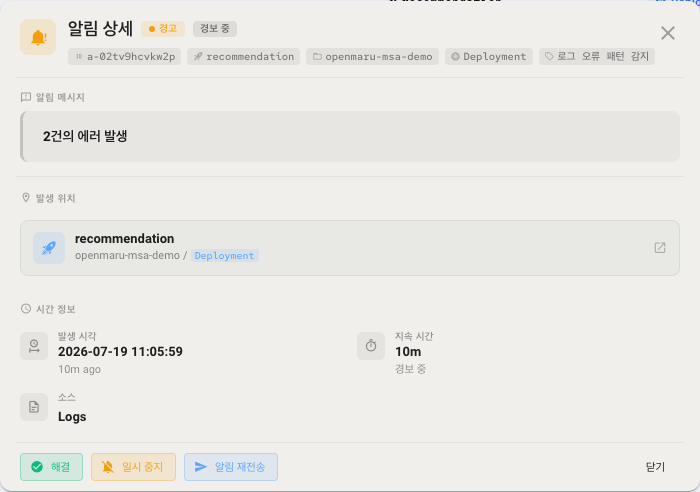
- Header: the severity badge and the current state (Firing / Resolved / Suppressed)
- Tags: alert ID, application, namespace, workload kind, alerting rule name
- Alert Message: a human-readable summary of the firing condition
- Location: the application the alert is attached to (click the link for the application details)
- Time Info: Fired at, Duration, Source (for example
Logs,SLO). A resolved alert also shows Resolved at. - Action buttons: Resolve (resolve manually), Suppress (suppress the alert for a set time), Resend (resend a currently firing alert to external channels such as Slack and Teams, and as an on-screen toast)
The Alerting Rules tab
Click Alerting Rules in the tabs at the top to see the rules that raise alerts.
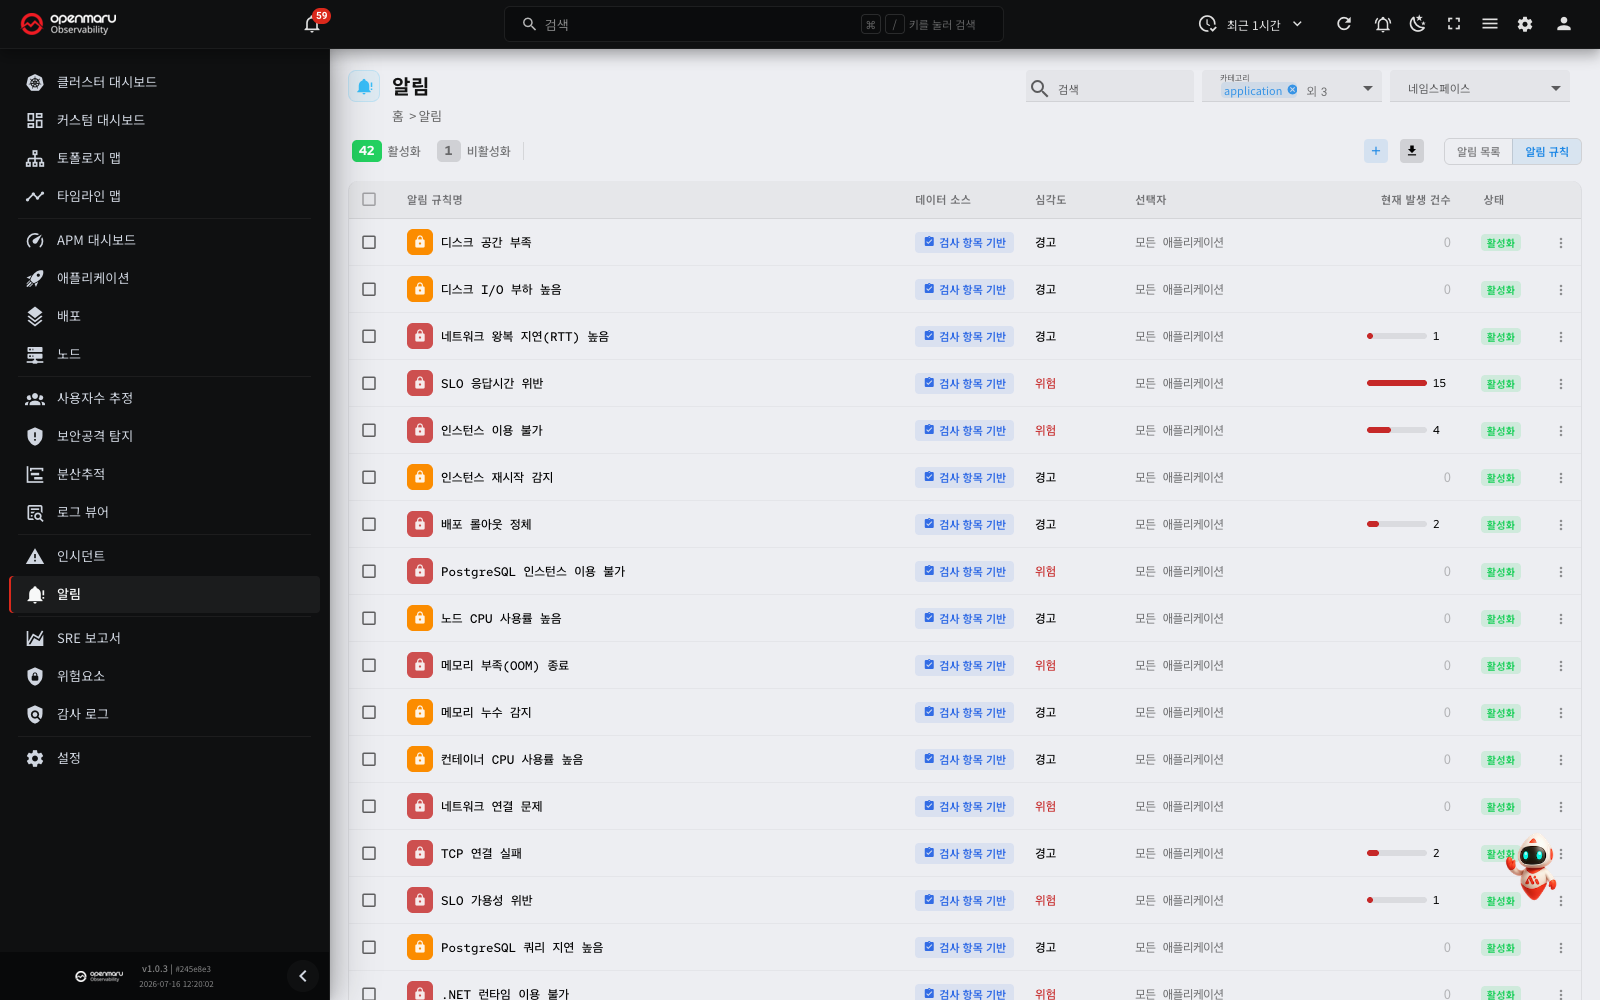
- The count of Enabled and Disabled rules appears at the top. The + button (Add Rule) at the top right adds a new rule, and the Export icon exports the rules as JSON.
- The icon before a rule name distinguishes three kinds.
- Lock (
mdi-lock): a config-managed rule, deployed through a configuration file and not editable or deletable from the screen. - Shield (
mdi-shield-check): a built-in rule, created automatically by the system at first installation. It can be edited and deleted just like a user-defined rule (the difference being that its name is shown translated). - Bell (
mdi-bell-ring): a user-defined rule, fully editable and deletable.
- Lock (
| Column | Description |
|---|---|
| Rule Name | The rule's name (shown in Slack and Teams messages). Built-in rules are shown translated |
| Data source | The kind of source the rule evaluates (Check-based, Log patterns, PromQL, K8s Events and so on) |
| Severity | Warning or Critical |
| Selector | What the rule applies to (All applications / By category / By applications) |
| Current Alerts | How many alerts are firing from this rule (click to filter to them) |
| Status | The rule's enabled/disabled toggle |
There are 49 built-in rules.
- 46 rules based on inspection items: SLO, CPU, memory, storage, network, instances, deployments, databases, runtimes, vLLM, DNS, logs and security attack detection
- 1 attack IP rule
- 2 resource prediction rules: CPU or memory capacity is predicted to run out within 7 days
The server adds the built-in rules that a project does not have. Thus, built-in rules that a new version adds also go into existing projects.
You can override the thresholds of built-in rules at project level under Settings > Inspections. For an inspection item that is not in that table (for example the vLLM inspections), change it in the application detail. Click the gear icon on the inspection item at the top of the tab to open the settings dialog. In this dialog you can change both the application-level value and the project-level value.
vLLM built-in alerting rules

These 3 built-in rules apply to applications that have a vLLM engine. All 3 rules have the severity Warning, a For duration of 5 minutes and a Keep firing for time of 1 minute. The condition must continue for 5 minutes before an alert fires. After the condition clears, it must stay false for 1 minute before the alert is resolved.
| Rule name | Inspection item | Condition (default threshold) | Not evaluated when |
|---|---|---|---|
| High vLLM request error rate | vLLM request errors | The percentage of requests finished with an error in the last 5 minutes > 5% | The average request rate of the last 5 minutes is less than 0.05 req/s (about 15 requests in 5 minutes) |
| High vLLM KV cache usage | vLLM KV cache usage | The KV cache usage of a vLLM instance > 90% | The engine has no KV cache (embedding, rerank) |
| vLLM requests waiting in queue | vLLM waiting requests | The number of waiting requests of a vLLM instance > 0 | -- |
- The error rate counts only requests that finished with an engine error. It does not count requests that the user cancelled (abort). Thus, this alert may not fire when the Finished and failed requests, per second chart on the vLLM tab shows failures.
- For errors on an engine with few requests, use the SLO Availability violation rule.
- For a slow time to first token (TTFT), use the SLO Latency violation rule. The latency SLO of a vLLM application uses the time to first token.
- The status light of the vLLM tab in the application detail shows green (OK) or yellow (warning) from these inspections.
Python runtime and DB connection built-in alerting rules
These 4 built-in rules apply to Python applications and to applications that use PostgreSQL or MySQL. All 4 rules have the severity Warning and a Keep firing for time of 1 minute.
| Rule name | Inspection item | Condition (default threshold) | For duration |
|---|---|---|---|
| High Python event loop blocking | Python event loop blocking | Largest event loop longest busy time in the last 5 minutes > 2 s | 1 minute |
| Long Python GC pause | Python GC pause | Largest longest GC pause in the last 5 minutes > 0.5 s | 1 minute |
| High Python GC time | Python GC time | Average GC time percentage per process in the last 5 minutes > 5% | 5 minutes |
| High DB connection utilization | DB connection utilization | Concurrent queries ÷ open connections of a PostgreSQL or MySQL destination > 90% | 5 minutes |
- The event loop and longest GC pause inspections use the largest value in the last 5 minutes. Thus a single long block fires an alert after about 1 minute. When the blocks stop, the condition clears after 5 minutes, and the alert is resolved after the keep firing time of 1 minute.
- The event loop alert message also shows the longest GC pause in the same 5 minutes. For example:
long event loop blocking on 1 Python instance (GC pause up to 1.10 sec). If the two values are equal, the GC possibly blocked the loop. - If an app does not use an event loop and gets the event loop alert, set a high threshold for that app on the Python tab of the application detail to stop the alert.
- The DB connection utilization is the value as the app sees it. The PostgreSQL connection pool exhaustion and MySQL connection pool exhaustion rules examine the number of connections on the DB server.
- For the conditions and how they are evaluated, see the Python tab and the network tab in the Applications chapter.
Configuring an alerting rule
Click the + button to open the Create Rule dialog. When you edit a rule, the Edit Rule dialog opens.
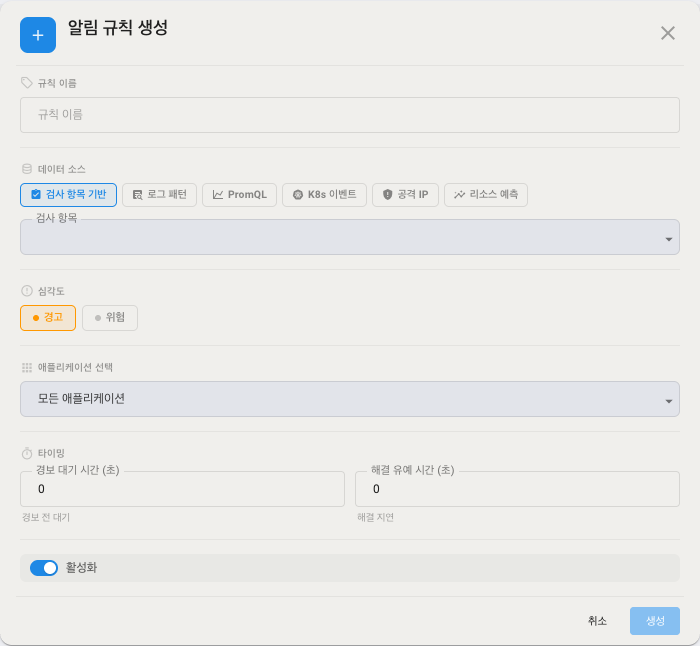
| Setting | Description |
|---|---|
| Rule name | The identifying name shown in alert messages (for example Order service response delay) |
| Data source | The source the rule evaluates: Check-based (the state of a built-in inspection), Log patterns (aggregated errors and warnings in logs), PromQL (a metric query expression), K8s Events (aggregated events such as FailedScheduling), Attack IPs (security detection), Resource Prediction (predicted resource exhaustion) |
| Severity | Warning (needs attention) or Critical (needs an immediate response) |
| Application selector | All applications / By category / By applications (glob patterns) |
| Timing | For duration (seconds) and Keep firing for (seconds) (see below) |
| Enabled | Whether the rule is active |
Timing: For duration and Keep firing for
The Timing area has two time settings. They decrease unnecessary alerts (alert fatigue) and alerts that open and close repeatedly (flapping). A new rule starts with 0 for both values.
- For duration (seconds) (For): the condition must stay true for this time before the alert fires. If the condition clears during the wait, the wait stops. This prevents alerts from short spikes. With
0, the alert fires at the first evaluation where the condition is true. - Keep firing for (seconds) (KeepFiringFor): a firing alert stays open for this time after the condition clears. The server counts the time from the last evaluation where the condition was true. If the condition is true again during this time, the same alert continues and no notification is sent. If the condition stays false for this time, the server resolves the alert and sends the resolve notification. With
0, the server resolves the alert at the evaluation where the condition clears.
| For duration | Keep firing for | Behaviour |
|---|---|---|
| 0 s | 0 s | Fires at the first evaluation where the condition is true, resolves at the evaluation where it clears |
| 300 s | 0 s | Fires after the condition continues for 5 minutes, resolves at the evaluation where it clears |
| 0 s | 300 s | Fires at the first evaluation where the condition is true, resolves 5 minutes after the condition was last true |
| 300 s | 300 s | Fires after the condition continues for 5 minutes, resolves 5 minutes after the condition was last true |
Keep firing for works as follows.
- It applies only to firing alerts. If an alert has not reached its For duration and the condition clears, the server discards it at once.
- The Resolved at time of the alert is the last time the condition was true. Thus the resolve time is earlier than the time of the resolve notification, by up to the Keep firing for time.
- The server evaluates the rules about every 15 seconds. Thus the actual hold is up to about 15 seconds longer than the setting.
- If a user resolves the alert, the rule is deleted or disabled, or the application is gone, the alert is resolved at once without the hold.
- For rules with the data source Check-based, PromQL or K8s Events, the server also resolves the alert when the hold time passes if the evaluation stops during the hold (for example, the inspection item has no data).
The built-in rules are created with these Keep firing for times. You can change them when you edit a rule.
| Keep firing for | Built-in rules |
|---|---|
| 5 minutes | SLO availability and latency violation, unavailable instance, database and runtime, OOM kill, database replication status and lag, security attack detection |
| 1 minute | Node and container CPU, memory leak, instance restarts, network, database latency and connections, JVM safepoint, Python GIL, the 3 vLLM rules, DNS |
| 0 (none) | Disk space, disk I/O, stuck deployment, log error pattern, attack IP, the 2 resource prediction rules |
Keep firing for compared with the incident resolve hold
Keep firing for (seconds) of an alerting rule and the Incident resolve hold are different settings.
| Item | Keep firing for of an alerting rule | Incident resolve hold |
|---|---|---|
| Applies to | The alerts raised by that rule | All incidents of the project |
| Where to set it | In each alerting rule (Timing) | The Settings > Notifications tab (one value for each project) |
| Default | 0 for a new rule. 0, 1 minute or 5 minutes for built-in rules | 5 minutes (300 seconds) |
| How to turn it off | Set 0 | Set 0 |
| Start of the count | The last evaluation where the condition was true | The evaluation where the SLO status returned to normal |
| Recorded resolve time | The last time the condition was true | The time when the SLO status returned to normal |
The two features work separately. If the same failure opens an alert and an incident, the alert is resolved by the Keep firing for time of its rule, and the incident is resolved by the incident resolve hold. Thus the two resolve notifications can come at different times.
Connecting alert channels
To send firing alerts to external channels such as Slack, MS Teams and webhooks, configure the channel under Settings > Notifications. For each channel you can choose whether it receives incidents, deployments and alerts, and the alert language (Korean or English). For details, see Settings — alert channels.
Related documents
- Applications — per-application metrics and SLO status
- Settings — inspection conditions — setting SLO thresholds and inspection conditions
- Settings — alert channels — configuring Slack, MS Teams and webhook alert channels
- Timeline map — incidents and deployment events in time order
- Distributed tracing — detecting response time anomalies with the trace heatmap
- Chart guide — how to read charts and the shared controls