5.4. LLM application tracing
How to read the call structure, tokens and input and output messages of an LLM application such as CogentAI on the distributed tracing screen.
Overview
An LLM (large language model) application uses many components to process one question. The agent calls the model many times, runs the tools that the model selects, and sends the results back to the model. When a response is slow or an answer is wrong, you must find the step that caused the problem.
The Traces screen shows this process as one trace. This chapter uses a real CogentAI trace to show how to find this data:
- The call structure between the components (tree and waterfall chart)
- The input and output tokens and the model of each LLM call
- The time breakdown in the model server (queue, time to first token, generation)
- The input messages sent to the model and the output messages that the model returned
- The tool (MCP) calls that the model selected
- The linked traces that start when CogentAI asks the user a question
For the basic use of the distributed tracing screen, refer to Distributed tracing.
Note: The screens in this chapter show CogentAI trace
27211112464e7cd0561267a95857b93e, recorded on 2026-10-05 at 22:21. The user asked "애플리케이션 전체 모니터링 현황 보여줘" (show the monitoring status of all applications). The trace has a response time of 76.3 seconds, 111 spans, 6 services and 5 LLM calls.
What you can see
CogentAI components
Each CogentAI component sends trace data with OpenTelemetry. In the trace, the components have these service names.
| Component | Service name | Data in the trace |
|---|---|---|
| Request server | openmaru-cogentai | The start and end of one question (cogentai.request), the guardrail, RAG and agent steps, MySQL and Redis calls |
| Guardrail | openmaru-guardrails | The question check request (POST /v1/guardrails/check) |
| RAG (retrieval-augmented generation) | openmaru-cogentai | The document search steps (rag.search, rag.retrieve, rag.embed.*, rag.hybrid, rag.rerank and others) |
| Agent | openmaru-hermes | Model calls (openai.chat) and tool calls (MCP send tools/call <tool name>) |
| LLM gateway | openmaru-cogentai-litellm | Relayed model calls (chat <model alias>) and the real model name |
| Model server | openmaru-vllm | Model runs (llm_request) and the time breakdown |
| MCP tool server | openmaru-cogentai-mcp-apm and others | Tool runs that the request server calls (tools/call <tool name>) |
How LLM spans are identified
A span that has token usage attributes (gen_ai.usage.input_tokens and others) is an LLM call span. The screen puts an orange LLM badge on an LLM call span. The badge shows the total of input and output tokens (for example, LLM · 92.3k tok).
The agent, the LLM gateway and the model server each record a span for the same model call. Thus you see the LLM badge three times for one call. The LLM calls box below merges these three spans into one call.
Find a CogentAI request
Each question to CogentAI is one trace whose root span name is cogentai.request.
- In the left sidebar, click the Traces menu.
- Click the Traces tab.
- Click Add filter.
- In the field, select Root Span Name. In the value, type
cogentai.request. - Click the apply button.
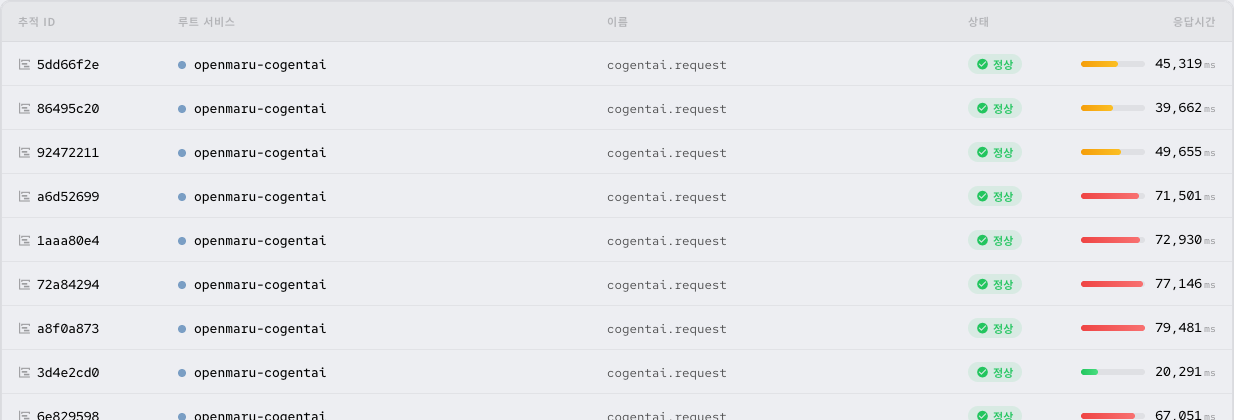
The list shows one row for each question. Use the Duration column to find slow questions. Click the trace ID, the root service or the name in a row to open the trace dialog.
If a link icon is next to the trace ID, the trace is linked to other traces. Refer to Linked traces after a follow-up question.
Read the call tree
In the trace dialog, the Service & Operation area shows the spans as a tree in call order. A child span is indented below its parent span. In the waterfall chart on the right, each bar shows when a span started and how long it took.
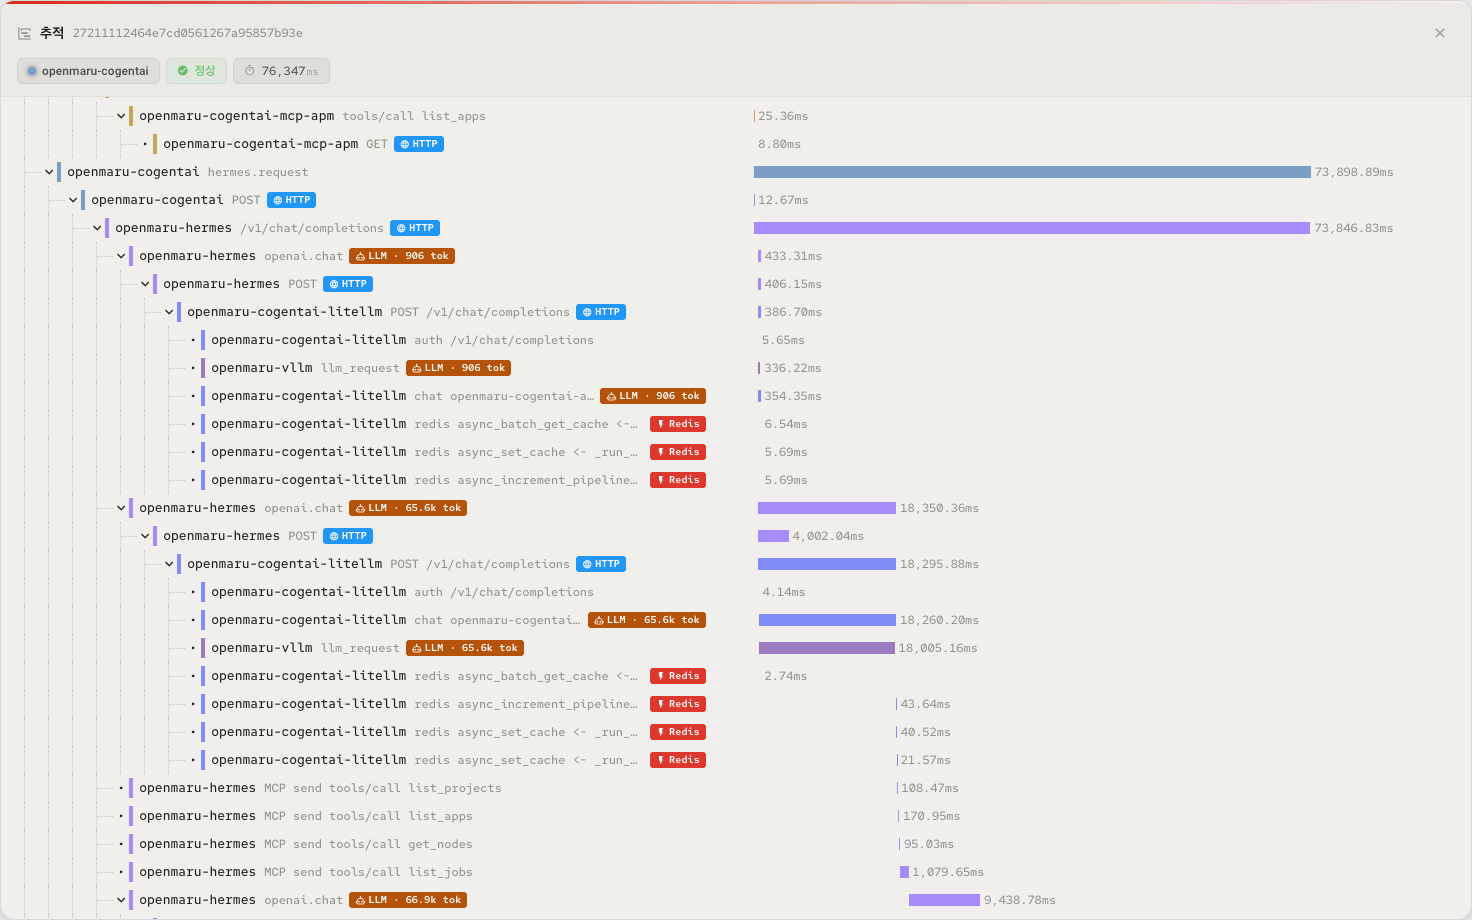
The screen above shows the agent step (hermes.request). The tree shows this call structure:
- The request server (
openmaru-cogentai) sends a request to the agent (openmaru-hermes). - The agent calls the model (
openai.chat). The call goes through the LLM gateway (openmaru-cogentai-litellm) to the model server (openmaru-vllm). - The
chatspan of the LLM gateway and thellm_requestspan of the model server are side by side below the same parent. - When the model selects tools, the agent calls the tools (
MCP send tools/call list_projectsand others). - After the agent gets the tool results, it calls the model again. In this trace, the agent called the model 4 times.
Compare the bar lengths to see where the time went. In this trace, the model call bars are long and the tool call bars are short. The model calls use most of the time.
Main steps only
When a trace has more than 100 spans, the tree is many screens long. Click Main steps only on the right of the Service & Operation header. The screen keeps only the steps directly below the root span and folds the spans below them.
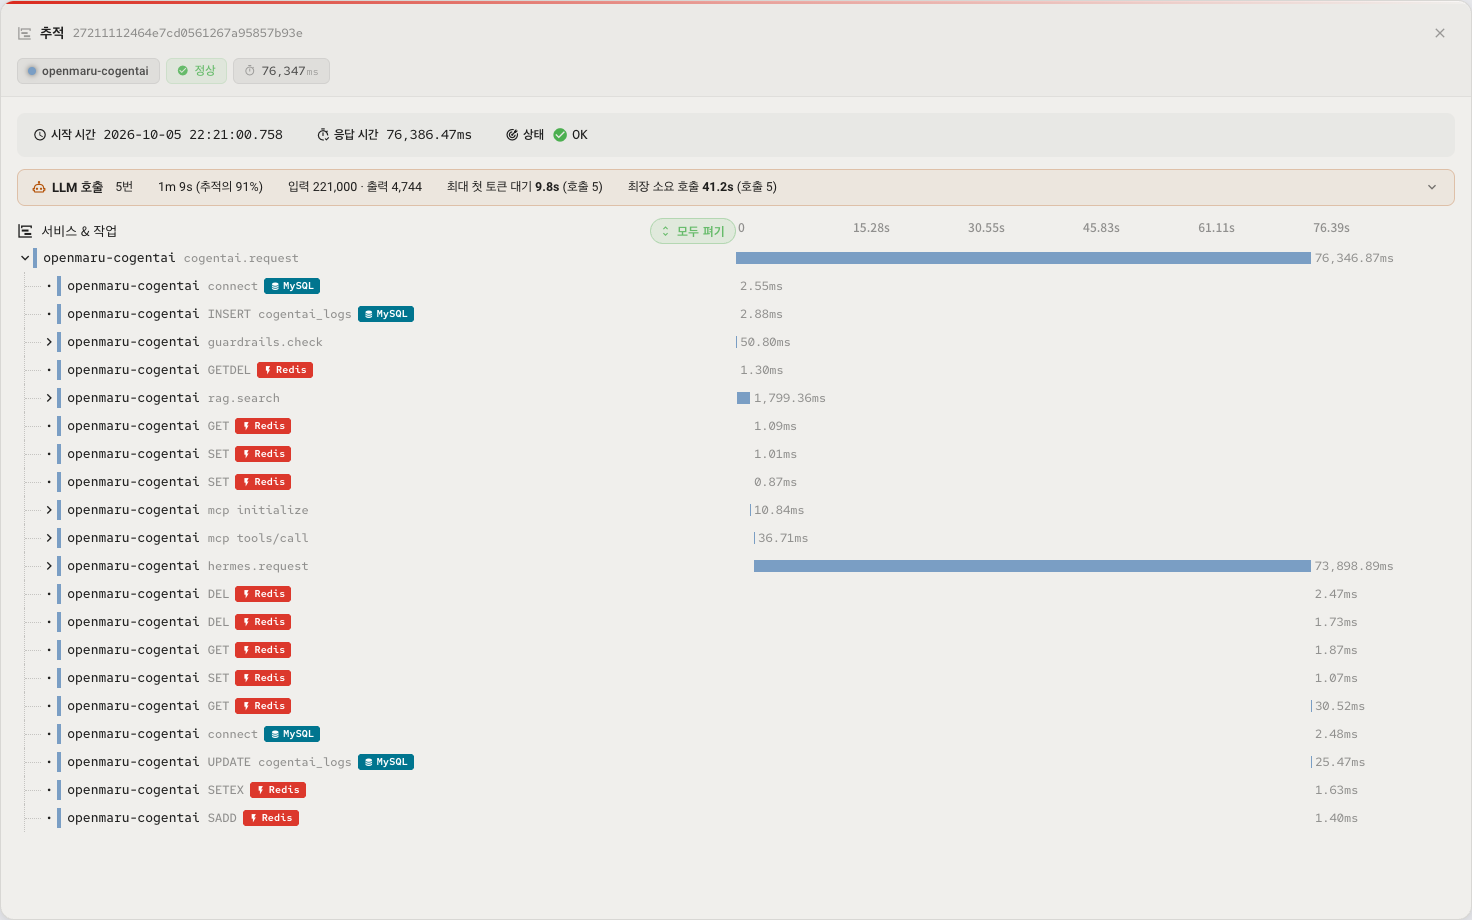
In this view, you can see all the steps of one question on one screen. This trace ran the guardrail check (guardrails.check), the document search (rag.search), the tool preparation (mcp initialize, mcp tools/call) and the agent (hermes.request) in this order. The agent step used 73.9 seconds of the total 76.3 seconds.
Click the name of a folded row to open it one level. Click Expand all to open all the spans again.
LLM calls box
When a trace has LLM calls, the LLM calls box is above the waterfall chart. The box is closed at first. Its header shows a summary of the full trace.
| Header item | Description |
|---|---|
| Call count | The number of LLM calls in the trace (for example, 5 calls) |
| Time | The time that the LLM calls used and its percentage of the trace. Overlapping calls are counted once. |
| Input · Output | The total input tokens and output tokens of all the calls |
| Max time to first token | The call that waited longest for its first output token, and that time |
| Longest call | The call that took the longest, and that time |
Click the header to open a table with one row for each call.

| Column | Description |
|---|---|
| Call | The call number, in order |
| Role / span name | The role of the call and the span name of the caller. The model's finish reason sets the role. |
| Input tokens / Output tokens | The token counts of this call |
| Queue time | The time in the model server queue |
| Time to first token | The time until the first output token. It includes the queue time. The remaining time is mostly the time to read the input. If a call has no model server time attributes, the column shows the LLM gateway time to first chunk. |
| Generation time | The time to make the output tokens, including reasoning |
| Elapsed time | The total time of the call |
| Generation speed (TPS) | Output tokens ÷ generation time |
The role badges are:
| Role | Finish reason | Meaning |
|---|---|---|
| Tool call decision | tool_call, tool_calls | The model returned tool calls instead of an answer. The agent runs the tools and calls the model again. |
| Answered | stop | The model completed the answer. |
| Cut off by length limit | length | The answer stopped at the output token limit. |
Other finish reasons are shown as they are. If a call has no finish reason, the role shows –.
The screen above shows these facts:
- Call 1 (
llm.simple_request) is a short call from the document search step. - Call 2 is a call from the agent to make a title for the conversation (shown in its input messages).
- Calls 3 and 4 are Tool call decision calls. The model used 18.4 seconds and 9.4 seconds to select the tools.
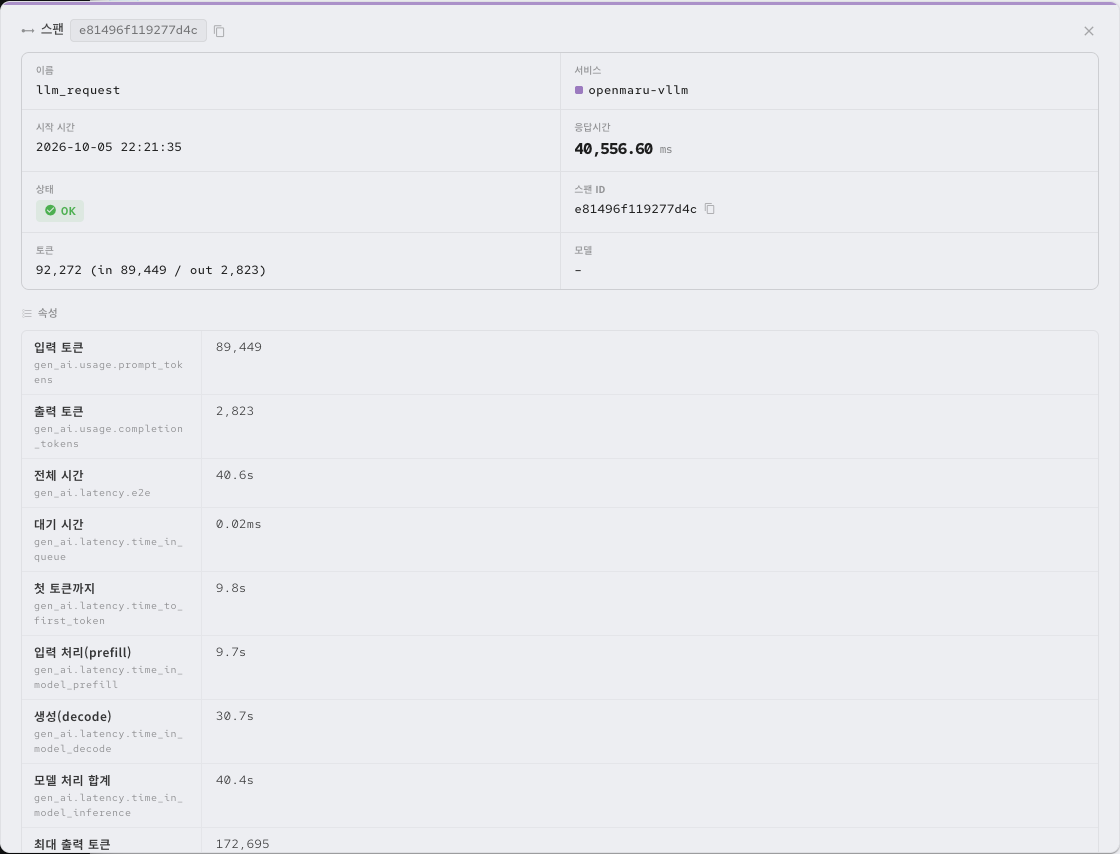
- Call 5 is the final answer. The input was 89,449 tokens, so the first token came after 9.8 seconds. The model used 30.7 seconds to make 2,823 tokens.
The longest time to first token and the longest elapsed time are shown in orange. More input tokens give a longer time to first token. If the time to first token is long, first examine the size of the input (instructions, conversation history, search documents and tool definitions).
Click a row in the table to open the span details of that call. The screen opens the span that has the model server time attributes (vLLM llm_request).
How the same call is merged
The agent and the LLM gateway record the response ID (gen_ai.response.id). The model server records the request ID (gen_ai.request.id). For the same call, the two values are the same (for example, chatcmpl-a3e39e27408fc03f). The screen merges the spans with the same value into one call.
Embedding and rerank calls do not make answers, so the table does not include them.
LLM span details
Tooltip
Put the mouse pointer on a span with an LLM badge. The tooltip shows the Tokens (input / output) and Model rows.
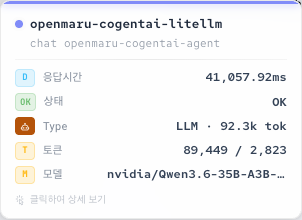
For the same call, each span can show a different model name. The agent span shows the model alias that the agent requested (openmaru-cogentai-agent). The LLM gateway span shows the model that responded (nvidia/Qwen3.6-35B-A3B-NVFP4). The model server span has no model attribute, so it shows –.
Span details
Click the LLM badge, the information button or the bar to open the span details dialog. The summary at the top shows Tokens and Model. The Attributes list shows the LLM attributes.
Common LLM attributes show a readable name together with the original key.
| Name on the screen | Attribute key | Description |
|---|---|---|
| Request model / Response model | gen_ai.request.model, gen_ai.response.model | The model name in the request and the model that responded |
| Finish reason | gen_ai.response.finish_reasons | stop, tool_call, length and others |
| Input tokens / Output tokens / Total tokens | gen_ai.usage.* | Token counts. The model server uses the prompt_tokens and completion_tokens keys. |
| Time to first chunk | gen_ai.response.time_to_first_chunk | The time until the LLM gateway gets the first response chunk |
| Cost | litellm.cost.total | The cost that the LLM gateway calculated |
| Input messages / Output messages | gen_ai.input.messages, gen_ai.output.messages | The messages sent to the model and the messages that the model returned |
The model server (vLLM) span divides the call time as follows.
| Name on the screen | Attribute key | Value on the screen above |
|---|---|---|
| Total time | gen_ai.latency.e2e | 40.6s |
| Queue time | gen_ai.latency.time_in_queue | 0.02ms |
| Time to first token | gen_ai.latency.time_to_first_token | 9.8s |
| Input processing (prefill) | gen_ai.latency.time_in_model_prefill | 9.7s |
| Generation (decode) | gen_ai.latency.time_in_model_decode | 30.7s |
| Model time total | gen_ai.latency.time_in_model_inference | 40.4s |
A long queue time means that requests are waiting in the model server. A long input processing time means that the input is large. A long generation time means that the output is long or the generation speed is low.
Read the input and output messages
The agent span and the LLM gateway span record the messages sent to the model (Input messages) and the messages that the model returned (Output messages) as attributes. The values are JSON, and the screen shows them with syntax highlighting.
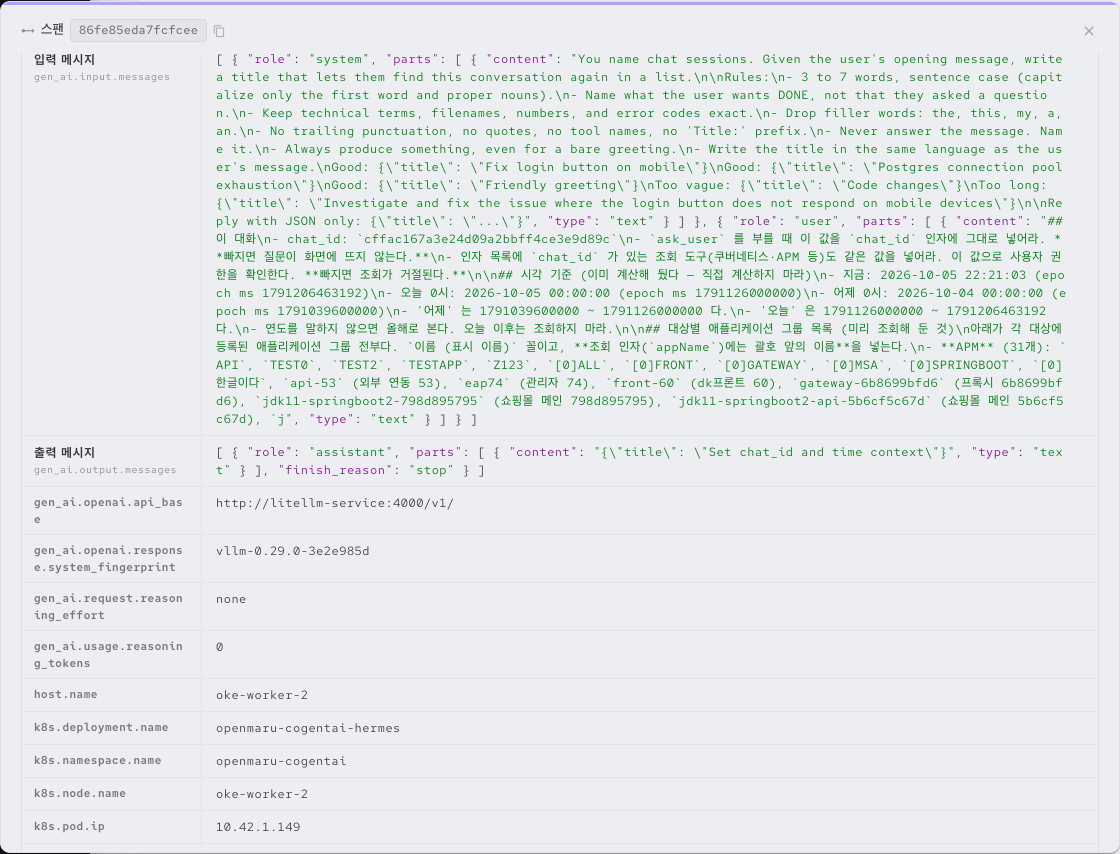
The screen above shows the messages of call 2. The input messages are divided by role (role):
system: The instructions to the model. In this call, the instruction is to make a conversation title.user: The user question and the data that the request server added.assistant: The earlier answers and tool calls of the model.tool: The tool results.
The output messages contain the answer of the model and the finish reason (finish_reason). Call 2 returned {"title": "Set chat_id and time context"}.
Use the messages to find:
- The instructions and the question that the model received, when the model gave a wrong answer
- Whether the search documents (RAG results) are in the input
- Why there are many input tokens (long instructions, long conversation history, many tool definitions)
The copy button of each attribute row copies the original collected value, not the value on the screen, in the key=value format.
Read the tool (MCP) calls
When the model selects tools, the output messages of that call contain "type": "tool_call" items. Each item has the tool name (name) and the arguments (arguments).
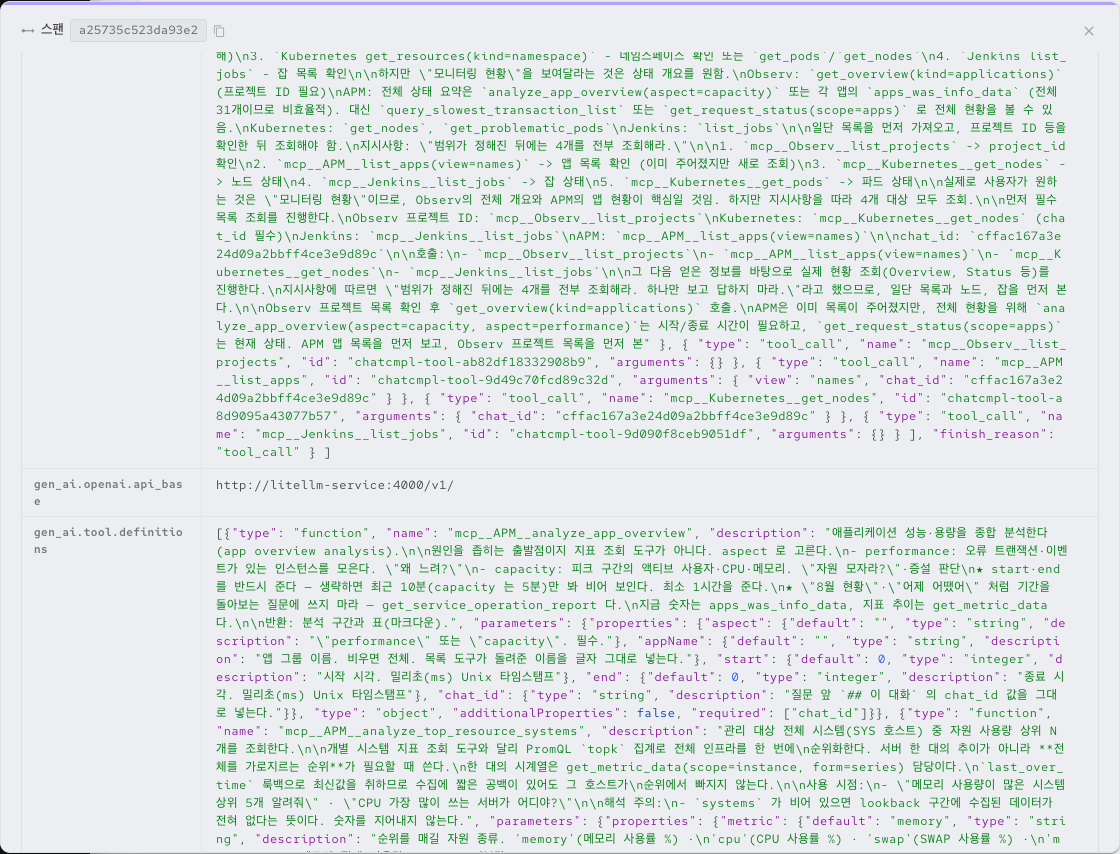
The screen above shows the end of the output messages of call 3. After its reasoning (reasoning), the model selected 4 tools (mcp__Observ__list_projects, mcp__APM__list_apps, mcp__Kubernetes__get_nodes, mcp__Jenkins__list_jobs). The call ended with the finish reason tool_call.
The agent calls the selected tools one after another. In the tree, each tool call is an MCP send tools/call <tool name> span. This span has only the tool name in the span name, the duration, mcp.method.name, jsonrpc.request.id and runtime environment attributes. The tool arguments and results are not in this span.
Find the tool arguments and results in the messages.
| What to find | Where to look |
|---|---|
| The tools and arguments that the model selected | The Output messages of the call that made the tool call decision (tool_call items) |
| The tool results | The Input messages of the next call ("role": "tool" messages) |
| The tools that the model can use | The gen_ai.tool.definitions attribute of the agent span |
Linked traces after a follow-up question
CogentAI can ask the user a question before it answers. When the user answers, the request that processes the answer is recorded as a new trace. The root span of this trace points to the earlier trace with a span link. The root span attribute cogentai.turn.kind is ask_user_answer.
You can find the linked traces in these locations:
- Trace list: a link icon is next to the trace ID. Click the icon to see the linked traces on one screen.
- Trace screen: the Linked traces notice and the View related traces button are shown.
- Root span details: the Linked traces area shows the ID of the earlier trace. Click the ID to open that trace.
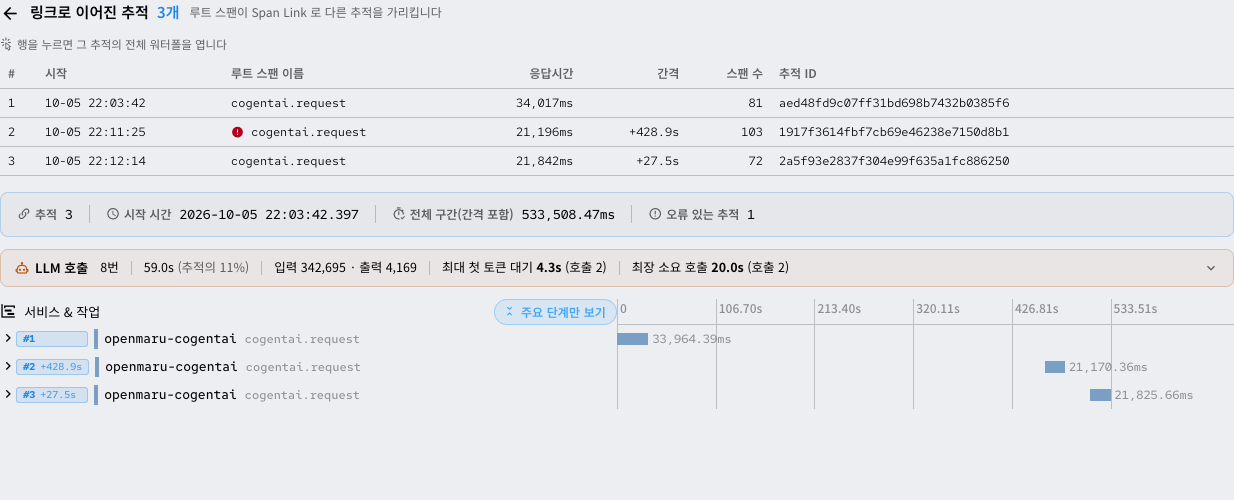
The Linked traces screen shows the linked traces in the order of their start times.
| Area | Description |
|---|---|
| Trace table | Order, start time, root span name, duration, gap after the earlier trace, span count, trace ID. Click a row to open the full waterfall chart of that trace. |
| Summary | Trace count, start time, total span including gaps, traces with errors |
| LLM calls box | The LLM calls of all the traces. The Trace column (#1, #2 …) shows the trace of each call. |
| Waterfall chart | Shows the traces on one time axis, with #number and the gap after the earlier trace (for example, +428.9s). |
The gap is the time from the end of the earlier trace to the start of the next trace. On the screen above, #2 started 428.9 seconds after #1 ended, and #3 started 27.5 seconds after #2 ended. The gap includes the time that the user used to type the answer. Thus the gap is not CogentAI processing time.
Points to note
- Personal data: The input and output messages record the user questions and the model answers as they are. Users who can open the distributed tracing screen can read them. If questions can contain personal data, examine the access permissions for the tracing screen.
- Truncated messages: A message longer than about 64KiB is cut when it is collected. A cut value is not valid JSON, so the screen shows it as one block without indentation. Korean text is shown as text. The input messages of the agent span often keep only the first part (
system,user) because the instructions are long. The LLM gateway span of the same call can keep more, including the tool results (tool). - Tool arguments and results: The tool call span (
MCP send tools/call) does not keep arguments or results. Find them in the messages. If the messages are cut, you possibly cannot find them. - Model name: The agent span shows the model alias, and the LLM gateway span shows the real model name. To find the model, look at the LLM gateway span.
- Token totals: Each span of the same call shows an LLM badge. Do not add the badges to get the token total of a trace. Use the header of the LLM calls box.
Related documents
- Distributed tracing — basic use of the distributed tracing screen, span details, LLM badges
- Log viewer — connecting traces and logs to establish a cause
- Incidents — moving quickly to the traces involved in an incident