6.1. Nodes
The resource status of every monitored node at a glance, and how to install the node agent.
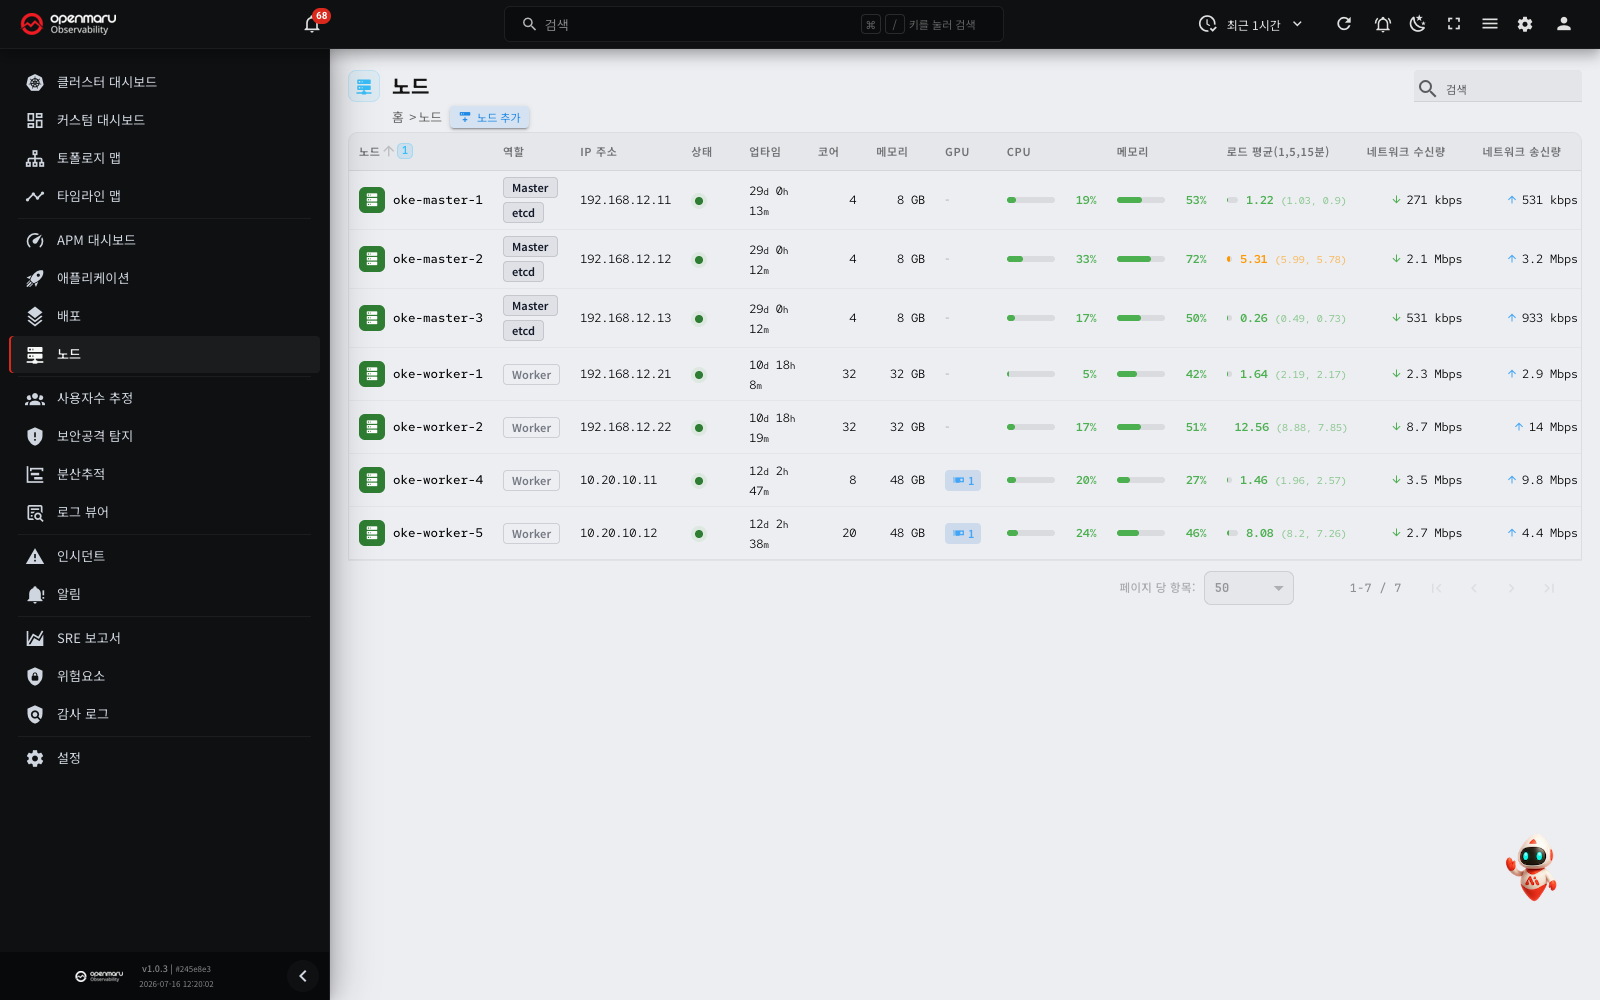
Overview
The Nodes menu lists every node in the Kubernetes cluster along with its live resource usage. You can compare the headline metrics — CPU usage, memory usage, network traffic, load average — directly in the list, and click a node to see its detailed metric charts.
A node without the node agent (openmaru-node-agent) installed appears in the list as Node Unreachable. The node agent is part of the Helm chart and is deployed to every node in the cluster automatically (see the Installation chapter).
Open this screen from the Nodes menu in the left sidebar.
The node list
Screen layout
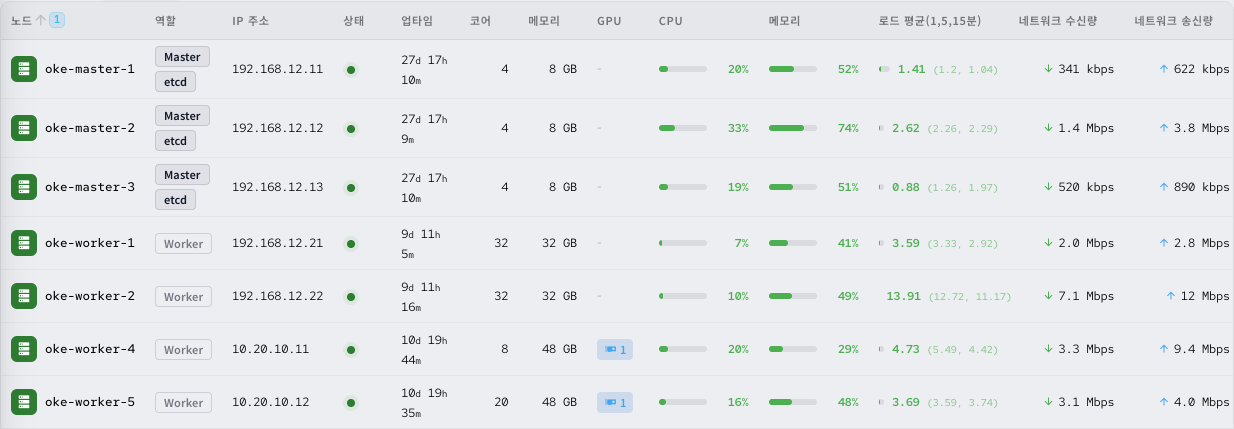
The Nodes screen is made up of the following.
| Area | Description |
|---|---|
| Search field | At the top right of the screen. Type a node name or IP address to filter the list quickly (it also matches other column values such as role and state). |
| Node list table | Each node's state and resource usage, by column. |
Node list columns
| Column | Description |
|---|---|
| Node | The node's name, with a colour icon for its state. Click it to open that node's detail page. |
| Role | The node's Kubernetes role (control-plane, worker and so on). |
| IP Address | The node's IP address. Click it to open that node's detail page. |
| Status | The node's current state, as a colour dot. |
| Uptime | How long the node has run without interruption (days, hours, minutes). |
| Core | The number of CPU cores. |
| Memory Size | Total memory capacity. |
| GPU | The number of GPUs. Nodes without one show -. |
| CPU | Current CPU usage (%), as a bar and a figure. |
| Memory | Current memory usage (%), as a bar and a figure. |
| Load Average(1,5,15m) | The 1-minute load average (primary) with the 5- and 15-minute values (secondary), shown with a bar. |
| Network Rx | Current network receive (Rx) traffic, with a down arrow icon. |
| Network Tx | Current network transmit (Tx) traffic, with an up arrow icon. |
Node states
Node states are as follows.
| Status | Colour | Description |
|---|---|---|
| Up | Green | The node agent is working and metrics are being collected |
| Down (no metrics) | Red (blinking) | No metrics are arriving. The node or the agent may have failed |
| Node Unreachable | Red (blinking) | The node exists in the Kubernetes cluster but the node agent is not installed |
Note: the CPU and memory usage bars change colour with the level of use, from normal (green) to warning (orange) to critical (red). CPU turns to warning at 70% and critical at 85%; memory turns to warning at 75% and critical at 90%. The load average turns to warning (orange) at 1× the core count and critical (red) at 2×.
Main features
Searching for a node
To find a particular node quickly:
- Type a node name or IP address into the search field at the top right (it also matches other column values such as role and state).
- Only the nodes matching your text remain in the list.
- Click the
xbutton to the right of the search field to reset the search.
Sorting columns
To sort the nodes by a particular metric:
- Click a column header at the top of the table (CPU, Memory, Load Average(1,5,15m) and so on).
- Click the same header again to switch between ascending and descending.
- You can sort by several columns at once.
Tip: sorting the CPU column descending gets you quickly to the nodes with the highest CPU usage.
Installing the node agent
The node agent is part of the main Helm chart and is deployed automatically to every node in the cluster as a DaemonSet. Installing the Helm chart puts the agent on each node; there is nothing to do in the UI. For installation and configuration (including setting the Observability URL and API key), see the Installation chapter.
Note: a node without the node agent appears in the list as Node Unreachable, and no detailed metrics such as CPU and memory are collected for it. Where you see this, check that the node agent DaemonSet pod deployed correctly on that node.
Going to a node's detail page
To see a particular node's detailed metrics:
- Click the node name or IP address in the list.
- That node's detail page opens.
The node detail page
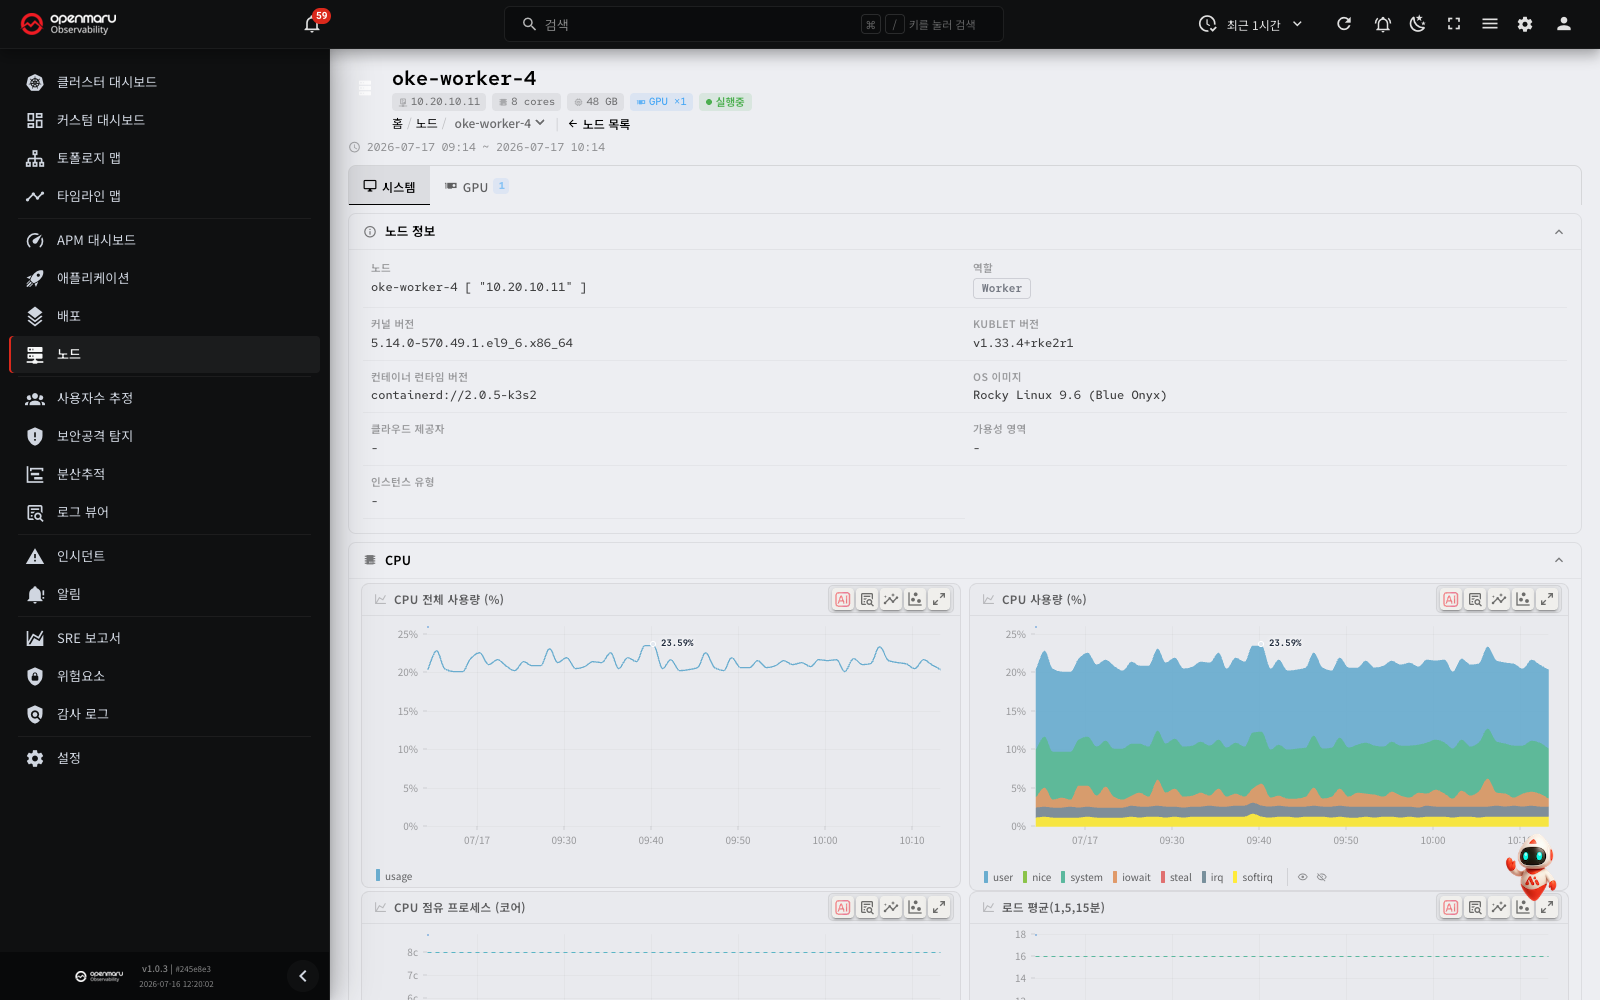
The node detail page carries the selected node's system information and its time-series metric charts.
Header and basic information
The node's basic information appears at the top of the page.
| Item | Description |
|---|---|
| Node name | The name of the selected node |
| IP address | The node's IP address |
| Cores | The number of CPU cores |
| Memory | Total memory capacity |
| GPU | The number of GPUs (shown only where the node has one) |
| Status | The node's current state (Up, Down (no metrics), Node Unreachable) |
Click the node name dropdown in the breadcrumb area to switch to another node quickly. Click the Nodes link to return to the node list.
Note: where the query time range is longer than three days, it is limited automatically to the last three days. The time range bar at the top shows the range actually being queried, with a 3d limit badge where the limit applied.
Where a node is not responding (powered off, disconnected from the network) or has no node agent installed, a message explains that the node exists in the Kubernetes cluster but its metrics cannot be collected.
System tab
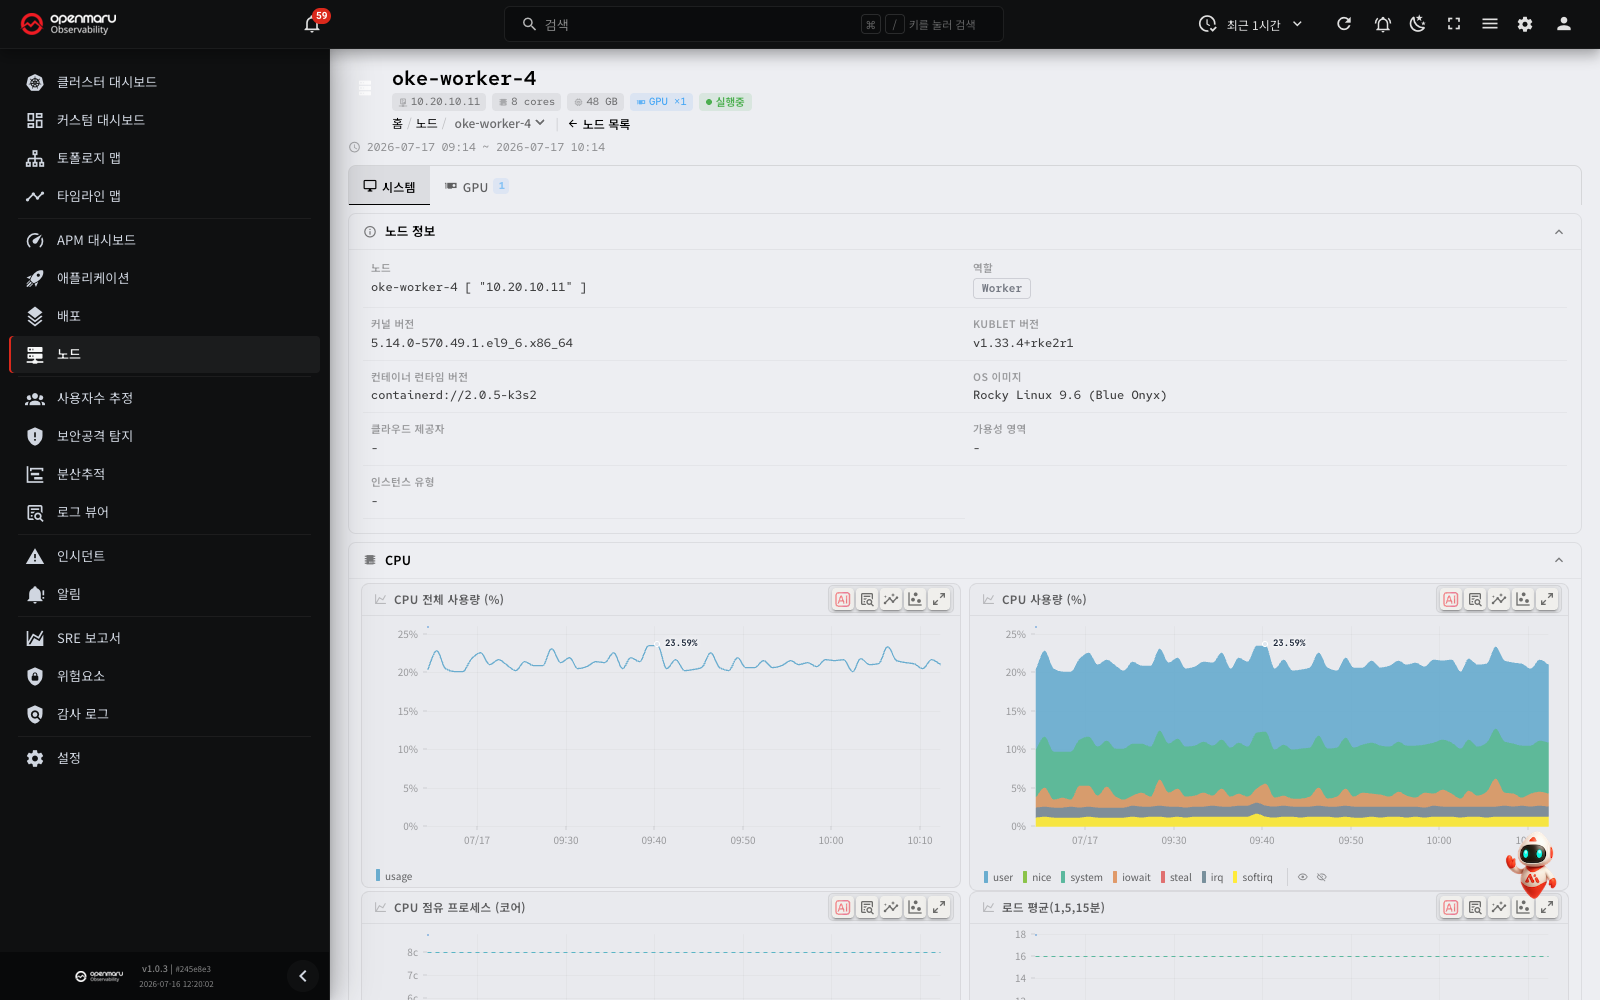
The System tab carries the node's system resource metrics.
Server Info
The Server Info section is expanded by default; click its header to collapse or expand it. It carries the following.
| Item | Description |
|---|---|
| Node | The node name and IP address |
| Role | The node's Kubernetes role (control-plane, worker and so on) |
| Kernel Version | The Linux kernel version |
| Kubelet Version | The Kubernetes kubelet version |
| Container Runtime Version | The container runtime (containerd, for example) |
| OS Image | The operating system image name (Rocky Linux 9.5, for example) |
| Cloud Provider | The cloud environment, where applicable |
| Availability Zone | The cloud availability zone, where applicable |
| Instance Type | The cloud instance type, where applicable |
System metric sections
Click a section header to expand or collapse its charts.
| Section | Metrics included |
|---|---|
| CPU | Overall CPU usage (%), CPU usage detail (user, nice, system, iowait, steal, irq, softirq and so on), top CPU processes, and the load average (1, 5, 15 min) time series |
| Memory | Memory usage and free space over time |
| Network | Receive and transmit traffic per network interface |
| Disks | Disk read and write throughput, disk usage, and I/O utilization |
Tip: the CPU, memory, network and disk sections are expanded by default. Leaving only the sections you need expanded helps you concentrate on the metrics you want.
For how to work the charts (zoom, legend toggling, full screen and so on), see Using charts.
GPU tab
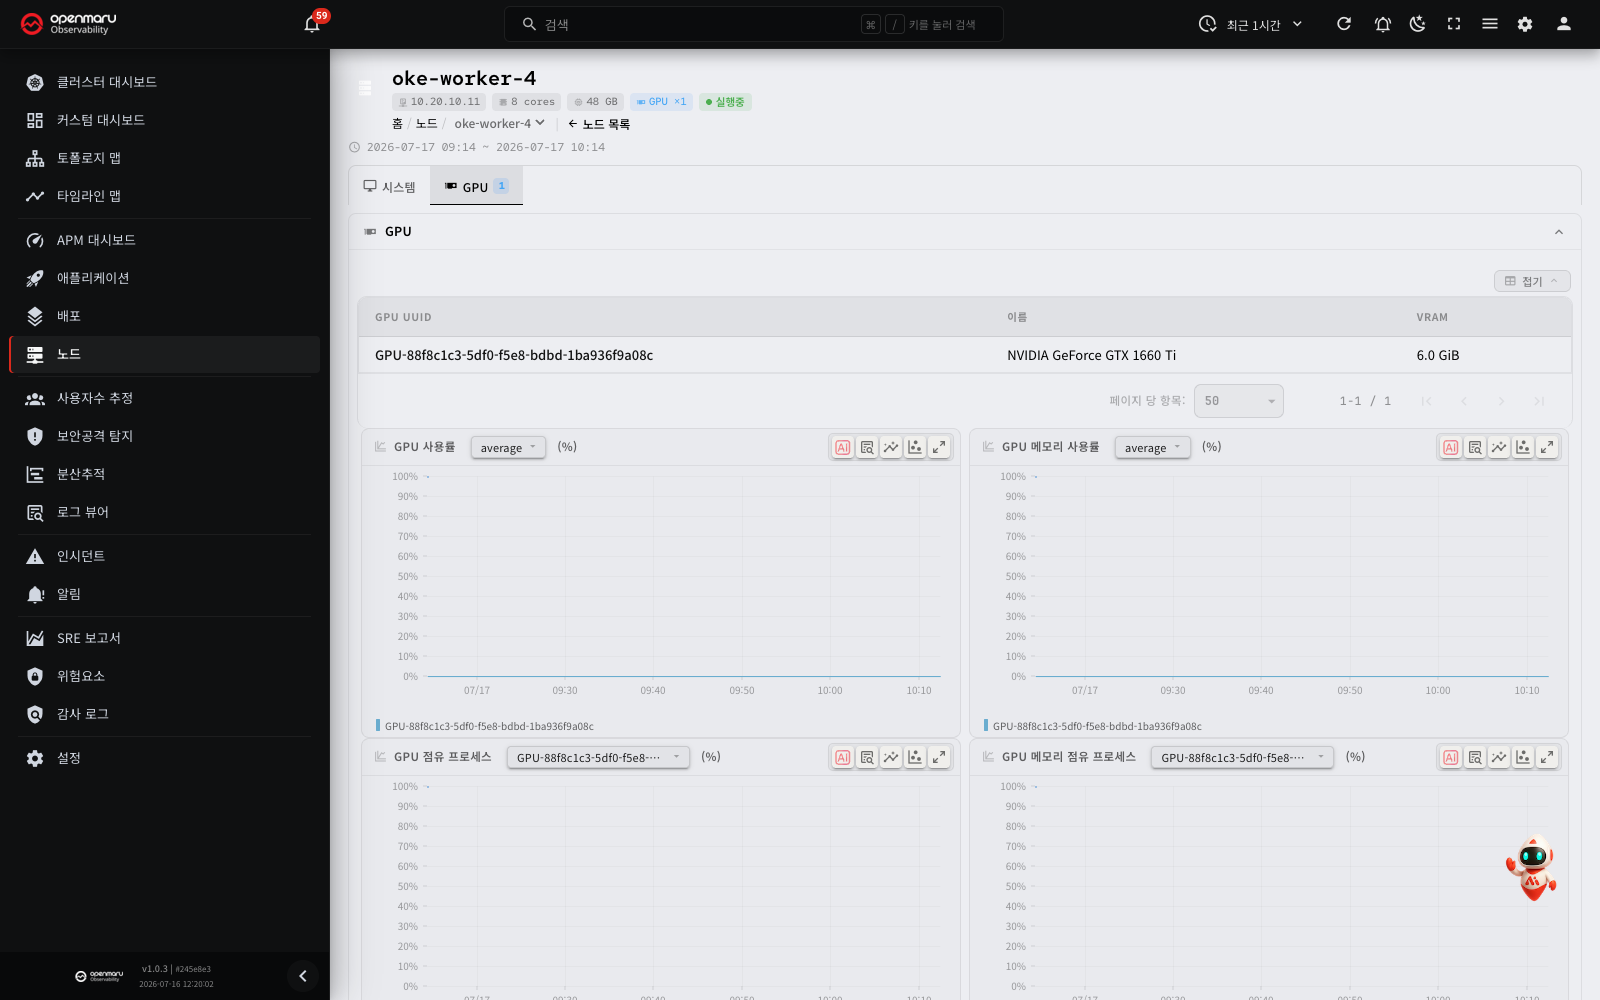
The GPU tab is enabled only on nodes fitted with a GPU. A badge beside the tab gives the number of GPUs.
You can open the GPU tab directly from its address. Add /gpu to the end of the node details address (for example, /p/<project ID>/nodes/<node name>/gpu). When the GPU tab is open, a page refresh or a shared address opens the GPU tab again. When you go to a different screen and then go back, the GPU tab opens again. A tab change does not add an entry to the browser history.
The GPU tab has two sections. The GPUs section is expanded. The GPU memory bandwidth section is collapsed.
| Section | Item | Description |
|---|---|---|
| GPUs | GPU table | GPU UUID, name and vRAM (the total GPU memory size) |
| GPUs | GPU Utilization | GPU core utilization (%) over time. Select average or peak |
| GPUs | GPU Memory Usage (%) | The part of GPU memory that processes hold, over time. It is the used bytes divided by the total size |
| GPUs | GPU Consumers | Stacked GPU utilization (%) per container that uses the GPU |
| GPUs | GPU Memory Consumers | Stacked GPU memory size (bytes) per container that holds GPU memory |
| GPUs | GPU Temperature (℃) | GPU temperature over time |
| GPUs | GPU Power (W) | GPU power consumption over time |
| GPU memory bandwidth | GPU Memory Bandwidth Utilization | The part of time (%) in which GPU memory is read or written, over time. It shows how frequently memory is read and written, not how much memory is held |
Note: a server such as vLLM reserves GPU memory when it starts. On a node with such a server, GPU Memory Usage (%) stays high at all loads. This is normal.
Unified memory GPUs
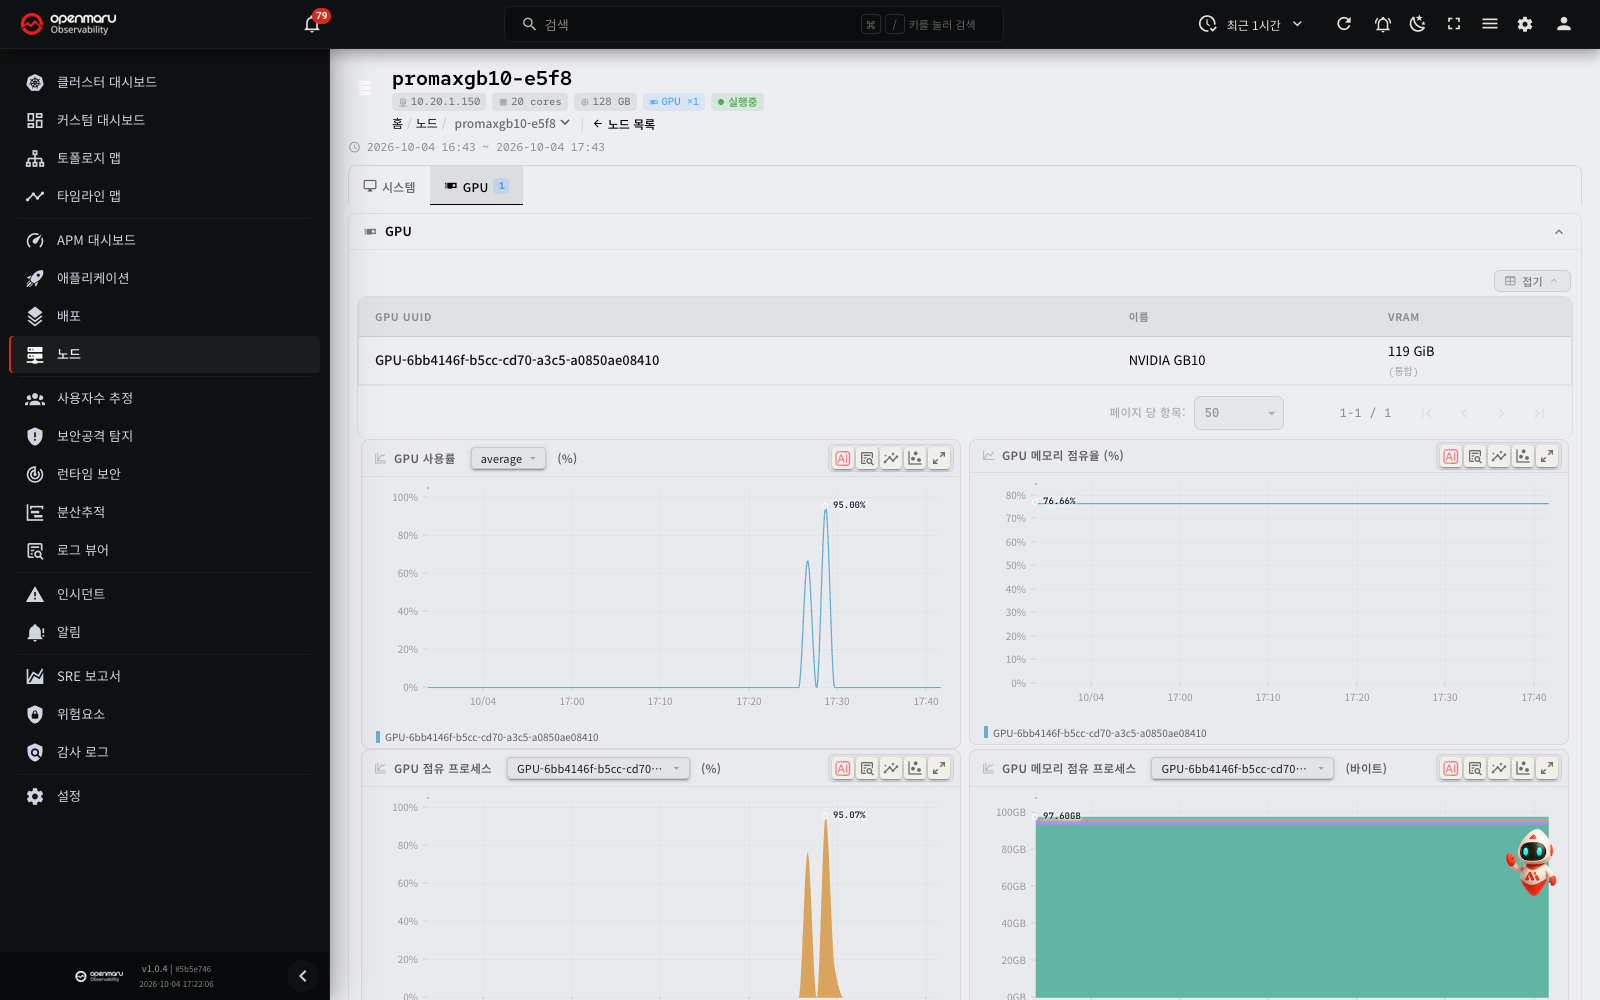
On a device where the CPU and the GPU share memory (unified memory), such as NVIDIA GB10, the tab shows these differences:
- The vRAM cell of the GPU table shows the total node memory size with (unified).
- GPU Memory Usage (%) uses the total node memory size as the denominator. This denominator also includes memory that CPU programs use. Thus the percentage can be lower than the real free space suggests. Also examine the byte values in the GPU Memory Consumers chart and the memory usage in the System tab.
- The GPU memory bandwidth section shows "Not supported on this device" instead of a chart. This device does not supply bandwidth values.
Note: on nodes without a GPU, the GPU tab is disabled. If you add
/gputo the address of a node without a GPU, the System tab opens.
Related documents
- Dashboard — overall cluster resource status
- Using charts — working the charts (zoom, legend, full screen and so on)
- Settings — managing the node agent API key
- Installation — the agent installation guide