4.3. Deployments
A table of each application's deployment history and the effect each deployment had on the service.
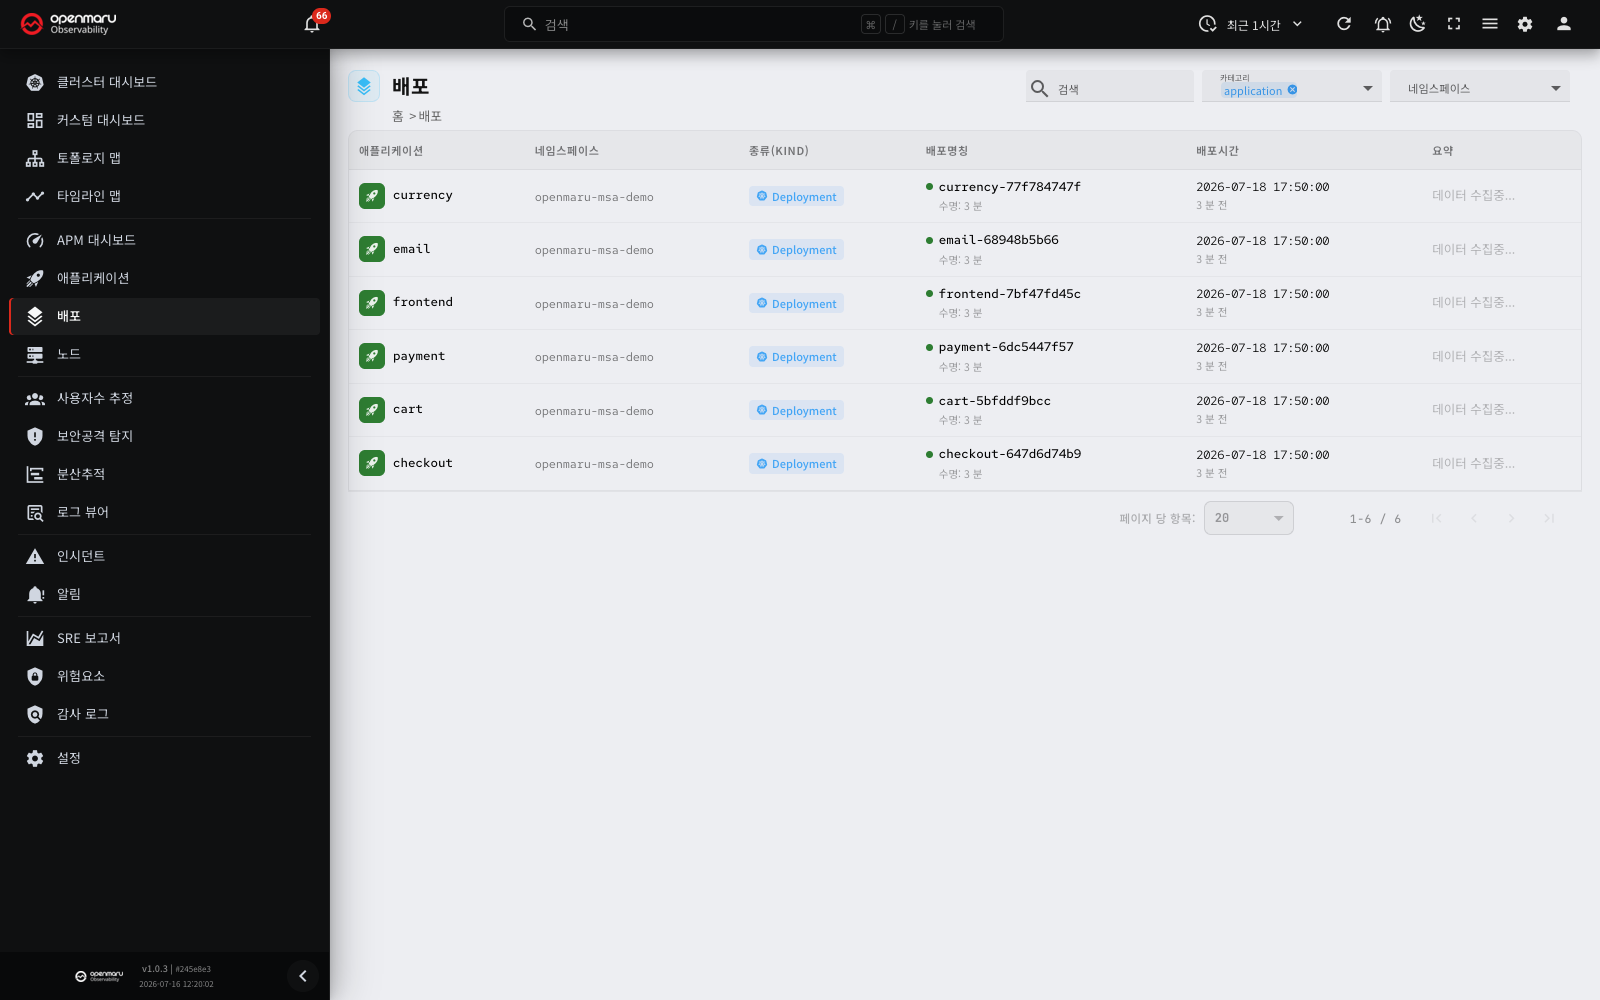
Overview
The Deployments menu shows the full deployment history of the applications running on your Kubernetes cluster. OPENMARU Observability detects application rollouts automatically from Kubernetes metadata, with no separate integration into your CI/CD tooling.
Alongside the basics of each deployment — version, time, how long ago — it summarises how the service's state changed afterwards. You can see at a glance whether availability or response time suffered right after a new version went out, whether CPU and memory usage shifted, and whether container restarts or log errors increased, which lets you verify a deployment's stability quickly.
Click Deployments in the left sidebar to reach this screen.
Screen layout
The Deployments page is made up of the following areas.
| Area | Description |
|---|---|
| Top header | The page title and the application filters (search, namespace, category) |
| Deployment history table | Every deployment, with its status and summary |
| Pagination | Changes the items per page and moves between pages |
How to read the deployment history table
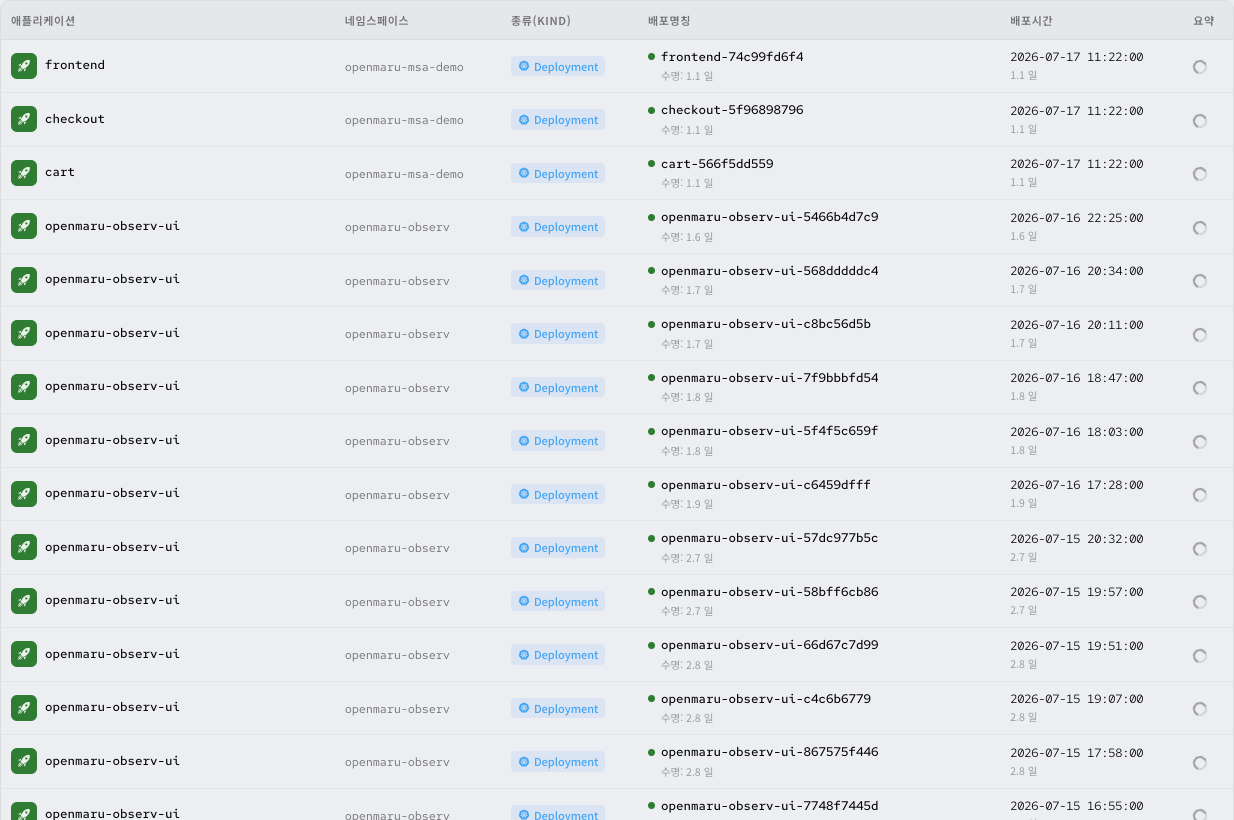
The deployment history table lists every detected deployment in time order. Each row is one deployment, with the following columns.
| Column | Description |
|---|---|
| Application | The name of the application deployed. The icon colour follows the deployment's status. Click it to open that application's detail page. |
| Namespace | The namespace the application belongs to |
| Kind | The Kubernetes workload kind (Deployment, StatefulSet and so on). Kubernetes resources get a blue badge, external services a green one. |
| Deployment | The version deployed (its image tag and so on) and the current deployment's age. The round indicator to the left of the version shows the deployment status. Click it to open that application's detail page. |
| Deployed | The date and time the deployment ran (for example 2026-03-15 14:30:00), and how long ago that was (for example 2.1 days ago) |
| Summary | The automatic analysis of how the service's state changed after the deployment |
Sorting the table
Click a column header to sort by it, ascending or descending. Clicking several columns in turn sorts by more than one.
Tip: click the Deployed column to sort newest first and find the most recent deployment quickly.
When there is no data
Where no deployment has been detected on the cluster, the table reads "No Deployments detected". Check that the cluster agent is installed correctly.
Checking deployment status

Each deployment's status is shown by the icon colour in the Application column and the round indicator in the Deployment column.
| Status | Colour | Meaning |
|---|---|---|
| Healthy | Green | The deployment completed normally and the service has no problems |
| Warning | Yellow | A change needing attention was detected after the deployment |
| Critical | Red (blinking) | A serious problem was detected after the deployment and needs immediate action |
What the status icons mean
- Application column: a healthy deployment gets a green rocket icon; a warning or critical state gets an alert icon in yellow or red. In a critical state the icon blinks, so you notice it quickly.
- Deployment column: a small round indicator to the left of the version name carries the deployment's status colour (green, yellow or red).
Note: the status colours in the two places reflect the same deployment analysis. When scanning the table quickly, look into any deployment whose colour is not green.
Comparing before and after — the summary
The Summary column shows an automatic analysis of how the service's state changed after the deployment. OPENMARU Observability collects about 30 minutes of data after a new version goes out and compares it against the previous deployment. The items analysed are the SLOs (service level objectives), log errors, container restarts, CPU usage and memory usage.
Deployment result
| Summary message | Meaning |
|---|---|
| The service has been successfully deployed | The deployment completed normally and the service has no problems |
| The deployment has been cancelled | The deployment process was interrupted |
| The rollout is in progress | The new version's pods are gradually replacing the old ones |
| No notable changes | No meaningful change was detected against the previous deployment |
Note: a rollout is the Kubernetes deployment process in which the new version's pods gradually replace the old ones. Where a rollout runs on and on, check for a container image problem or a pod scheduling problem.
SLOs
| Summary message | Meaning |
|---|---|
| Availability (actual) (objective (target)) | The availability SLO compliance rate after the deployment, against the target |
| Latency (actual) of requests faster (value)ms (objective (target)) | The response time SLO compliance rate after the deployment, against the target |
A warning icon on an SLO item means the SLO is being breached after the deployment. A healthy item gets a check icon.
Resource changes
| Summary message | Meaning |
|---|---|
| CPU usage: N% compared to the previous deployment | The change in CPU usage against the previous deployment |
| Memory usage: N% compared to the previous deployment | The change in memory usage against the previous deployment |
| Memory looks like the memory leak has been fixed | The memory leak detected in the previous deployment is gone |
| Memory a memory leak detected (N% per hour) | Hourly memory usage keeps rising, suggesting a leak |
| Memory app containers have been restarted N time by the OOM killer | The container was force-restarted by an out-of-memory kill |
Stability
| Summary message | Meaning |
|---|---|
| Crash app containers have been restarted N times | The container terminated abnormally and restarted after the deployment |
| Logs there are errors in the logs | Errors were detected in the application logs after the deployment |
| Logs there are no more errors in the logs | The log errors present in the previous deployment are gone |
| Logs the number of errors in the logs has (increased/decreased) by N% | The log error count against the previous deployment, and the change |
Looking into a summary item
Where a summary item carries a magnifier icon, hovering reveals it and clicking takes you to that application's detail page, where you can compare the metrics before and after the deployment on charts.
Note: because the summary is produced by analysing data collected after the deployment, a loading indicator may appear immediately afterwards. Within the first 30 minutes there is not yet enough data, and the message "Not enough data due to the lifetime < 30 minutes" may be shown.
Application filters
Use the application filters at the top right of the page to narrow the deployment history. Combine the following conditions to show only the deployments you want.
| Filter | Description |
|---|---|
| Search | Type an application name to find it quickly |
| Namespaces | Shows only applications in particular namespaces. Several namespaces can be selected at once |
| Categories | Filters by application category |
Tip: combining namespace and category lets you concentrate on the deployment history of the applications one team owns.
Pagination
Where there is a lot of deployment history, the pagination below the table changes the items per page to 10, 20, 50, 100 or all. The default is 20.
Going to the application detail page
Click an application name or a deployment (version) in the list to open that application's detail page, where you can check the following.
- SLO status: actual compliance against the availability and response time targets
- CPU and memory trends: charts of how resource usage changed either side of the deployment
- Logs: the error log patterns after the deployment
- Distributed tracing: how the response time distribution changed after the deployment
- Instance status: pod restarts, OOM events and so on
Tip: where you suspect a problem after a deployment, look at the status light (green, yellow or red) to the left of each report tab on the detail page. It shows you quickly which area has the problem.
Worked examples
Verifying stability after deploying a new version
- Click the Deployments menu in the sidebar.
- Click the Deployed column to sort newest first.
- Find the row for the application you just deployed and read its Summary column.
- A summary reading "The service has been successfully deployed" means the deployment completed stably.
- Where there is a warning message, click that item's magnifier icon to analyse the metric in detail.
Tracking a performance regression caused by a deployment
- On the Deployments screen, select the application with the application filters.
- Compare the CPU and memory change rates and the SLO compliance rates in each deployment's Summary column.
- Click the application name on the row where performance regressed to open the detail page.
- On the detail page, analyse the change against the previous deployment through the CPU, memory and response time charts.
Checking for a failed deployment or a stuck rollout
- On the Deployments screen, look for rows with a red (critical) or yellow (warning) status.
- Check whether the Summary column reads "The deployment has been cancelled" or "The rollout is in progress".
- Where a rollout has been running for a long time, check for a container image or resource allocation problem.
Related documents
- Applications — detailed metrics and SLO status for the deployed application
- Incidents — the incidents raised by SLO breaches after a deployment
- Timeline map — how deployments and incidents relate in time order
- Settings — configuring inspection conditions — setting SLO thresholds and inspection conditions