2.1. Quick Start
The shortest path from installing OPENMARU Observability to seeing your first monitoring data.
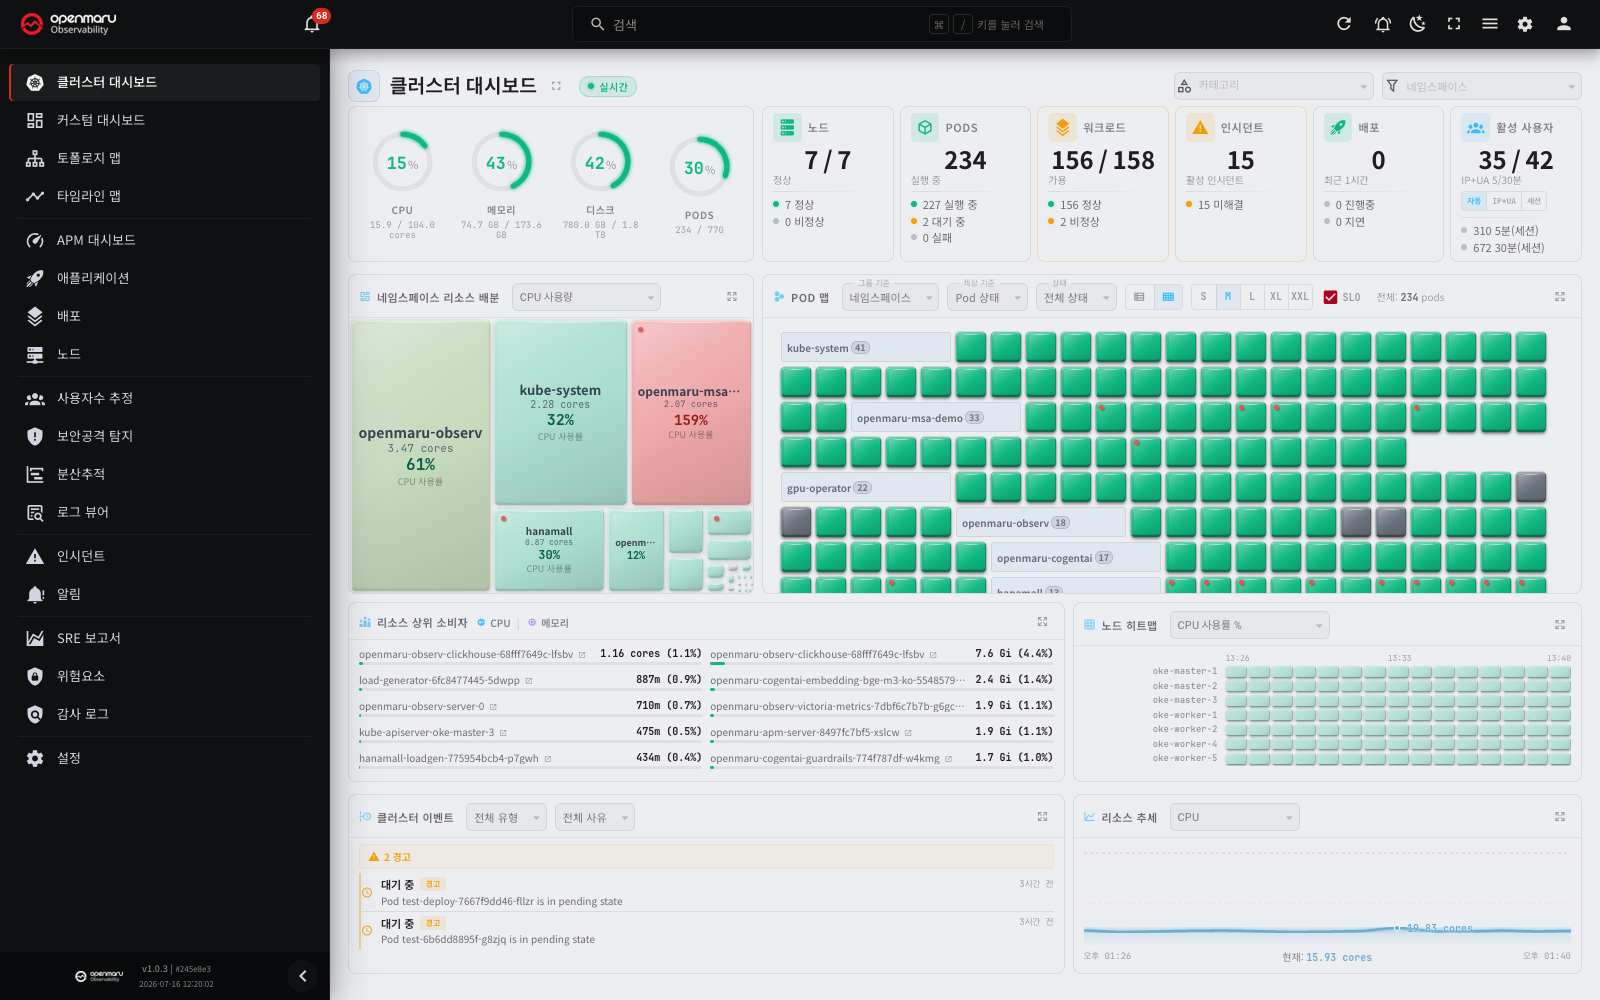
Overview
This guide is for operators adopting OPENMARU Observability for the first time. It walks step by step through installing on a Kubernetes cluster with Helm and confirming your first data on the dashboard.
The whole process takes about 15 to 30 minutes.
Screens you will use
These are the main screens you meet during the quick start.
| Screen | Description |
|---|---|
| Login | Sign in with your email and password |
| Settings > General | Check server status and manage API keys |
| Cluster Dashboard | The main screen that monitors the whole cluster in real time |
| Applications | The list and status of monitored applications |
Main steps
Installation
If you build your platform with OPENMARU COP (Container Orchestration Platform), OPENMARU Observability and its components are installed and configured automatically — no separate installation is needed.
To add OPENMARU Observability to a Kubernetes cluster you already run, install it with the Helm chart. For the full procedure — system requirements (OS, kernel, Kubernetes, storage), values.yaml settings, resource requirements and the components that get installed — see Installation.
When installation finishes and every Pod is healthy, move on to the next step.
First access and login
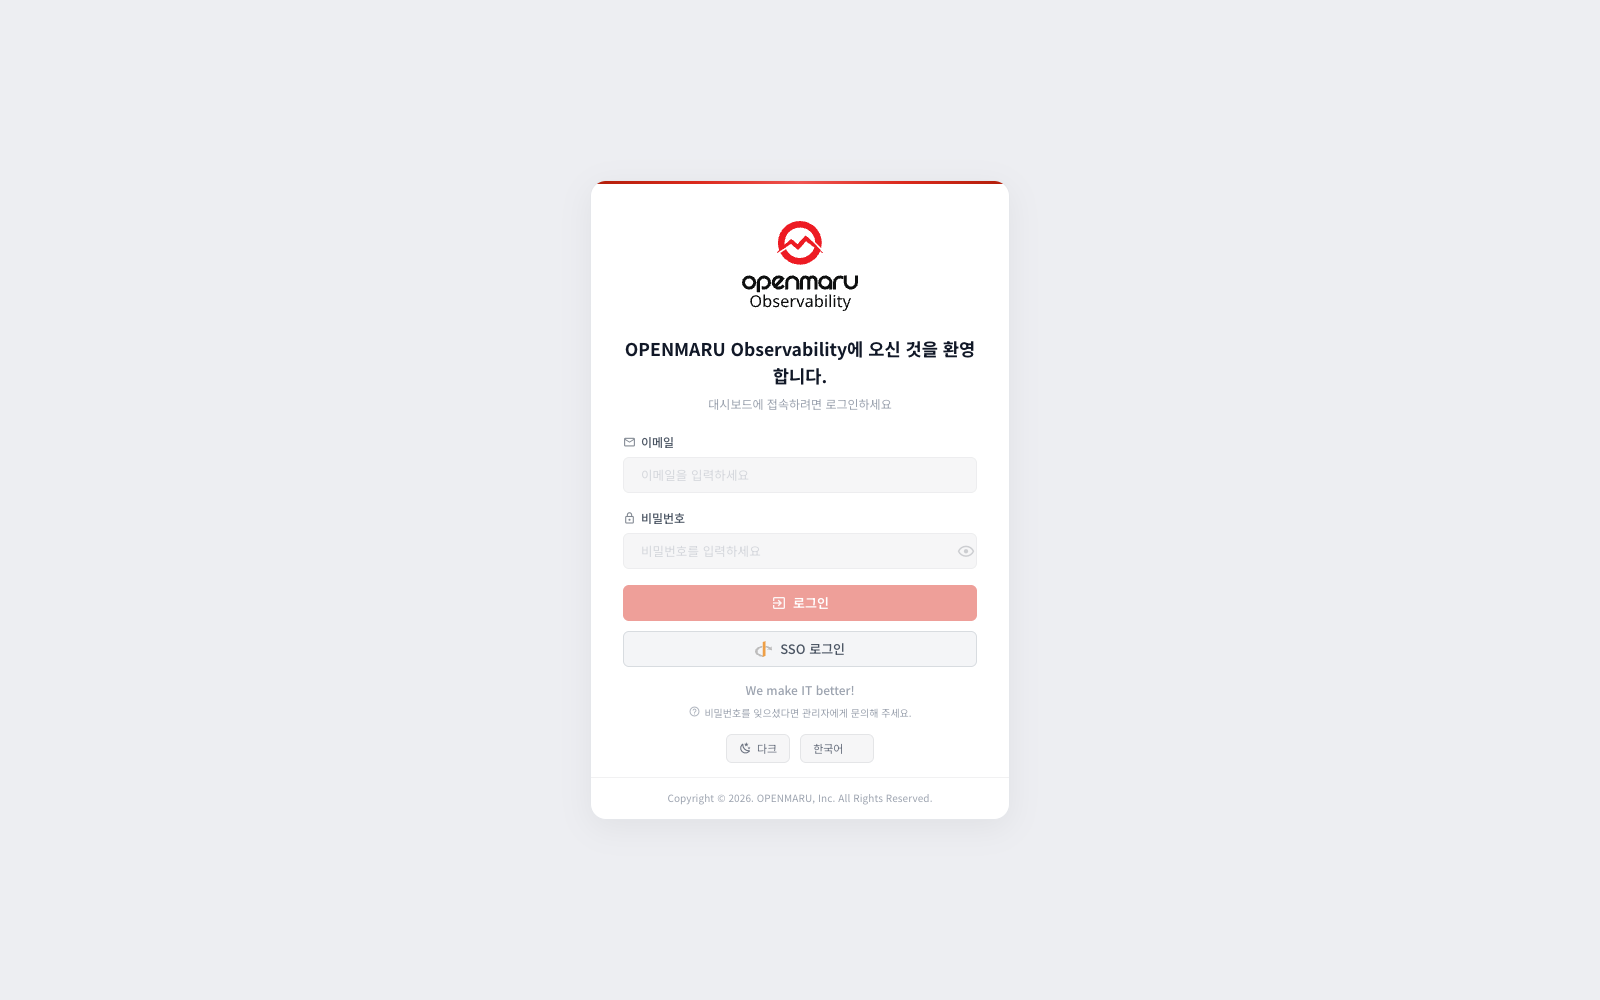
Open the address you configured on the Ingress in a browser.
- On first access the administrator password setup screen appears. Enter a password in Password and type the same password again in Confirm password.
- Click Set Admin Password and Login. The administrator account is created and you are signed in automatically.
- On later visits, enter your Email and Password on the login screen and click Login.
Note: in an environment with SSO (Single Sign-On) configured, a separate Log in with SSO button is shown. Ask your administrator about SSO configuration.
Issuing an API key and connecting agents
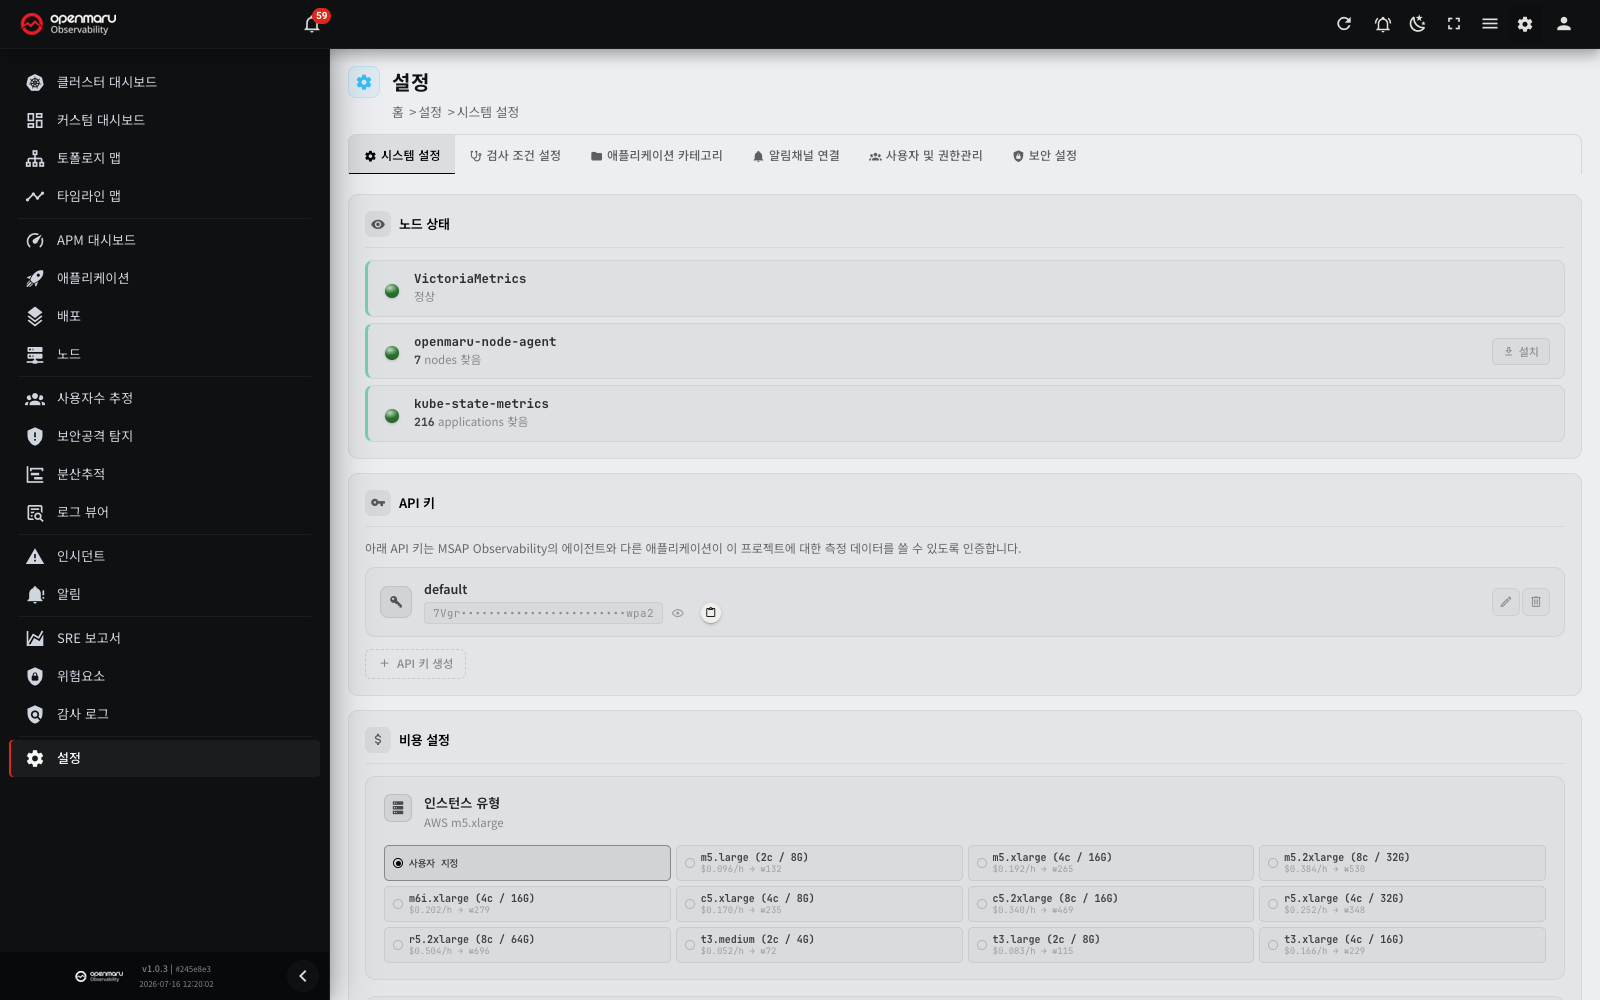
Issue the API key that the cluster agent and node agent use when they send data to the Observability server.
Issue the API key
- Click Settings at the bottom of the left sidebar.
- In the API keys section of the General tab, click Generate API key.
- Enter a description for the key (for example
cluster-agent) and click Generate. - Click the copy button next to the issued key.
Important: the API key authenticates agents when they send data to the server. Keep it somewhere safe.
Set the API key on the agents
Add the issued key to values.yaml and run a Helm upgrade.
openmaruClusterAgent:
  config:
    api_key: "<the API key you issued>"
helm upgrade openmaru-observ openmaru-observ/openmaru-observ \
  --namespace openmaru-observ \
  -f values.yaml
Note: the agent Pods restart after the Helm upgrade, and it takes about one to two minutes before data is collected.
Check node status
After setting the API key, check each component in the Server Status section of Settings > General.
| Item | Healthy state |
|---|---|
| VictoriaMetrics | Healthy |
| openmaru-node-agent (node agent) | Node count shown (for example 7 nodes Found) |
| kube-state-metrics | Application count shown (for example 221 applications Found) |
When every item shows a green status indicator, data collection is running normally.
Seeing your first data
Once the agents are connected, you can see data on the dashboard.
Check the dashboard
- Click Cluster Dashboard in the left sidebar.
- When the Live badge at the top turns green, real-time data is arriving.
- Check CPU, memory, disk and Pod usage on the cluster resource gauges.
- Check nodes, Pods, workloads, incidents and deployments on the cluster status cards.
The dashboard shows the following at a glance.
| Area | What you see |
|---|---|
| Resource gauges | Overall usage for CPU, memory, disk and Pods |
| Status cards | Counts and status summaries for nodes, Pods, workloads, incidents and deployments |
| Namespace treemap | How resources are distributed across namespaces |
| Pod map | The state of every Pod, visualised as tiles |
Check applications
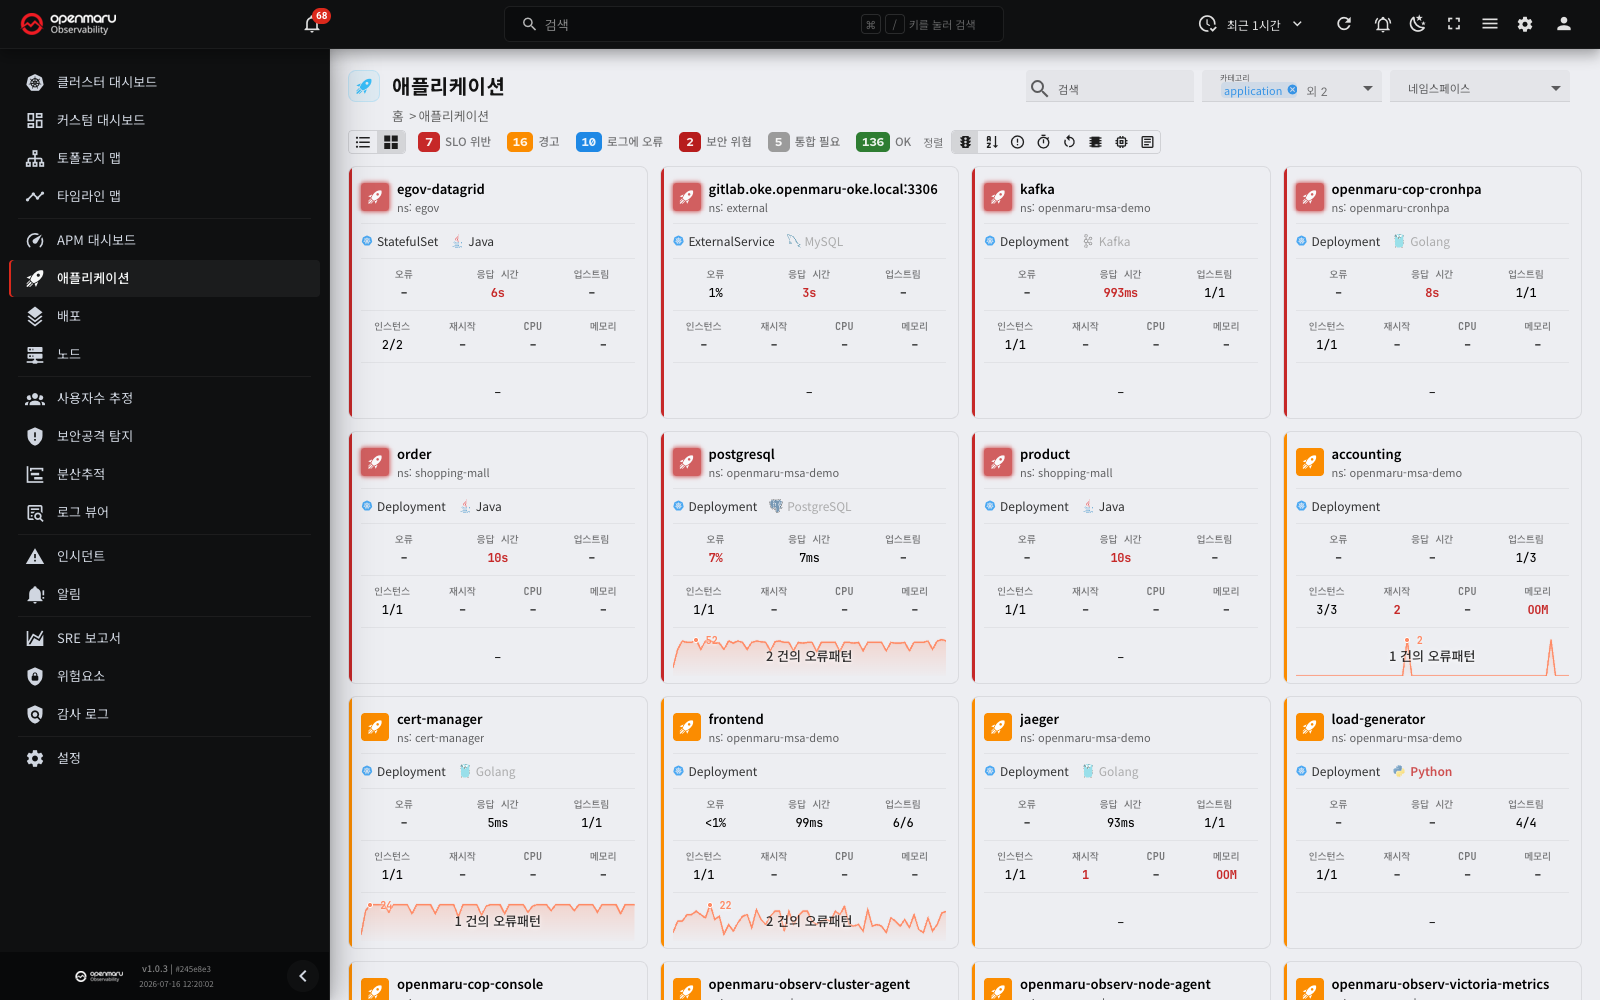
- Click Applications in the left sidebar.
- The list of monitored applications appears. For each one you can see status, errors, latency and instance count.
- Click an application to open its detail page, where you can see CPU, memory, SLO (Service Level Objective) and other detailed metrics.
Check nodes
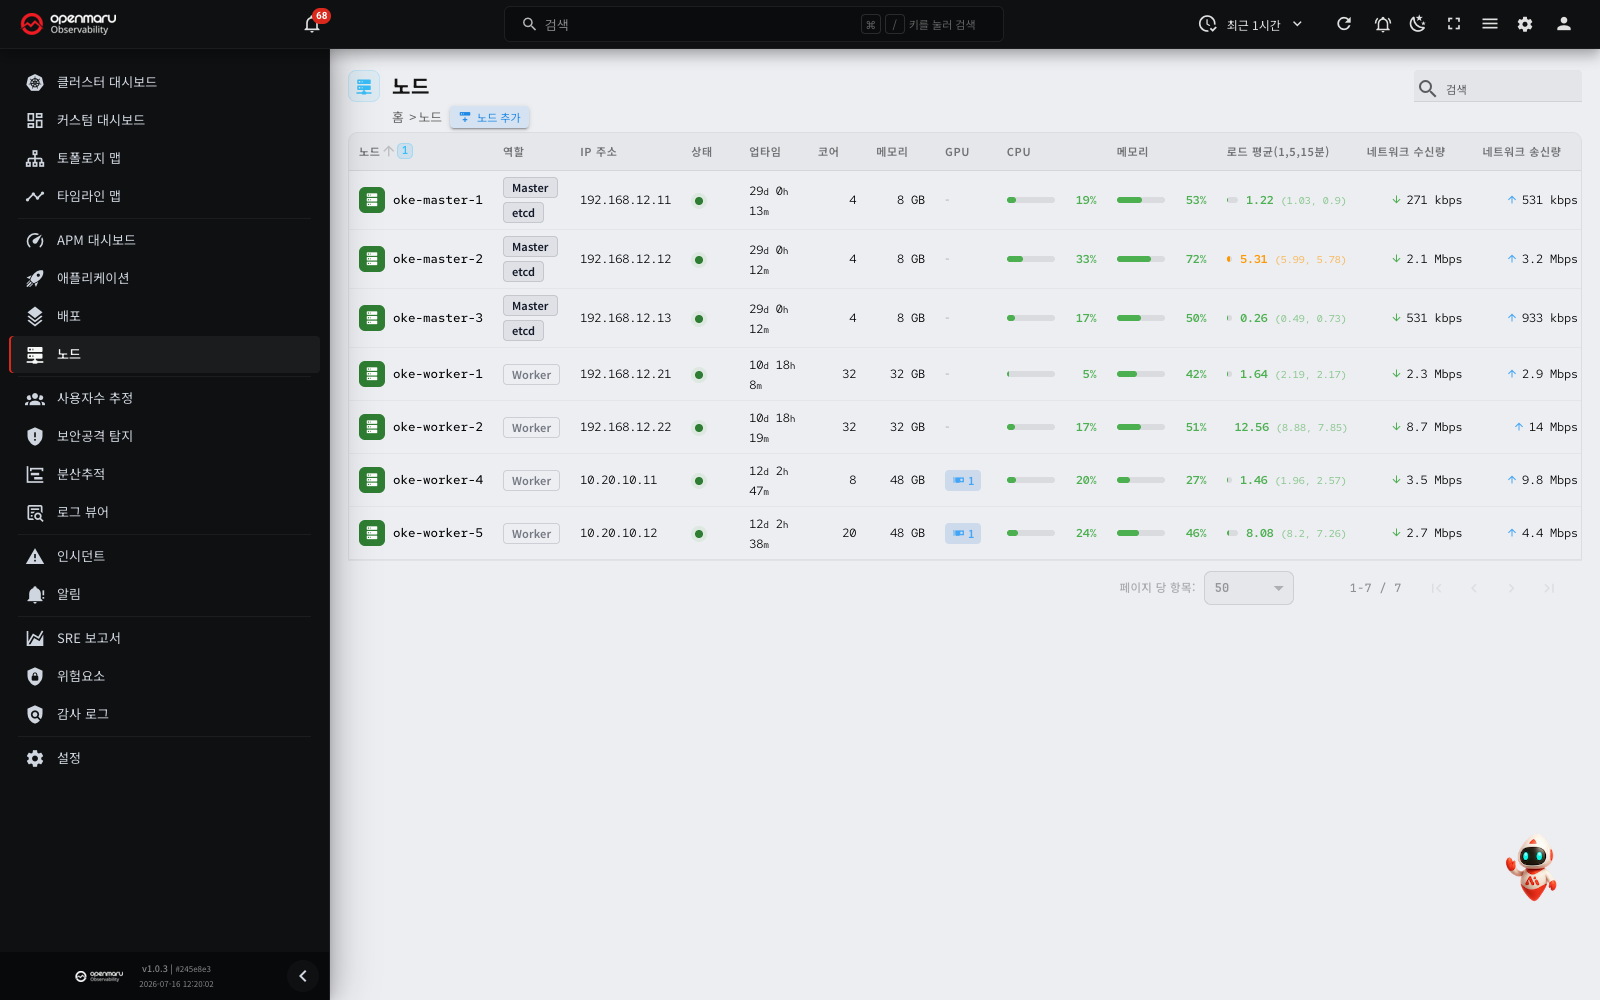
- Click Nodes in the left sidebar.
- The nodes where the node agent is installed are listed, with CPU usage, memory usage and network state for each.
- Click a node to open its detail page and see the system metric charts.
Tip: if no data appears, check the following.
- Every Pod is
Running:kubectl get pods -n openmaru-observ- The cluster agent has the correct API key
- The node agent Pod logs show no errors:
kubectl logs -n openmaru-observ <agent-pod-name>
Next steps
The basic installation is done. Setting up the features below gives you a richer monitoring environment.
| Feature | Description | Reference |
|---|---|---|
| Notifications | Receive incident alerts over Slack, Teams or webhook | Settings |
| Inspections | Set thresholds for CPU, memory, response time and more | Settings |
| Distributed tracing | Collect detailed traces with the OpenTelemetry SDK | Distributed tracing |
| Organization | Add team members and configure role-based access control (RBAC) | Settings |
Related documents
- Installation — installation options in detail
- Dashboard — using the Kubernetes dashboard
- Applications — application monitoring in detail
- Topology map — visualising dependencies between services
- Settings — the full settings guide
- Troubleshooting — resolving problems during installation and operation