7.1. User estimation
Estimating the number of active users in real time by analysing HTTP traffic.
Overview
User estimation analyses the HTTP traffic entering a Kubernetes cluster to estimate, in real time, how many users are currently using the service. Without a separate analytics tool or a client SDK embedded in your code, you get the scale of concurrent users, the trend in daily, weekly and monthly active users (DAU/WAU/MAU), and their geographic distribution, all at a glance.
Open it from the User Estimation menu in the left sidebar. The current active user count also appears on a status card on the Kubernetes dashboard; click the card to reach this screen.
What server-side estimation gives you
The major APM and monitoring platforms require a client-side SDK (RUM) embedded in your application to count users. Observability's user estimation, by contrast, works server-side with eBPF, which differs as follows.
| Item | RUM (other products) | eBPF server-side (Observability's user estimation) |
|---|---|---|
| Extra instrumentation | An SDK must go into every app | None (just the agent on each node) |
| Coverage | Browser web apps only | Every HTTP service (APIs and mobile backends included) |
| Effect of ad blockers | 25–60% of data can be lost | None |
| GDPR cookie consent | Nothing collected where consent is refused | None, since processing is server-side |
| Accuracy | Very high (where the SDK runs) | High (session-based) to moderate (IP+UA-based) |
| Cost | Rises in proportion to user count | No additional cost |
How the estimate works
User estimation uses the HyperLogLog (HLL) probabilistic data structure, at 14-bit precision. Each node agent extracts either the session ID or the IP + User-Agent combination from HTTP requests through eBPF, compresses it into an HLL sketch and sends it to the server. The server merges the HLL sketches from every node to estimate the number of unique users.
This produces an estimate rather than an exact count, but it is memory-efficient and stays stable under heavy traffic. Over WebSocket, the initial load completes within a second and only changed data refreshes automatically, every 10 seconds thereafter.
Two estimation methods
User estimation supports two methods and the system picks the better one automatically.
| Method | Identified by | Accuracy | When it applies |
|---|---|---|---|
| Session ID | The session cookie (JSESSIONID, PHPSESSID and so on) | High | Session coverage above 80% |
| IP+UA | The client IP plus the User-Agent | Moderate | Session coverage at or below 80% (the fallback) |
- Session coverage is the proportion of all requests that carry a session cookie.
- Where session coverage passes 80%, session ID estimation is chosen automatically.
- In environments with no session cookies (API servers, for instance), IP+UA estimation is used.
Note: with IP+UA estimation, different users behind the same network (a corporate NAT, say) may be counted as one, and one user who changes browser may be counted as two.
Important: the X-Forwarded-For header must be configured User estimation and the geographic distribution both work from the client's real IP address. In environments behind a reverse proxy — an ingress controller, a load balancer, a CDN — the
X-Forwarded-Forheader must be configured to pass through. Without it, every request appears to come from the proxy's internal IP, the user count is badly underestimated and the geographic distribution is inaccurate.
Configuring X-Forwarded-For per ingress controller
Nginx ingress controller
Set the following in the ConfigMap to trust and forward the X-Forwarded-For header. Where there are several proxy tiers (CDN → LB → ingress, say), compute-full-forwarded-for records the whole chain.
# nginx-ingress ConfigMap
data:
  use-forwarded-headers: "true"
  compute-full-forwarded-for: "true"
HAProxy ingress controller (haproxytech/kubernetes-ingress)
The forwarded-for option adds the X-Forwarded-For header and is enabled by default (true). It therefore usually works with no configuration, but check that it has not been turned off and, where needed, enable it explicitly as below. It can be set in the ConfigMap (globally) or as an ingress or service annotation.
# HAProxy Ingress ConfigMap (global)
data:
  forwarded-for: "true"
# Or as an ingress resource annotation (applies to that ingress only)
metadata:
  annotations:
    haproxy.org/forwarded-for: "true"
Note: where there are several proxy tiers, each has to append to and forward
X-Forwarded-Forfor the real client IP to survive to the end. Which position in the header the client IP is read from is set under Settings > X-Forwarded-For IP Direction below.
Screen layout
The user estimation screen is made up of the following areas.
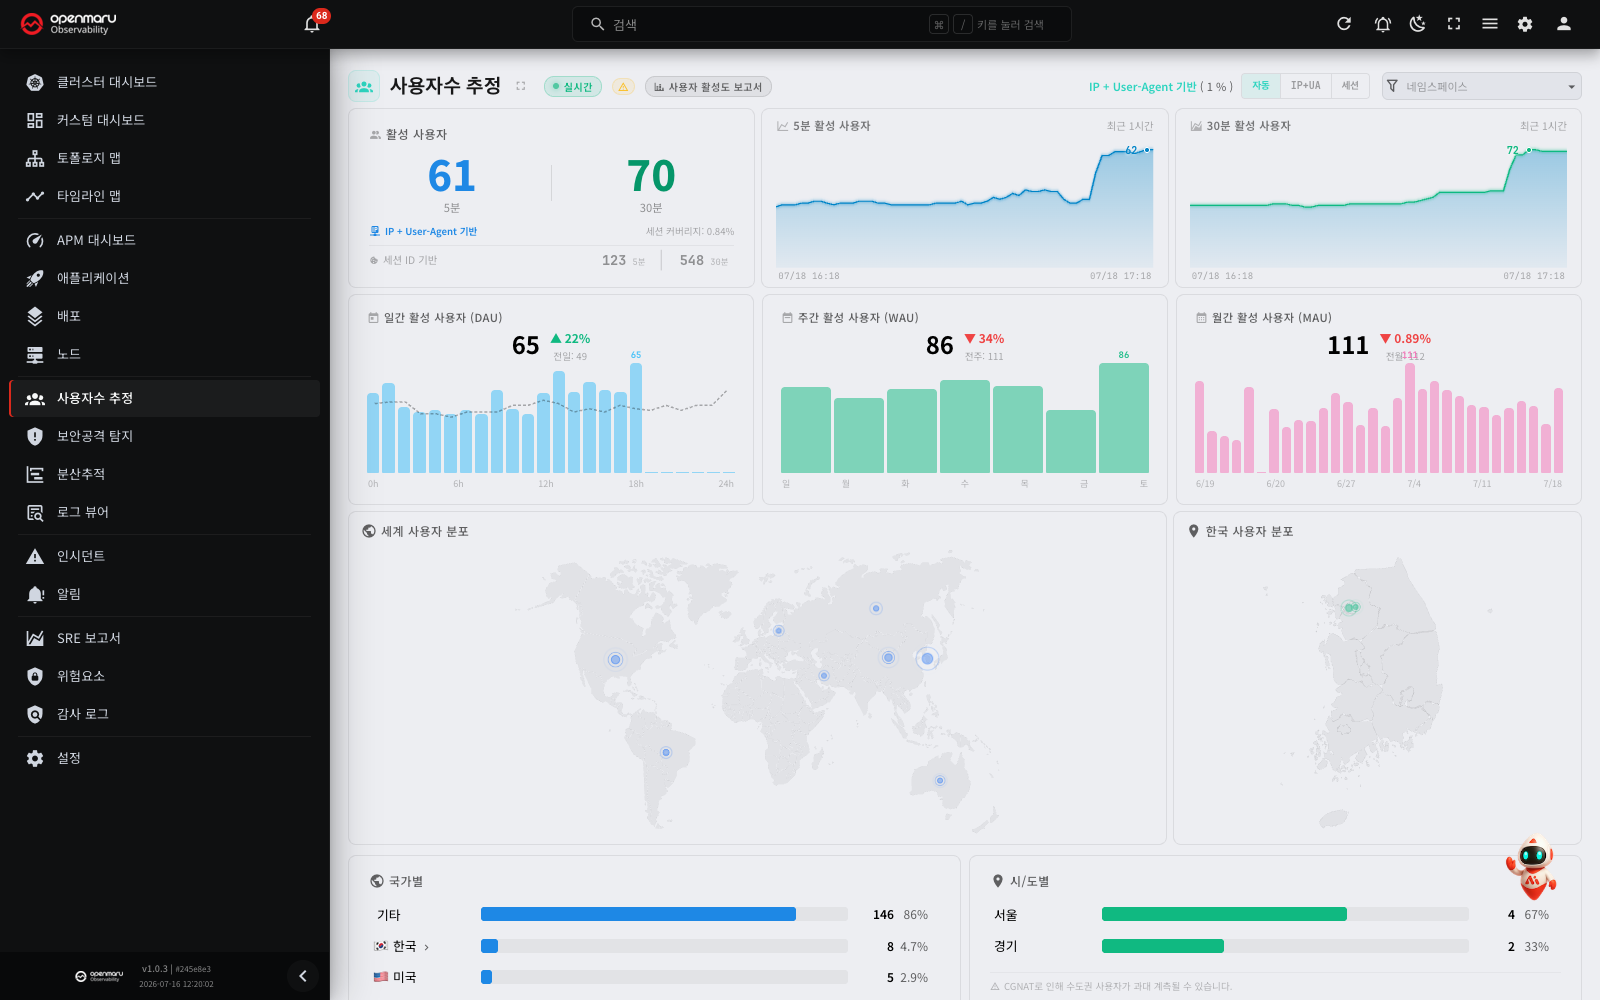
| Area | Description |
|---|---|
| Top header | Real-time connection state, estimation method toggle, namespace filter, activity report button |
| Active users card (row 1, left) | The 5-minute and 30-minute active user counts, with the estimation method |
| Sparkline charts (row 1, centre/right) | The 5-minute and 30-minute active user trends over the last hour |
| DAU/WAU/MAU cards (row 2) | Daily, weekly and monthly active user counts, with trend bar charts |
| Geographic distribution (row 3) | A world map, a map of Korea, and bar charts of distribution by country and region |
Main features
Checking the real-time connection
The user estimation screen connects to the server over WebSocket in real time. The connection state is shown at the top of the screen.
| State | Shown as | Description |
|---|---|---|
| Live | A blinking green dot with "Live" | Connected normally. Data refreshes automatically every 10 seconds. |
| Connecting | A loading icon with "Connecting..." | Connecting to the server for the first time. |
| Reconnecting | "Reconnecting (N)..." | The connection dropped and the screen is connecting again automatically. The number in brackets is the attempt count. On this screen, the badge does not change to "Disconnected" after 10 attempts. It continues to show this text. |
When the connection drops, the screen connects again by itself. For the first 10 attempts, the interval increases from 1 second to 30 seconds. After that, the screen tries every 60 seconds and does not stop. When the server responds again, the screen recovers by itself, so you do not have to refresh the page.
If the screen does not connect in 10 attempts, a warning bar and the Reconnect button appear at the top of the screen. Click Reconnect to connect again immediately, without a wait for the next attempt. For the reconnection intervals, see the "Checking the real-time connection" section in 3.1 Dashboard.
The estimation method toggle
Three toggle buttons at the top right of the screen let you choose the estimation method yourself.
| Button | What it does |
|---|---|
| Auto | Chooses the better method automatically from the session coverage (the default). |
| IP+UA | Shows the IP + User-Agent estimate regardless of session coverage. |
| Session | Shows the session ID estimate regardless of session coverage. |
In Auto mode, the method currently in use and the session coverage percentage are shown beside the toggle.
Note: the method you choose is saved in the browser and persists into your next visit.
Namespace filter
Choose a namespace from the dropdown in the top header and users are estimated from the traffic of that namespace's applications alone.
- With no namespace selected, the total user count is shown.
- Changing namespace shows a brief loading overlay while the server recalculates that namespace's data.
- The namespace you choose is saved in the browser and persists into your next visit.
Namespace correction for ingress traffic
Traffic on the path external user → ingress controller → backend service would, without correction, be classified under the ingress controller's namespace (kube-system, say), because eBPF only follows outbound (connect) connections. To fix this, the agent performs a two-stage destination namespace correction.
| Stage | Method | Description |
|---|---|---|
| Stage 1: same node | Local container registry lookup | Finds the container listening on the destination IP:port on the same node and reads its namespace. |
| Stage 2: another node | Pod IP → namespace map lookup | The server builds a pod IP / service ClusterIP → namespace mapping from VictoriaMetrics metrics (kube_pod_info, kube_service_info) and passes it to the agents once a minute. The agent looks the destination IP up in that map. |
With this correction, most ingress traffic is classified correctly under the backend service's real namespace.
Note: where the destination IP is not resolved at either stage (traffic going out to an external service, for example), it is classified under the source container's namespace.
Full screen
Click the full-screen icon in the top header to expand the user estimation screen to fill the browser. This is useful for leaving it up on a large monitor or a TV dashboard. Press ESC, or click the icon again, to return.
The active users card
The card at the left of the first row carries the headline figures for current active users.
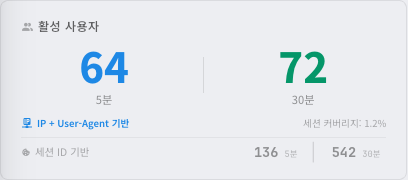
| Item | Description |
|---|---|
| 5 min | Unique users who sent a request in the last 5 minutes (the large blue number) |
| 30 min | Unique users who sent a request in the last 30 minutes (the large green number) |
| Method badge | The estimation method in use (session ID or IP+UA) |
| Session Coverage | The proportion of all requests carrying a session cookie (%) |
| The other method's figures | The 5- and 30-minute figures estimated by the other method (in small text) |
The other method's figures let you compare the two. Where they differ substantially, check your session management configuration.
Sparkline charts
Two sparkline charts sit to the right of the active users card.
| Chart | Colour | Description |
|---|---|---|
| 5 min Active Users | Blue | The 5-minute active user trend over the last hour |
| 30 min Active Users | Green | The 30-minute active user trend over the last hour |
Where there is not yet enough data, a "Requires 24+ hours of data" message is shown.
The DAU / WAU / MAU cards
The second row carries the daily (DAU), weekly (WAU) and monthly (MAU) active user cards side by side.

| Card | Period | Bar chart | Compared against |
|---|---|---|---|
| Daily Active Users (DAU) | Today | Active users by hour (00–23) | The change against yesterday (%) |
| Weekly Active Users (WAU) | This week | Active users by day (Sunday–Saturday) | The change against last week (%) |
| Monthly Active Users (MAU) | This month | Active users by day (30 days) | The change against last month (%) |
What each card carries:
- The large number: unique active users over that period
- The change indicator: the change against the previous period (green ▲ up, red ▼ down)
- The previous period's figure: the comparison period's user count (in small text)
- The bar chart: the user trend at a finer granularity within the period, with the peak value labelled
- The previous-day line (DAU only): yesterday's hourly trend overlaid as a dotted line
Hover over an individual bar and a tooltip gives that period's detailed user count and time. On the DAU chart, the figure for the same hour yesterday is shown too.
Geographic distribution
The third row shows where users are geographically. This works from GeoIP data.
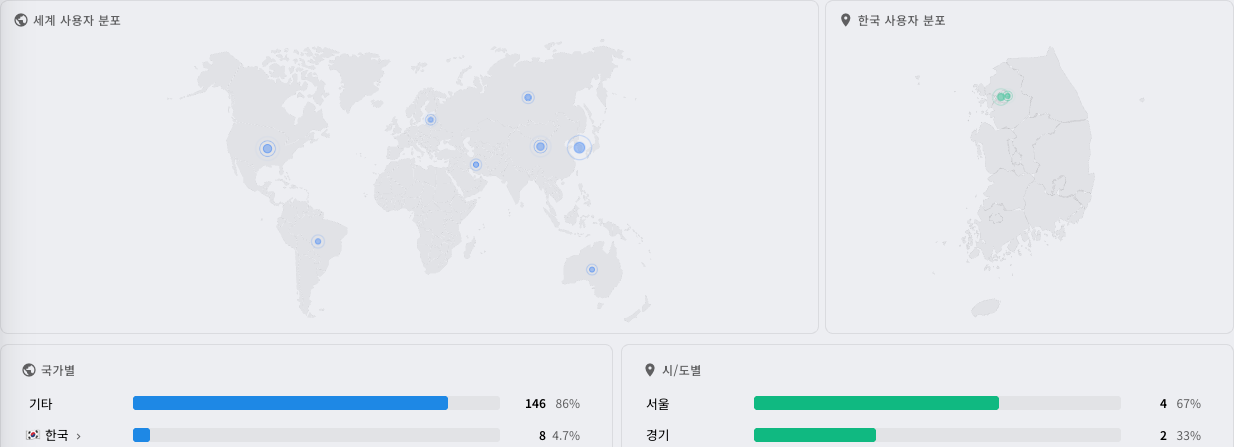
The world map
A world map at the top left carries a bubble on each country users connect from. The bubble's size is proportional to that country's share of users.
The map of Korea
A map of Korea's provinces and metropolitan cities sits at the top right. Colour intensity follows each region's share of users.
Distribution by country (bar chart)
The bottom left shows the distribution of users by country as a horizontal bar chart.
| Element | Description |
|---|---|
| Flag + country name | Identifies the country |
| Bar | Visualises the share of the total |
| Users | The estimated user count for that country |
| Share (%) | The percentage of the total |
Click the Korea (KR) entry to expand the distribution by province and metropolitan city.
Distribution by region (bar chart)
The bottom right shows the distribution of users across Korea's 17 provinces and metropolitan cities — Seoul, Gyeonggi, Busan and so on — with counts and shares.
Caution: the Korean regional distribution is GeoIP-based, so mobile carriers' CGNAT (carrier-grade NAT) can place users somewhere other than where they actually are.
The user activity report
Click the User Activity Report button in the top header to open the long-term user activity analysis dialog. It analyses in detail the hourly user counts stored in PostgreSQL, going back up to two years.
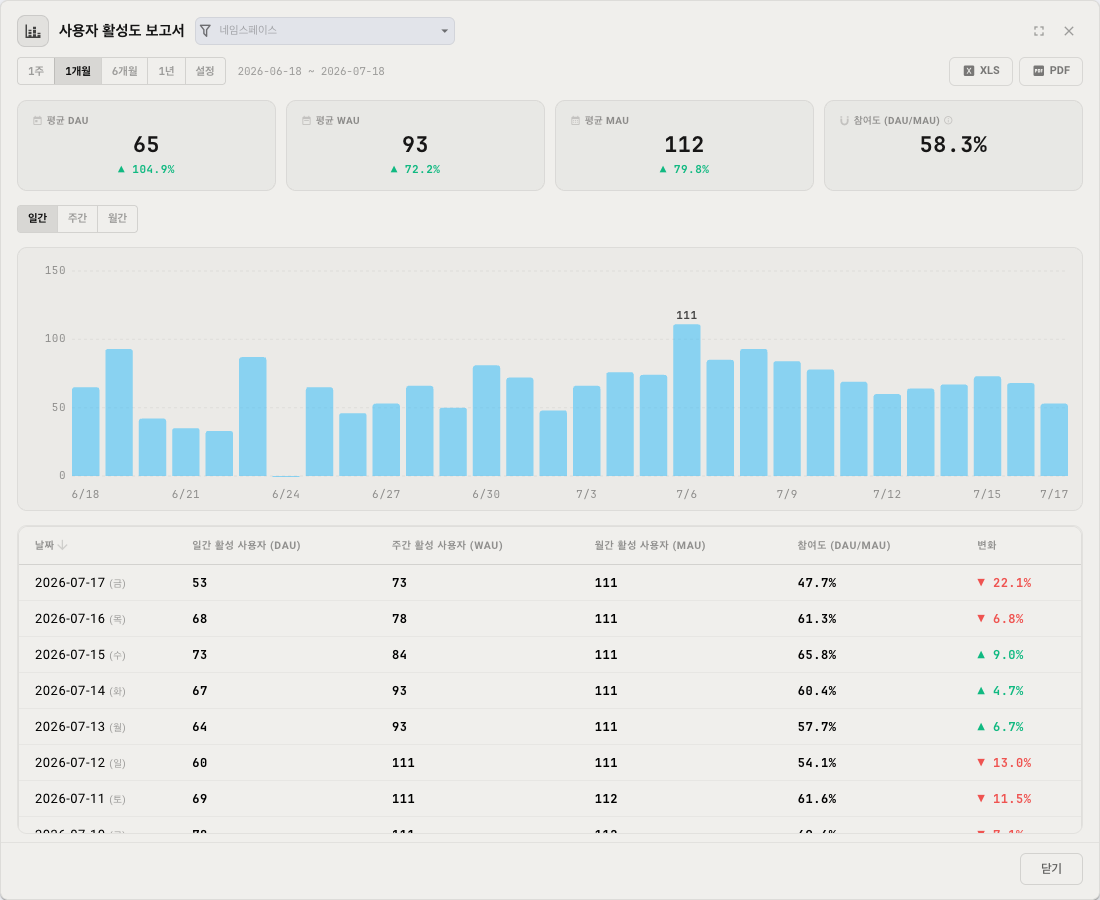
Choosing the period
Choose the analysis period at the top of the report.
| Period | Description |
|---|---|
| 1W | The last 7 days |
| 1M | The last 30 days (the default) |
| 6M | The last 180 days |
| 1Y | The last 365 days |
| Custom | Enter the start and end dates yourself |
KPI cards
Four headline indicators (KPIs) appear as cards at the top of the report.
| KPI | Description |
|---|---|
| Avg DAU | The average daily active users over the selected period, with the change against the previous period. |
| Avg WAU | The average weekly active users over the selected period, with the change against the previous period. |
| Avg MAU | The average monthly active users over the selected period, with the change against the previous period. |
| Stickiness (DAU/MAU) | The DAU/MAU ratio (%). It tells you how often users come back. At 10%, for instance, one in every ten monthly users visits daily. The higher the ratio, the more engaged your users. |
Trend charts
Below the KPI cards, a chart shows the user count trend over the selected period. Three resolution tabs let you switch.
| Tab | What it shows | Related metric |
|---|---|---|
| Daily | The daily active user trend | DAU |
| Weekly | The weekly active user trend | WAU |
| Monthly | The monthly active user trend | MAU |
A bar chart (up to 90 points) or an area chart (above 90) is chosen automatically according to the data density.
The detail table
Below the chart, a table gives the detail by date. It carries each date's DAU, WAU, MAU, stickiness (DAU/MAU) and change against the previous period, and clicking a column header sorts by it.
Namespace filter
You can change namespace within the report too, to analyse one namespace's data alone.
Exporting
Export the data from the bottom of the report.
| Format | Description |
|---|---|
| XLS | A spreadsheet file generated on the server, for further analysis. |
| A report document including the charts, useful for reporting to management or for keeping. |
The partial data warning
A yellow warning icon at the top of the screen means that more than 50% of users were classified as "unknown" country for want of GeoIP information. Where you see it, the geographic distribution may be inaccurate.
Data retention
| Data | Retained for | Purpose |
|---|---|---|
| HLL sketches (in memory) | A 65-minute rolling buffer | The live dashboard, and 5- and 30-minute active users |
| Rolling trends (in memory) | The last hour (a rolling buffer in server memory) | The sparkline charts |
| HLL snapshots (hll_snapshots) | 62 days | The serialised hourly HLL data used to calculate DAU/WAU/MAU |
| Hourly statistics (ue_hourly_stats) | Up to 2 years | The user activity report, and long-term DAU/WAU/MAU trends |
The no-data states
You may see the following states when you open the user estimation screen.
| State | Cause | What to do |
|---|---|---|
| "Waiting for data" | The agent has not collected any data yet | Check that the agent is installed and that HTTP traffic is arriving |
| Skeleton loading | The WebSocket is connecting but no data has arrived | Wait a moment and it will appear |
Settings
To adjust how user estimation behaves, go to the User Estimation Settings section of the Settings menu at the bottom of the left sidebar.
XFF IP direction
Sets which end of the X-Forwarded-For header the client IP is read from.
| Option | Description | Example (X-Forwarded-For: 1.2.3.4, 10.0.0.1, 10.0.0.2) |
|---|---|---|
| First IP (leftmost) | Uses the first (leftmost) IP in the header. The default. | 1.2.3.4 is taken as the client IP |
| Last IP (rightmost) | Uses the last (rightmost) IP in the header. | 10.0.0.2 is taken as the client IP |
The first IP is usually the real client, but depending on your CDN or load balancer configuration the last one may be. Choose to suit your environment.
Custom Session Cookie Names
Register the names of additional session cookies to recognise, beyond those supplied.
Built-in keys:
| Cookie name | Framework |
|---|---|
__KSMSID__ | OPENMARU Cluster |
JSESSIONID | Java (Servlet, Spring) |
PHPSESSID | PHP |
ASP.NET_SessionId | ASP.NET |
.AspNetCore.Session | ASP.NET Core |
connect.sid | Express.js (Node.js) |
laravel_session | Laravel (PHP) |
_session_id | Ruby on Rails |
Where you use your own framework or custom session management, type that session cookie's name and press Enter to add it. Added cookies appear as chips and can be removed with their X button.
Custom Bot Patterns
Register additional bot User-Agent patterns to filter out, beyond those supplied. Traffic identified as a bot is excluded from user estimation.
Built-in bots:
Googlebot, bingbot, Slurp, DuckDuckBot, Baiduspider, YandexBot, facebookexternalhit, Twitterbot, LinkedInBot, AhrefsBot, SemrushBot, MJ12bot, DotBot, PetalBot
Generic words:
bot, crawler, spider
A request whose User-Agent string contains one of these patterns is classified as a bot and excluded from user estimation. Adding the User-Agent patterns of your own bots and internal monitoring agents makes the estimate more accurate.
Applying settings
Click Save and the settings are stored on the server. Changed settings reach each node agent along the following path.
UI (Save clicked) → stored in the database → included in the API response (polled every minute) → applied by each node agent
Settings changes therefore reach every node agent within about a minute.
Note: a settings change applies to new traffic from that moment on. It has no effect on data already collected.
Frequently asked questions
The user count is higher than reality
- Where IP+UA estimation is in use: one user on several browsers or devices is counted as several users. Enabling session cookies gives a more accurate estimate.
- Where bot traffic is included: add custom bot patterns in the settings to exclude it.
The user count is lower than reality
- With IP+UA estimation behind NAT: users sharing one public IP are counted as one. This can badly underestimate in corporate networks (hundreds to thousands of people on one public IP) and mobile carrier CGNAT (tens of thousands on one IP). Session cookie estimation resolves this.
- Where session coverage is low: API-only requests may not send a session cookie. Add that service's session cookie name in the settings.
- Where many users are on a VPN: they are counted under the VPN server's IP, so several users become one.
Session coverage is 0%
The service may not use session cookies, or may use a name that is not in the supplied list. Add that cookie name under Custom Session Cookie Names in the settings.
The geographic distribution is inaccurate
- It depends on the accuracy of the GeoIP database, so there is some margin of error.
- In Korea, mobile carriers' CGNAT (carrier-grade NAT) can place users in a different region from where they actually are.
- VPN users appear at the VPN server's location.
No DAU/WAU/MAU data appears
DAU, WAU and MAU accumulate over time. Straight after installation there may not yet be enough data.
A value is shown as soon as the server has one, and "—" where it does not, so meaningful DAU/WAU/MAU figures require the data to build up first.