5.3. Log viewer
Search the logs of every application together and analyse them with a range of filters.
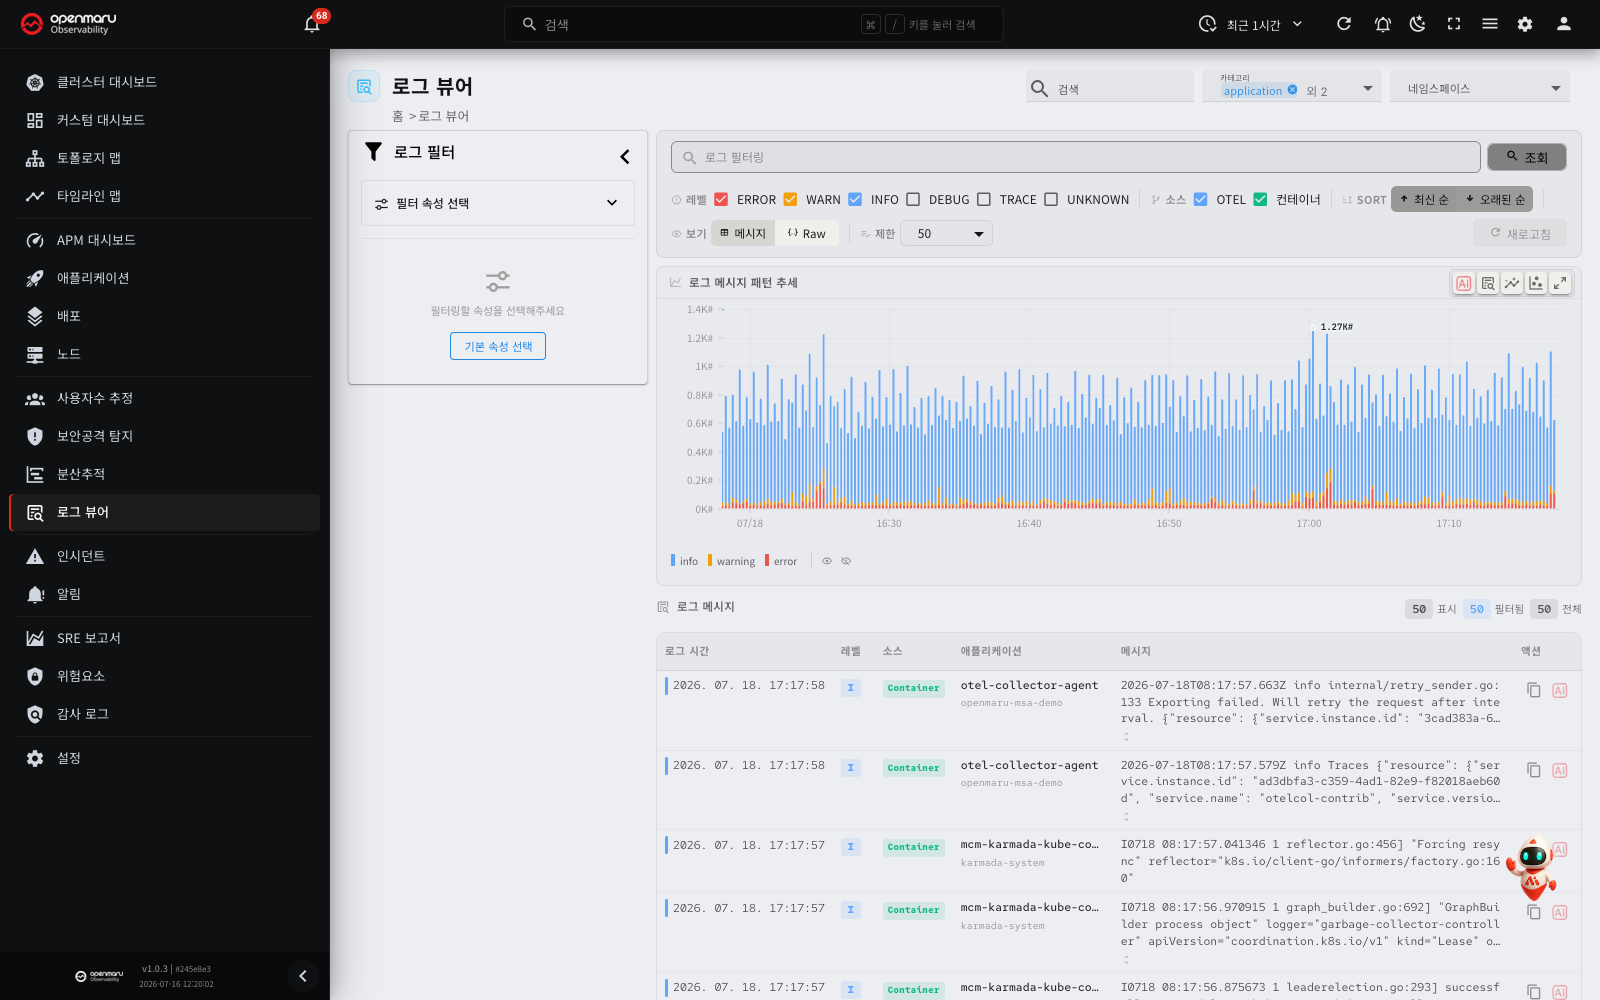
Overview
The Log Viewer screen lets you search and read the logs of every application in one place. A log is a record of an event that occurred in an application.
Combine keyword search, level filters, source filters and attribute filters to find the logs you want quickly, and read how log volume moved over time from the log message pattern trend chart.
Unlike the logs tab on an individual application's detail page, this screen is useful for looking at several applications' logs at once, or for searching every application for a particular error message.
Open it from the Log Viewer menu in the left sidebar.
Log collection sources
Logs are collected from two sources.
| Source | Description |
|---|---|
| OTEL | Logs the application sends directly through the OpenTelemetry SDK |
| Container | Standard output and standard error logs collected automatically by the container runtime |
Screen layout
The log viewer screen is made up of three areas.
| Area | Description |
|---|---|
| Top header | The page title and the application filters |
| Attribute filter panel (left) | Detailed filters based on log attributes |
| Main content area | The search bar, the filter controls, the trend chart and the log message list |
Top header
The application filters at the top of the screen set the scope of applications to query. You can specify it by namespace, category or application name. With no filter set, every application's logs are queried.
Attribute filter panel (left)
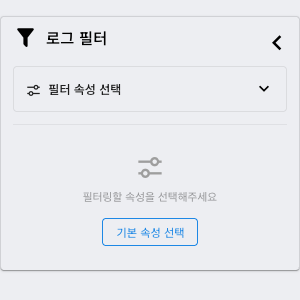
Set detailed filters based on the attributes carried in the logs. Click the close button at the top of the panel to collapse it and give the log list more room.
The panel offers the following.
- Select Filter Attributes: select or clear the attributes to filter on. The number of available values is shown beside each attribute.
- Filtering values within an attribute: pick particular values within a selected attribute. A search field in each attribute section finds values quickly.
- Select All / Clear All: select or clear the filters for one attribute, or all of them, at once.
Note: whether the filter panel is shown is saved in the browser and persists into your next visit.
Main content area
The main content area carries the following, in order.
- The search and options bar: keyword search, level filter, source filter, sorting, view mode, and the number of rows to show
- The Logs Trends chart: visualises how logs trended over time
- The Log Messages list: the logs matching your conditions. Its header has the Filter loaded messages field and the statistics
Main features
Entering a search query

Search finds logs containing a particular keyword or error message quickly.
- Type the keyword or error message into the Search messages (press Enter) field at the top of the screen.
- Click Query, or press Enter, to run the search.
- Only logs whose message contains your keyword remain in the list. In the Messages view, the parts of the message that match the keyword are highlighted. The Raw view does not highlight them.
- To clear the search term, click the clear (X) button in the field. The term is cleared and the list is queried again.
Note: the search does not run while you type. The server queries the logs again only when you press Enter, click Query or click the clear (X) button. The top search looks only at the log message.
Tip: you can search on all sorts of keywords — an error code, an exception class name, a particular user ID.
Filter loaded messages
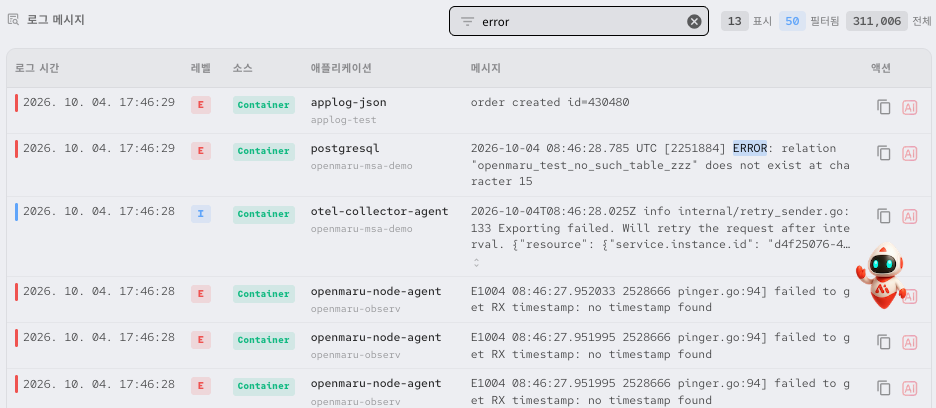
To search again in the logs that are already loaded, use the Filter loaded messages field in the header of the Log Messages list. This filter does not query the server again.
| Item | Search messages (top) | Filter loaded messages |
|---|---|---|
| Searched data | The message of all logs that match the query conditions | All visible columns of the loaded logs (Logs at, level, source, application, namespace, message) |
| When it runs | Enter, Query, the clear (X) button | Immediately as you type |
| Highlighted matches | The message column | The application column (application, namespace) and the message column |
- The loaded-message filter is not case-sensitive.
- The matches of the two search terms are highlighted in different colours.
- When you run the top search again, the text in the loaded-message filter stays.
- In the Messages view, if no loaded log matches the filter, the message No messages match the filter and the Clear filter button appear. Click Clear filter to clear the filter text.
Tip: use the two searches one after the other to narrow the scope in two steps. For example, load the logs that contain
errorwith the top search. Then type an application name into the loaded-message filter.
The filter panel
The log viewer lets you combine several kinds of filter to find precisely the logs you want.
Level filter
Use the checkboxes in the Level filter group to choose which log levels to show. Several levels can be selected at once.
| Level | Description |
|---|---|
| ERROR | Logs where an error occurred |
| WARN | Warning logs that need attention |
| INFO | Ordinary informational logs |
| DEBUG | Detailed logs for debugging |
| TRACE | The most detailed trace logs |
| UNKNOWN | Logs with no level set |
Tip: ERROR, WARN and INFO are selected by default. When investigating a problem, select ERROR alone to concentrate on the error logs.
Source filter
Choose the log collection source in the Source filter group.
- OTEL: logs sent through the OpenTelemetry SDK
- Container: logs collected from the container runtime
Both sources are selected by default.
Using the attribute filter panel
The attribute filter panel on the left lets you filter on the various attributes carried in the logs.
- Expand the Select Filter Attributes section at the top of the left panel.
- Select the attributes to filter on. The number of distinct values is shown beside each attribute name.
- The attributes you selected appear below as individual sections.
- Click the values you want in each attribute section to apply the filter. The search field finds a value in the list quickly.
- Where a filter is active, a badge beside the attribute name gives the number of values selected.
Tip: click Clear All at the top of the panel to reset every attribute filter at once.
Showing and hiding the filter panel
- Click the close button at the top of the filter panel to collapse it.
- Click the filter icon at the left edge of the screen to expand it again.
- Where filters are active, the collapsed filter bar carries a visual marker.
Sorting and display options
- Sort: Newest first or Oldest first. The default is newest first.
- View: the Messages view is a table; the Raw view shows the original log text.
- Limit: the maximum number of logs to show at once — 25, 50, 100, 200 or 500.
The Logs Trends chart
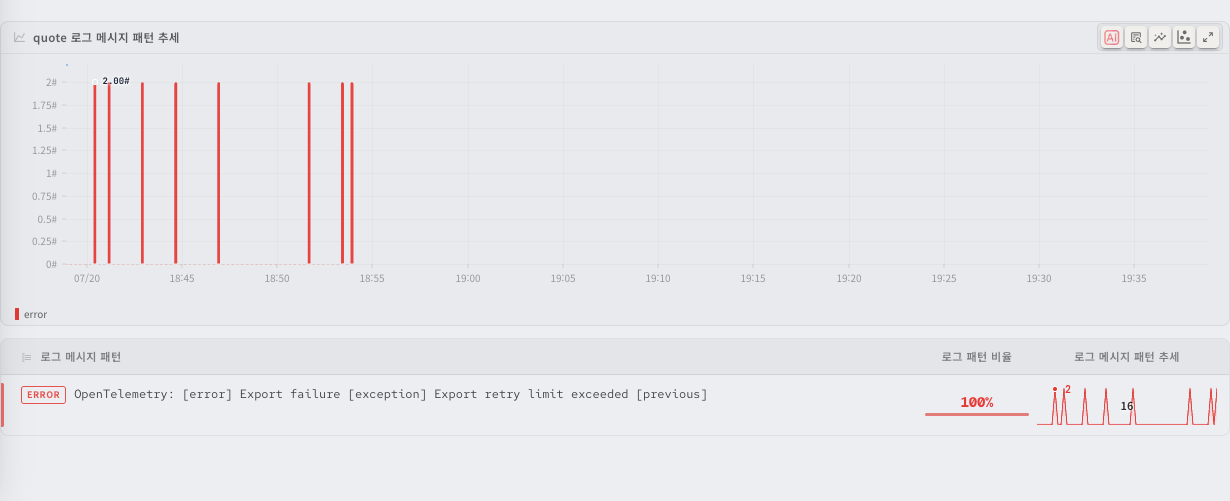
A chart above the log list shows how log message patterns trended over the selected time range. Log volume is broken down by level with colour, so you can see at a glance where errors spiked.
Drag on the chart to zoom into that period.
Tip: find the period where errors rose sharply on the chart, then select it to get to the logs behind it quickly.
Reading the results
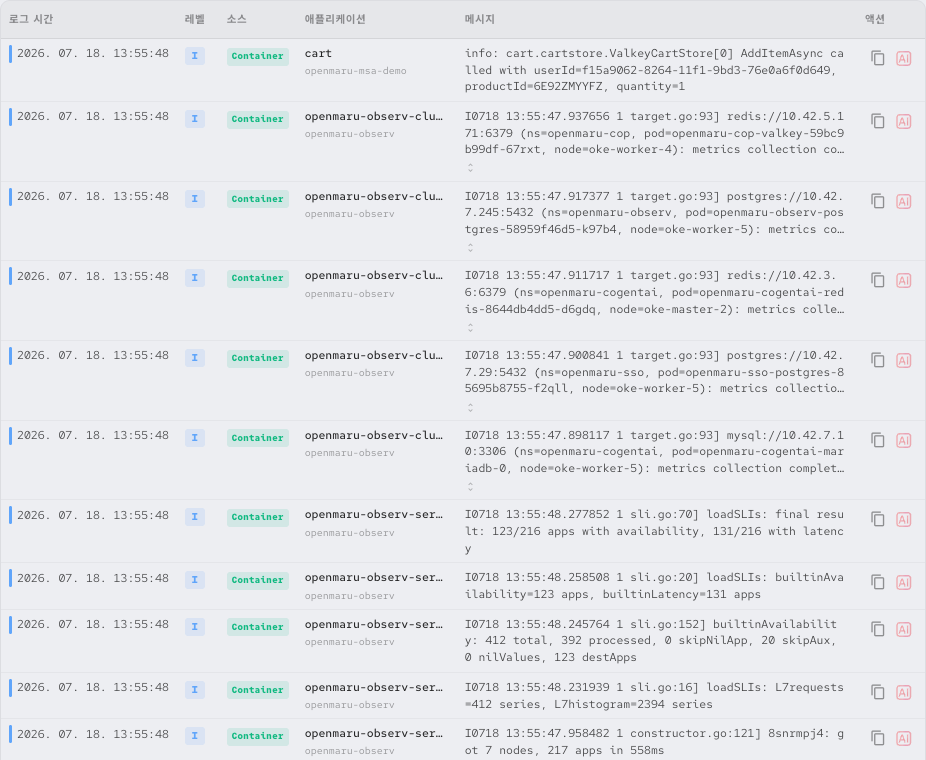
The log message list
The log message list has the following columns.
| Column | Description |
|---|---|
| Logs at | Exactly when the log was written. A colour marker for the level sits on the left |
| Level | The first letter of the log's severity (E, W, I, D, T and so on) |
| Source | Where the log was collected from (OTEL or Container) |
| Application | The name and namespace of the application that produced the log |
| Message | The log's content. Long messages are truncated; click the row to see the whole message in the detail dialog |
| Actions | The copy button and the CogentAI analysis button |
Statistics
The following statistics appear above the list.
| Item | Description |
|---|---|
| Displayed | How many logs are currently on screen. This is the count after the loaded-message filter |
| Filtered | How many logs the server loaded. This is the smaller of the total count and the limit |
| Total | How many logs match the query conditions in total. The limit is not applied to this count |
These tell you what proportion of the logs that match the query conditions you are looking at.
Note: Total is not the count of all logs stored in the system. It is the count after all query conditions are applied, such as the time range, levels, applications and search term.
Note: if the Total count is larger than the Filtered count, only part of the logs was loaded because of the limit. In this case, narrow the conditions or raise the limit.
Looking at a log in detail
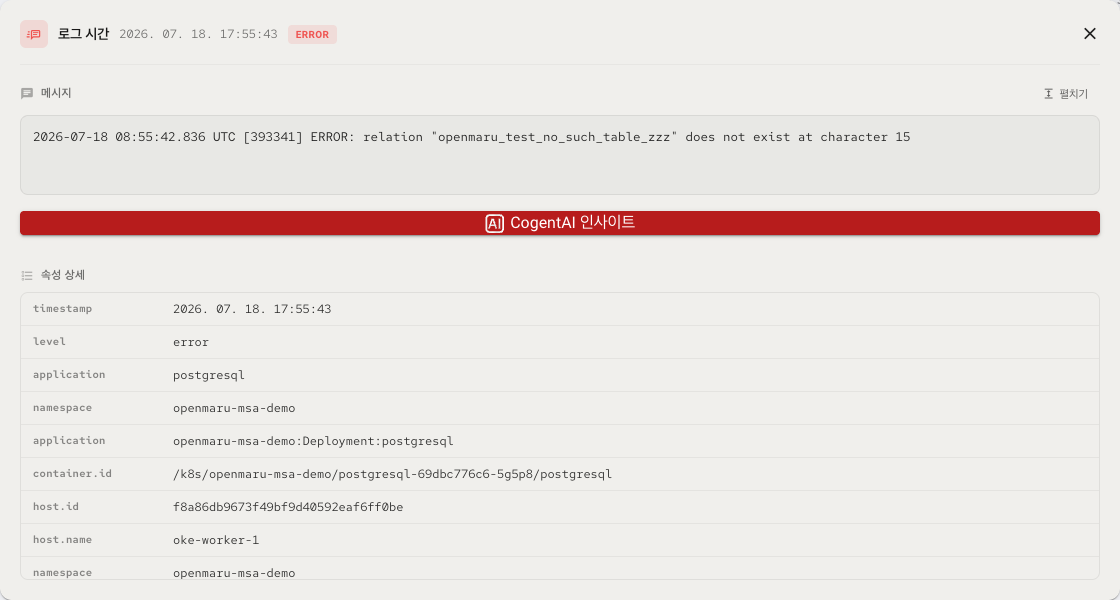
Click a row in the log list to open its detail dialog.
| Item | Description |
|---|---|
| Logs at | When the log occurred, with a level badge |
| Message | The log's full content. Expand and Collapse buttons open and close a long message |
| Attributes Detail | Every attribute carried in the log — timestamp, level, application, namespace and so on. Additional metadata is shown too, where present |
Tip: JSON log messages are syntax-highlighted automatically.
Copying a log

Click the copy button at the right of a log row to copy that log's content to the clipboard, ready to paste into another tool for further analysis.
Analysing logs with CogentAI
CogentAI is the AI-based analysis platform integrated into OPENMARU Observability. Where CogentAI is enabled, there are two ways to run AI analysis over a log.
Approach 1: straight from the log list
A CogentAI icon button sits in the action area at the right of each row of the log message table. Click it to pass that log message to CogentAI and request an analysis.
Approach 2: from the log detail dialog
- Click a row in the log list to open the detail dialog.
- Click the CogentAI Insight button below the message area.
- The CogentAI widget opens at the bottom right of the screen with the AI's analysis of that log message.
Tip: CogentAI analysis is useful for establishing the cause of an error log quickly, and for understanding what a complicated log message means.
Refreshing
Click Refresh to query the latest log data again, keeping your current filter conditions.
Adjusting the time range
Change the range in the time range picker at the top of the screen and the logs from that period are shown. This is useful for narrowing your analysis to the logs either side of a problem.
Note: the wider the time range, the more logs are returned; in that case use the Limit option to control how many are shown.
Worked examples
Concentrating on error logs
Where errors spiked in a particular period, analyse them in this order.
- Find the period where logs spiked on the Logs Trends chart.
- Drag on the chart to zoom into that period.
- Select ERROR alone in the level filter.
- Read the error messages and, where necessary, use keyword search to isolate a particular kind of error.
- Click a log row to see its detailed attributes, or click the CogentAI button to use AI analysis.
Following one application's logs
To follow only the logs from a particular application:
- Select the application in the application filters in the top header.
- Add any attributes you need (namespace and so on) in the attribute filter panel on the left.
- Combine the level and source filters to narrow the scope.
- Type a relevant keyword into the search field and press Enter to find the logs you want.
Related documents
- Applications - the logs tab of an individual application, showing only that application's logs
- Audit logs - Kubernetes and operating system audit events
- Distributed tracing - the trace information connected to a log
- Incidents - analysing the logs from the moment an incident occurred
- Using charts - the shared chart controls