9.1. Settings
Managing a project's connection status, API keys, inspection conditions, application groups, alert channels and user permissions in one place.
Overview
The Configuration page manages the configuration of an OPENMARU Observability project as a whole. Open it from the Settings menu in the left sidebar, and switch between areas with the tabs at the top.
| Tab | Contents |
|---|---|
| General | Server connection status and API key management |
| Inspections | The thresholds at which incidents are raised |
| Applications | Application grouping rules and custom application settings |
| Notifications | Slack, Teams, email (SMTP) and webhook integrations, and the incident resolve hold |
| Organization | User account management and RBAC (role-based access control) |
| Security | IP whitelist management |
Screen layout
The Configuration page is made up of the following.
- Page header: the settings icon and the page title
- Tab bar: switches between the six tabs (General, Inspections, Applications, Notifications, Organization, Security)
- Tab content area: the settings for the selected tab
Main features
General
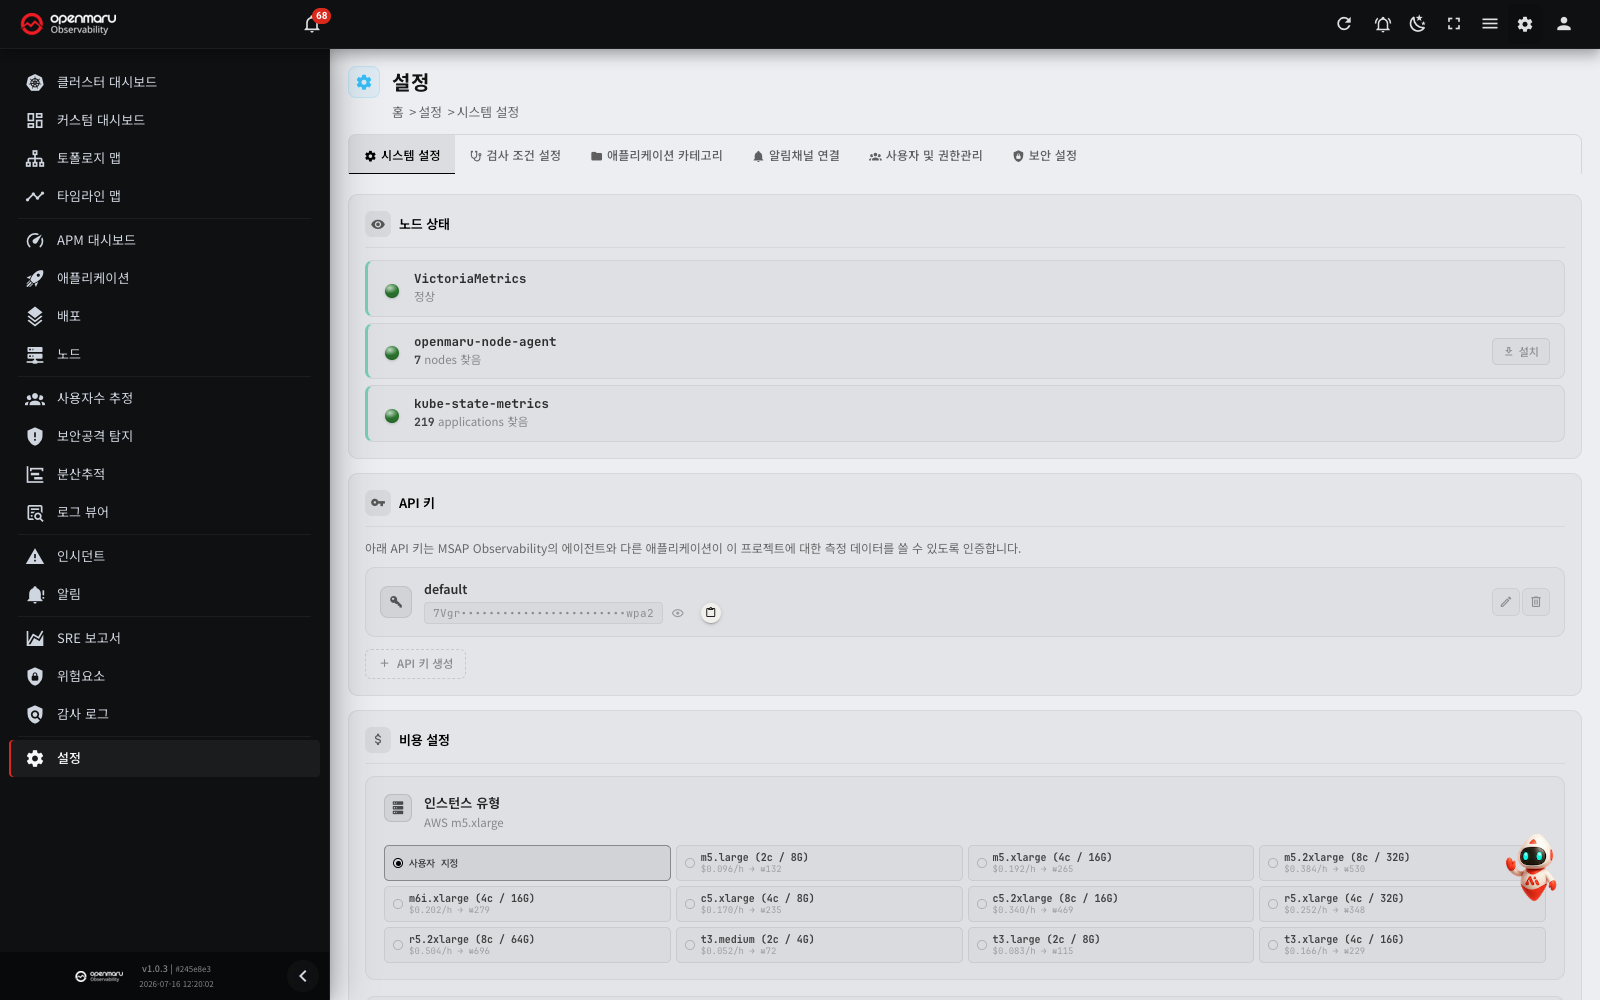
The General tab shows the project's server connection status and manages API keys.
Server Status
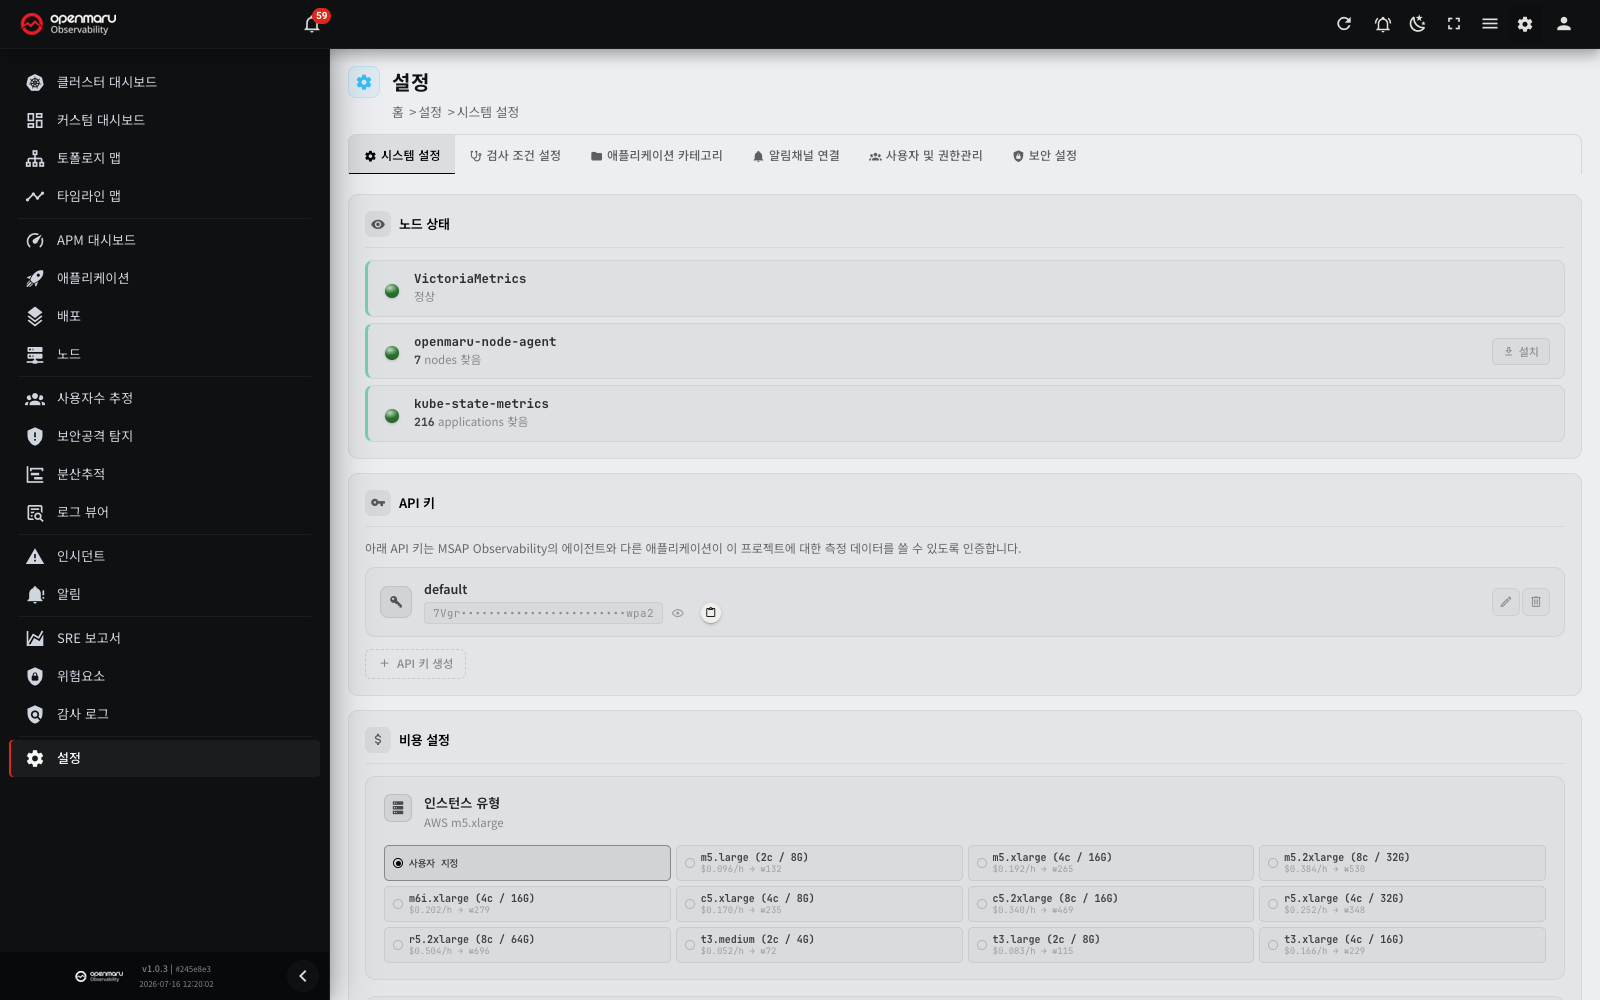
The Server Status section shows the connection status of the components the project depends on.
| Item | Description | Action |
|---|---|---|
| VictoriaMetrics | The metric store's connection status | A Configure link appears where it is not connected |
| openmaru-node-agent | Whether the node agent is installed, and how many nodes were found | -- |
| kube-state-metrics | The Kubernetes state metrics collector's connection status, and how many applications were found | — |
In an environment that is not Kubernetes (host mode), the kube-state-metrics row is not shown.
Each item's state is shown by a colour indicator.
- Green: connected normally
- Red: connection failed, or not installed
- Grey: state unknown
If openmaru-node-agent is not installed, the row shows "No agent installed". This row has no button.
API keys
An API key is the credential agents and external applications use to send telemetry to this project.
Note: API key management is available to users with the Admin role only. Users who are not Admin do not see the key values.
Viewing API keys
- Open the General tab.
- Read each key's description and masked value in the table in the API keys section.
- Click the eye icon to reveal the full key value. Click it again to mask it.
- Click the copy button to copy the API key to the clipboard.
Creating an API key
- Click Generate API key.
- Enter what the key is for in the Description field (for example "production-agent", "otel-collector").
- Click Generate.
- The new API key is added to the list.
Note: the API key you create is used when installing the agent. Keep the key value somewhere safe.
Editing an API key
- Click the edit button (the pencil icon) on the key you want to change.
- Edit the Description field and click Save.
Deleting an API key
- Click the delete button (the bin icon) on the key you want to remove.
- A confirmation dialog opens.
- Click Delete to confirm.
Caution: once an API key is deleted, agents and applications using it can no longer send telemetry. Check that no agent is still using the key before deleting it.
Cost Settings
On projects that are not in non-Kubernetes (host) mode, a Cost Settings section also appears. Set the unit price of resource usage and it becomes the basis for cost calculations in the resource status and forecast reports. For details, see the SRE report chapter.
User estimation
The User Estimation Settings section configures how unique users are identified from HTTP traffic. Changes reach every node agent after about a minute. For details, see the user estimation chapter.
Configuring inspection conditions
An inspection is a threshold condition that monitors the state of your applications and infrastructure continuously. When a threshold is passed, an incident is raised automatically.
The inspection list
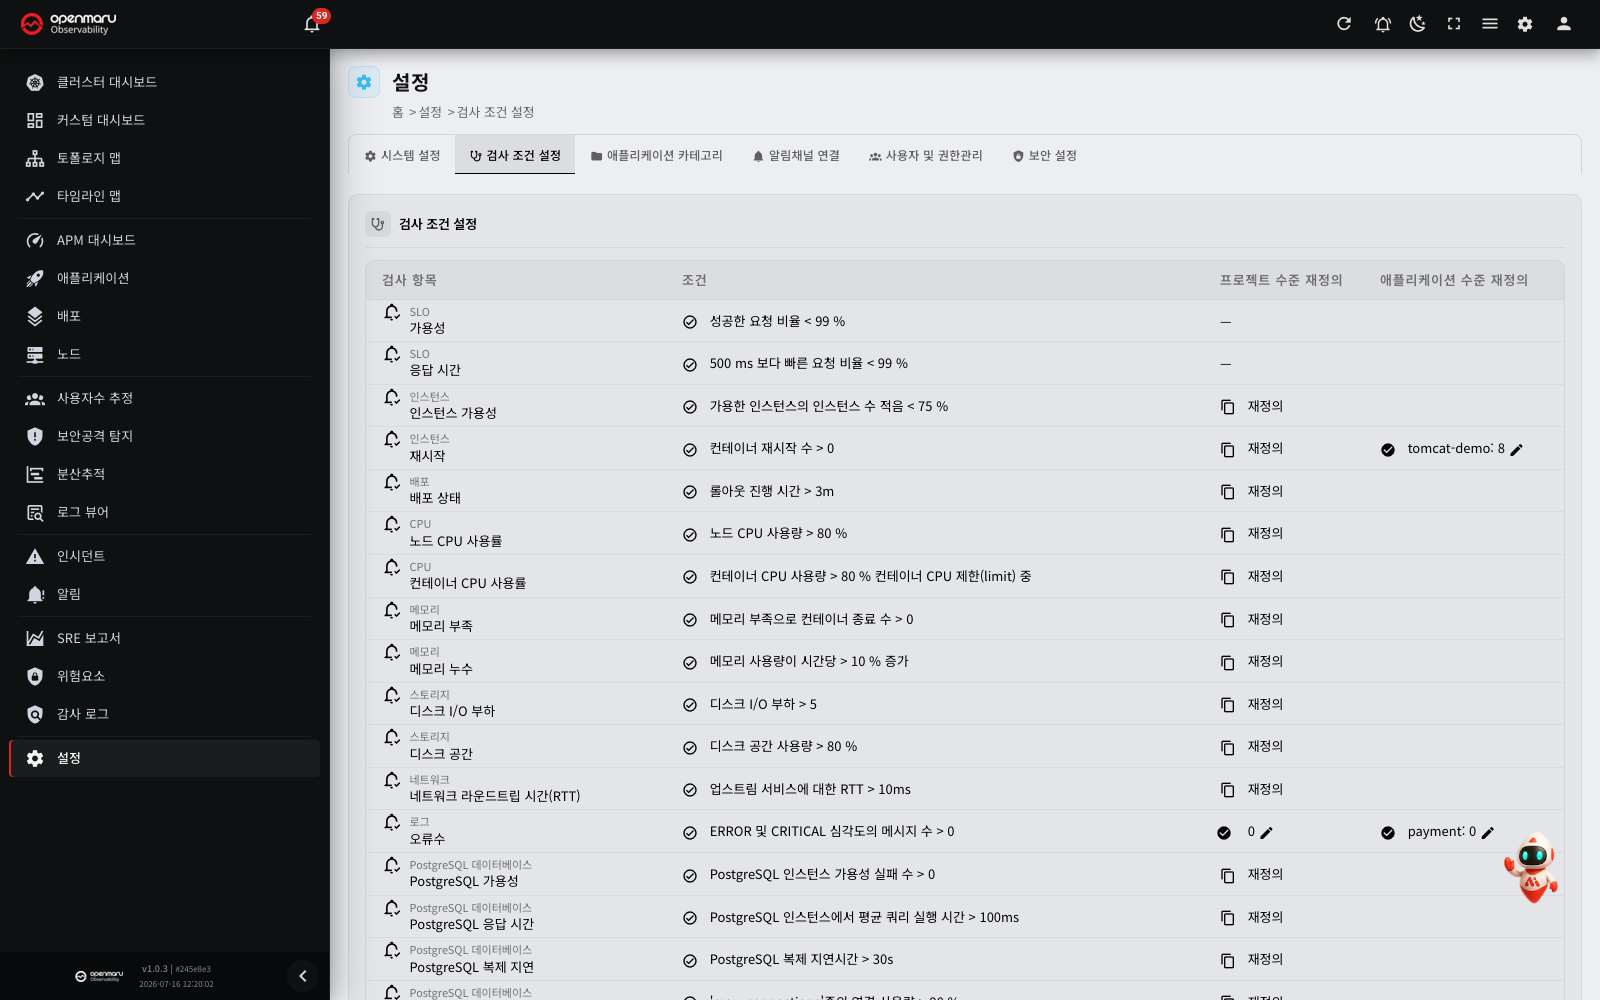
The Inspections tab lists the inspections as a table.
| Column | Description |
|---|---|
| Inspection | The inspection's category and name (availability, response time, node CPU usage and so on) |
| Condition | The default threshold condition currently in force |
| Project-level override | A custom threshold applied across this whole project |
| Application-level override | A custom threshold applied to an individual application |
The inspections in this table:
- SLO / Availability, SLO / Latency: the request success rate and request handling time objectives
- Instances / Instance availability, Instances / Restarts: whether instances run normally, and the container restart count
- Deployments / Deployment status: detects deployment anomalies
- CPU / Node CPU utilization, CPU / Container CPU utilization: the CPU usage thresholds of nodes and containers
- Memory / Out of Memory, Memory / Memory leak: detects out-of-memory kills and continuously rising memory use
- Storage / Disk I/O load, Storage / Disk space: the disk input/output load and disk space thresholds
- Net / Network round-trip time (RTT): the upstream service RTT threshold
- Logs / Errors: the threshold for the number of ERROR and CRITICAL log messages
- Postgres: availability, latency, replication lag, connections
- Redis: availability, latency
- JVM: availability, safepoints
- Mongodb: availability, replication lag
The availability inspections of Postgres, Redis, JVM and Mongodb do not use the threshold. They give a warning when at least one target instance does not respond. The settings dialog of these inspections has no threshold box and no Save button. It shows a note that starts with "This inspection does not use a threshold."
Note: the inspections in the table below are not in the inspection list above. Change their thresholds in the application detail. The Tab column gives the application detail tab that shows the inspection. Click the gear icon on the inspection item at the top of that tab to open the settings dialog. In this dialog you can change both the application-level value and the project-level value.
These inspections and their default thresholds are as follows. For the built-in alerting rules of the vLLM, Python runtime and DB connection utilization inspections, refer to the Alerting rules tab in the Incidents chapter.
| Tab | Inspection | Condition | Default threshold |
|---|---|---|---|
| Network | Network connectivity | The number of unavailable upstream services > threshold | 0 (not used) |
| Network | TCP connections | The number of upstream services to which the app failed to connect > threshold | 0 (not used) |
| Network | DB connection utilization | The number of concurrent queries > threshold of open connections to a PostgreSQL or MySQL service | 90% |
| DNS | DNS latency | The 95th percentile of DNS response times > threshold | 0.1 seconds |
| DNS | DNS server errors | The number of server DNS errors (excluding NXDOMAIN) > threshold | 0 |
| DNS | DNS NXDOMAIN errors | The number of the NXDOMAIN DNS errors (for previously valid requests) > threshold | 0 |
| MySQL | Mysql availability | The number of unavailable mysql instances > threshold | 0 (not used) |
| MySQL | Mysql replication status | IO or SQL replication thread is not running | None |
| MySQL | Mysql replication lag | MySQL replication lag > threshold | 30 seconds |
| MySQL | Mysql connections | The number of connections > threshold of 'max_connections' | 90% |
| Memcached | Memcached availability | The number of unavailable memcached instances > threshold | 0 (not used) |
| .NET | .NET runtime availability | The number of unavailable .NET instances > threshold | 0 (not used) |
| Python | Python GIL(Global Interpreter Lock) waiting time | The sum of the time that Python threads waited to acquire the GIL (Global Interpreter Lock), in seconds per second, main interpreter only > threshold | 0.05 seconds |
| Python | Python event loop blocking | The longest Python event loop busy time in the last 5 minutes > threshold | 2 seconds |
| Python | Python GC pause | The longest Python GC pause in the last 5 minutes > threshold | 0.5 seconds |
| Python | Python GC time | The average share of time a Python process spent in GC in the last 5 minutes > threshold | 5% |
| Security | Traffic spike | The request rate > threshold x of the 1-hour average | 8x |
| Security | Brute force | The ratio of 401/403 responses > threshold | 50% (see below) |
| Security | Error rate spike | The 5xx error rate > threshold x of the 1-hour average | 10x |
| Security | Security pattern detected | The number of security events > threshold | 0 |
| vLLM | vLLM request errors | The percentage of requests finished with an error > threshold | 5% |
| vLLM | vLLM KV cache usage | The KV cache usage of a vLLM instance > threshold | 90% |
| vLLM | vLLM waiting requests | The number of waiting requests of a vLLM instance > threshold | 0 |
- An inspection marked "not used" gives a warning when there is at least one target (an upstream service or an instance). The settings dialog of these inspections and of Mysql replication status has no threshold box and no Save button. It shows only a note. Mysql replication status has no threshold in its condition. It gives a warning when the replication thread of at least one instance is stopped.
- The threshold of Brute force is a percentage. The default 50% gives a warning when 401/403 responses are more than 50% of the requests. A ratio value (0 to 1) saved in an earlier version changes to a percentage once, when the server is updated (for example 0.5 becomes 50). The result of the inspection does not change.
Overriding a threshold at project level
To change an inspection's threshold across the whole project:
- Click the Override link in the Project-level override column of the inspection you want to change.
- Enter the threshold you want in the dialog that opens.
- The dialog shows the Global default, the Project-level override and, where relevant, an App override row.
- Where no project-level override is set, the global default applies, and you can click Override to enter a custom value.
- Click Save.
Once set, the override appears in that column. To change it, click the edit icon beside the value.
Note: the SLO availability and SLO response time items do not support project-level overrides. Set those individually on the application detail page.
Overriding a threshold per application
To apply a different threshold to one application only:
- Click the edit icon beside that application's name in the Application-level override column.
- Enter the threshold to apply to that application.
- Click Save.
Tip: adjusting thresholds per application to suit each service's characteristics reduces unnecessary incidents and gives you more accurate alerts.
Configuring SLO inspections
The SLO availability and SLO response time items are set on the SLO tab of the application detail page. The inspection dialog lets you configure the following.
SLO availability
- Metrics: use the built-in inbound requests, or specify your own PromQL query. Choosing custom lets you enter the total request query and the failed request query separately.
- Objective: tick the checkbox to enable SLO tracking and set the request success rate target as a percentage (for example
99%of requests must not fail).
SLO response time
- Metrics: use the built-in inbound requests, or specify your own histogram query.
- Objective: set the target proportion of requests that must be handled within a given response time (for example
99%of requests must be handled within500ms). - target: choose from 5 ms, 10 ms, 25 ms, 50 ms, 100 ms, 250 ms, 500 ms, 1 s, 2 s, 3 s, 4 s, 5 s, 6 s, 7 s, 8 s, 9 s and 10 s (in one-second steps from 1 s).
Latency SLO of a vLLM application
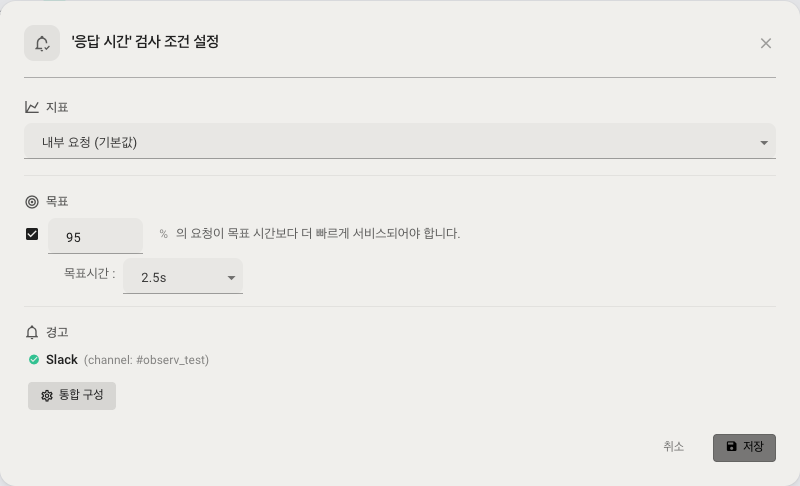
For an application with a vLLM engine, the latency SLO uses the time to first token (TTFT), not the HTTP response time. The HTTP response time of an LLM request increases with the number of generated tokens.
- Default objective: 95% or more of requests must get the first token in 2.5 seconds or less. If a user saved a value, that value applies.
- target: choose from 0.1 s, 0.25 s, 0.5 s, 0.75 s, 1 s, 2.5 s, 5 s, 7.5 s, 10 s and 20 s. These are the bucket boundaries that vLLM uses to record the time to first token.
- If you select a custom histogram query in Metrics, that query applies instead of the time to first token.
- If no time to first token data is collected, the HTTP response time applies, as for other applications.
- The availability SLO does not change. A vLLM application also uses the rate of HTTP 5xx responses.
The condition text on the SLO tab shows that the time to first token applies, for example "the percentage of requests with time to first token (TTFT) faster than 2.5s". If only part of the query period has time to first token data, the tab also shows "TTFT basis since: <time>".
Note: the APM Dashboard shows the HTTP response time. Thus, a vLLM application can look like a slow application on the APM Dashboard.
Alerting
The bottom of the SLO dialog shows the state of the alert channels currently connected. Where none is configured, click Configure integrations to go to the Notifications tab.
To remove an SLO inspection override, click the delete icon in the dialog.
Application categories
Groups applications logically. Define a category and you can then use the category filter to separate applications on the dashboard, the topology map, the application list and other screens.
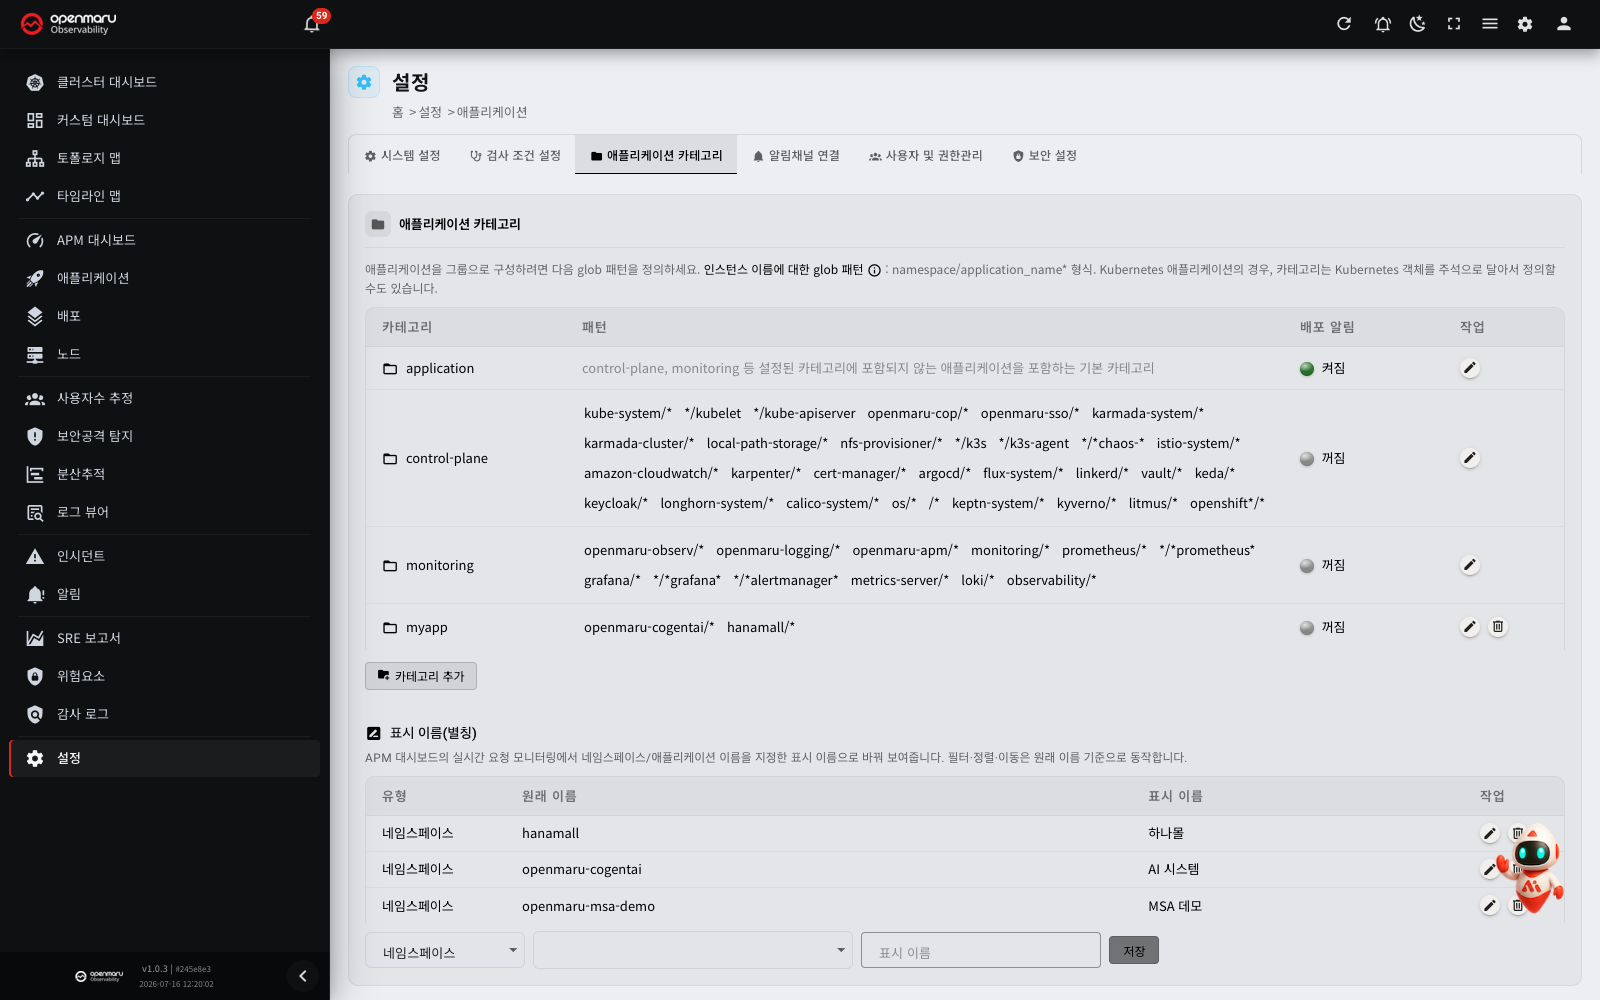
Configuring categories
The category list shows the categories currently defined.
| Column | Description |
|---|---|
| Category | The category's name |
| Patterns | The glob pattern that matches the applications in this category |
| Notify of deployments | Whether to receive alerts when this category's applications are deployed (on/off) |
| Actions | The edit and delete buttons |
Note: the default category holds the applications that fall into no other category. It cannot be deleted. Built-in categories' names and built-in patterns cannot be changed; you can only add custom patterns to them.
Adding a category
- Click Add a category.
- Enter the category's name in the Name field.
- Enter the patterns for the applications in this category in the Custom patterns field.
- Patterns take the form
namespace/application(for examplestaging/*,test-*/*). - Separate several patterns with spaces.
- Glob pattern syntax is supported.
- Patterns take the form
- Set the Get notified of deployments option. When enabled, an alert goes to the configured alert channels whenever an application in this category is deployed.
- Where no alert channel is configured, "No notification integrations configured" appears, and you can click Configure integrations to go to the Notifications tab.
- Click Save.
Editing and deleting a category
- Edit: click the edit button (the pencil icon) on the category in the list to change its settings.
- Delete: click the delete button (the bin icon). Built-in categories cannot be deleted.
Note: for Kubernetes applications, you can also define the category by putting an annotation on the Kubernetes object.
Custom applications
OPENMARU Observability groups containers into applications automatically, as follows.
- Kubernetes metadata: pods are grouped by their Deployment, StatefulSet and so on.
- Non-Kubernetes containers: Docker containers and systemd units are grouped by name. A
mysqlservice running on several servers, for instance, is gathered into onemysqlapplication.
Where this default does not suit, custom application settings let you define instance name patterns to gather the containers you want into one application.
| Column | Description |
|---|---|
| Application name | The custom application's name |
| Instance patterns | The glob pattern that matches the instances in this application |
| Actions | The edit and delete buttons |
Adding a custom application
- Click Add an application.
- Enter the application's name in the Name field.
- Enter the instance name patterns to include in the Instance patterns field.
- Matching is against instance names (for example
mysql@node1,cassandra@cass-node*). - Separate several patterns with spaces.
- Matching is against instance names (for example
- Click Save.
Note: custom application settings apply to non-Kubernetes containers (Docker containers, systemd units and so on). They do not apply to Kubernetes workloads.
Namespace rules
For non-Kubernetes workloads (Docker, systemd, host processes), matches container_id against a glob pattern and assigns a namespace of your choosing. Rules are evaluated in order (first match wins), and user estimation and security attack detection are then aggregated under the namespace you assigned.
Hidden applications
Manages the applications hidden from every screen (the list, the topology, health, incidents). Hiding is reversible and the data is kept, so you can restore an application by showing it again at any time.
Notifications
Configures notifications to external channels when incidents and deployment events occur.
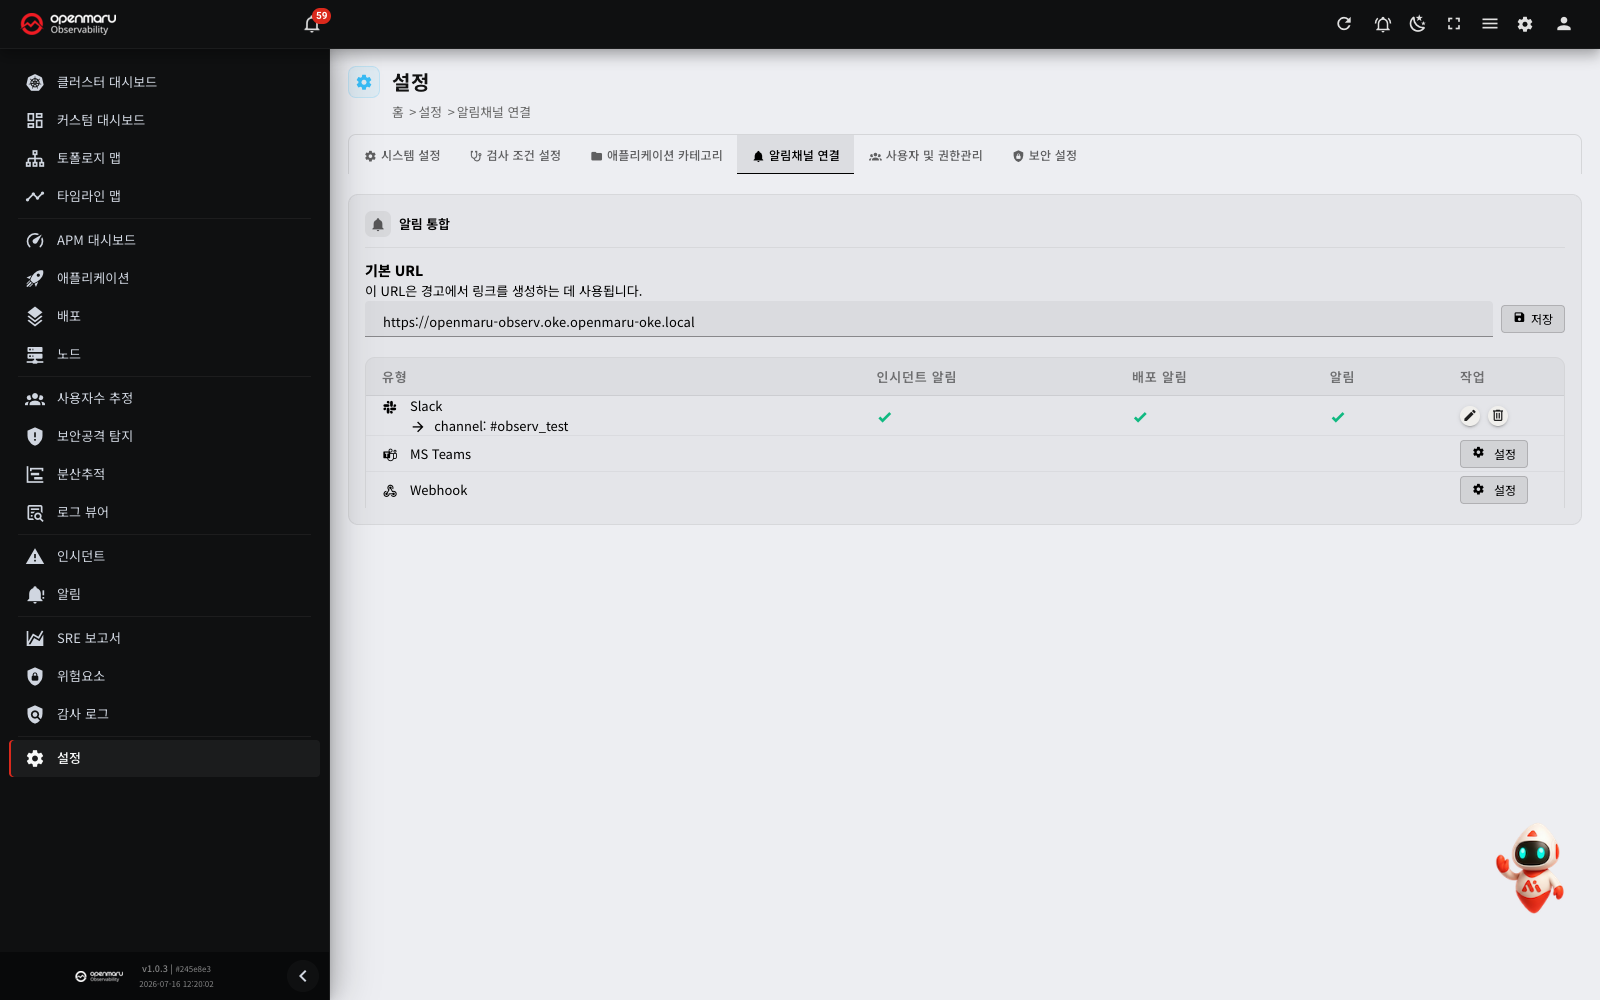
The base URL
The URL the links in alert messages are built from. Enter the URL at which this system can be reached from outside.
- Enter the URL in the Base url field.
- Click Save.
Note: where no base URL is set, the URL of the browser you are currently using is set automatically.
The alert channel list
The supported alert channels appear in a table.
| Column | Description |
|---|---|
| Type | The kind of channel (Slack, MS Teams, email (SMTP), webhook) |
| Notify of incidents | Whether incidents are sent to this channel |
| Notify of deployments | Whether deployments are sent to this channel |
| Notify of alerts | Whether firing alert rules are sent to this channel |
| Actions | The configure, edit and delete buttons |
Channels not yet configured carry a Configure button; those already configured carry edit (pencil) and delete (bin) buttons.
Slack
To receive incident and deployment alerts in a Slack channel:
- Click Configure on the Slack entry.
- Create a Slack app: click Create Slack app to create the app in Slack. Once created, click Install to workspace in Slack to authorise it.
- Slack Bot User OAuth Token: copy the Bot User OAuth Token from the app's OAuth & Permissions page and paste it in.
- Slack channel name: create a public channel in Slack, then enter its name after the
#. - Notify of: use the Incidents and Deployments checkboxes to choose which alerts to receive.
- Click Send test alert to check the configuration is correct.
- Click Save.
Microsoft Teams
To receive alerts in a Microsoft Teams channel:
- Choose the target channel in Teams (or create a new one).
- Click the three dots (...) in the navigation menu at the top and choose Connectors.
- Search for Incoming Webhook and press Configure.
- Enter a name for the webhook and press Create.
- Copy the webhook URL it produces.
- Click Configure on the MS Teams entry of the Configuration page.
- Paste the URL into the Webhook URL field.
- Notify of: use the Incidents and Deployments checkboxes to choose which alerts to receive.
- Click Send test alert to check the configuration is correct.
- Click Save.
Webhooks
A custom webhook lets you integrate freely with an external system.
- Click Configure on the webhook entry.
- Enter the Webhook URL.
- Set the following advanced options where needed.
- Skip TLS verify: enable this where a self-signed certificate is in use (available for HTTPS URLs only)
- HTTP basic auth: enter a username and password
- Custom HTTP headers: add header names and values. Several headers can be added.
- Notify of: use the Incidents and Deployments checkboxes to choose which alerts to receive.
- Incident template: sets the message format sent when an incident occurs.
- Deployment template: sets the message format sent when a deployment occurs.
- Click Send test alert to check the configuration is correct.
- Click Save.
Email (SMTP)
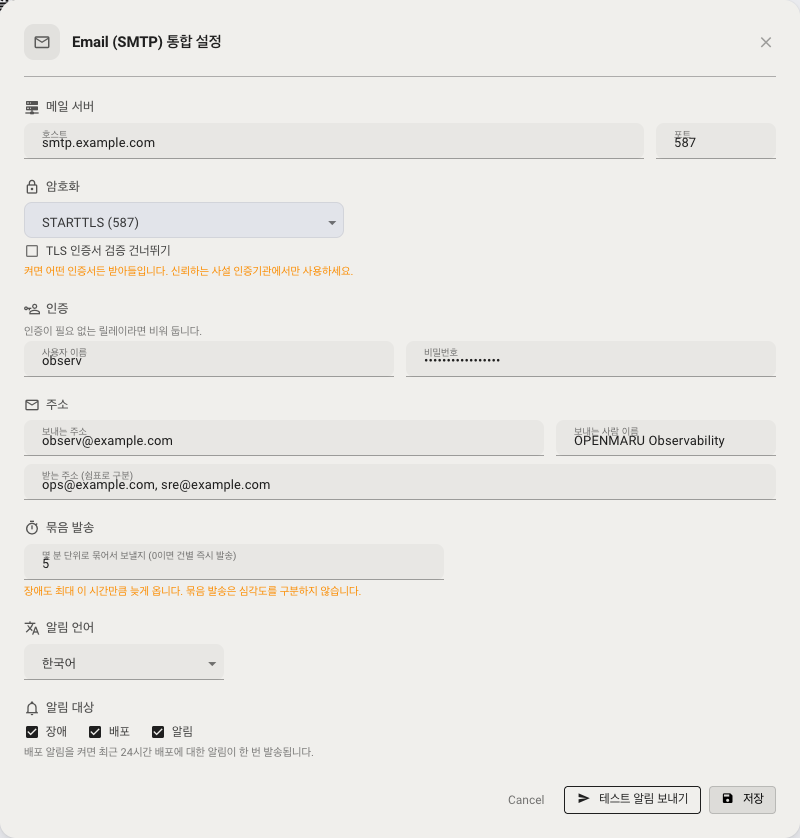
Receive alerts through your own mail server. In an air-gapped network that cannot reach an external SaaS, this is the channel that works.
- Click Configure on the Email (SMTP) row.
- Enter the Mail server host and port.
- Choose the Encryption. Choosing a method also sets the default port, but a port you typed yourself is left alone.
| Method | Default port | Description |
|---|---|---|
| STARTTLS | 587 | Connects in plain text, then upgrades. Fails if the server does not support it |
| TLS | 465 | Encrypted from the first byte |
| None | 25 | No encryption. Authentication is refused on an unencrypted connection |
- Turn on Skip TLS certificate verification if the server uses a certificate from a private CA.
Caution: with this on, any certificate is accepted. Use it only where you trust the private CA.
- Enter the Authentication username and password. Leave them empty for a relay that does not require authentication.
- Enter the Addresses: the from address and from name, and the recipients (comma separated for several).
- Set the Batching interval in minutes. Zero sends each notification immediately.
Caution: batching does not treat severity differently. Incident alerts are also delayed by up to that long. Leave it at zero on a channel where an urgent alert must not wait.
- Choose the Notification language (Korean / English).
- Under Notify of, pick which of incidents, deployments and alerts to receive.
Note: turning deployments on sends one notification covering deployments from the last 24 hours. With batching on, they arrive as a single message.
- Press Send test alert to check the settings.
- Click Save.
What the failures look like
Mail settings rarely come out right first time. When a test send fails, the cause is shown on screen as it came back.
| Text in the message | Cause |
|---|---|
connection refused or i/o timeout | Wrong host or port, or blocked by a firewall |
certificate or x509 | The certificate is not trusted. For a private certificate, turn on skip verification |
Must issue a STARTTLS command first | The server requires encryption but None was selected |
Authentication credentials invalid | Wrong username or password |
Report attachments
Take the scheduled reports from SRE reports over SMTP and the PDF and Excel files arrive as attachments. Where an attachment exceeds the limit (20MB by default), it is left out and the reason is written into the body.
Editing and deleting a channel
- Edit: click the edit button (the pencil icon) on a configured channel to change its settings.
- Delete: click the delete button (the bin icon) to remove the integration.
Incident resolve hold
The Incident resolve hold card is below the Notification integrations card on the Notifications tab. In this card, you set how long the system waits before it resolves an incident.
When the SLO status of an incident returns to normal, the incident is not resolved immediately. If no new SLO violation occurs during this time, the incident is resolved. If a new violation occurs during this time, the same incident continues and no new incident opens. The resolution time is recorded as the time when the SLO first returned to normal. For how incidents open and resolve, refer to the Incidents chapter.
| Item | Value |
|---|---|
| Unit | seconds |
| Range | A whole number from 0 to 3600 |
| Default | 300 seconds (5 minutes). Used when no value is saved |
| 0 | Turns the hold off. The incident is resolved as soon as the SLO is normal |
To change the value
- On the Configuration page, open the Notifications tab.
- In the Incident resolve hold card, enter a value in seconds.
- Click Save.
When the value is saved, the message "Settings were successfully updated." appears. If the value is out of range or is not a whole number, the message "Enter a whole number of seconds from 0 to 3600." appears and the value is not saved.
- The card saves the value only when you click Save. If the base URL is empty, the Notifications tab saves the base URL automatically when you open it. This automatic save does not change the incident resolve hold value.
- If you clear the box and click Save, the saved value is removed and the default of 5 minutes (300 seconds) is used again. After that, the box is empty.
- Of the built-in roles, only Admin can save this value. It is the same permission as the alert channel settings. If another user clicks Save, an error message appears.
- The resolution notification of each incident is sent after the hold time ends. During the hold, the incident stays unresolved in the list, even when the SLO is normal.
Note: the Keep firing for (seconds) setting (KeepFiringFor) of an alerting rule is a different setting. You set that value for each alerting rule, and it applies only to alerts. The value in this card applies to all incidents in the project.
Organization
Manages who can reach the project, and sets each user's permissions through RBAC.
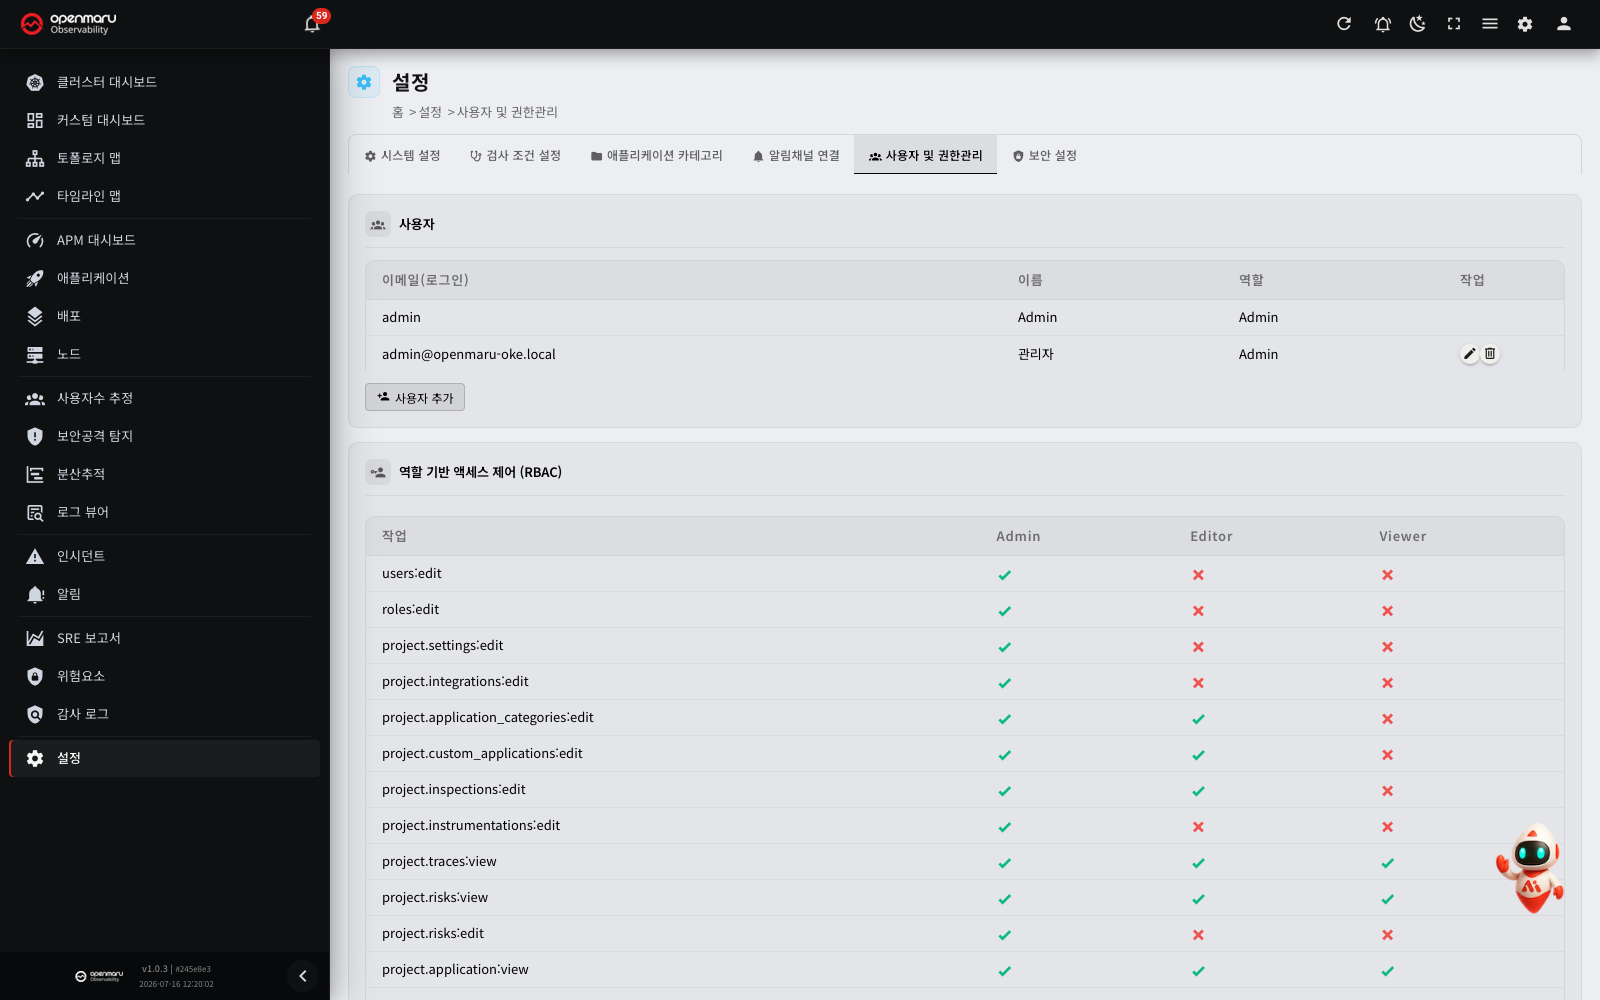
Managing users
The registered users appear as a table.
| Column | Description |
|---|---|
| Login Email | The user's login email address |
| Name | The user's name |
| Role | The role assigned (Admin, Editor, Viewer) |
| Actions | The edit and delete buttons |
Adding a user
- Click Add user.
- Fill in the following in the dialog that opens.
- Login Email: the user's login email address
- Name: the user's name
- Role: the role to grant (Admin, Editor, Viewer)
- Password: the initial password
- Click Create.
Editing a user
- Click the edit button (the pencil icon) on the user you want to change.
- Change the email, name, role or password and click Save.
Note: leaving the password field empty keeps the existing password.
Deleting a user
- Click the delete button (the bin icon) on the user you want to remove.
- Click Delete in the confirmation dialog.
Note: users marked read-only cannot be edited or deleted.
Role-Based Access Control (RBAC)
RBAC governs what each role may do.
OPENMARU Observability provides three built-in roles.
| Role | Description |
|---|---|
| Admin | Full access to everything. Can manage users, change settings and read all data. |
| Editor | Can use most monitoring features. Some administrative functions (user management and so on) are restricted. |
| Viewer | Can read monitoring data only. Cannot change settings. |
The table in the Role-Based Access Control (RBAC) section shows what each role may do.
- A check mark (green): the role is allowed this action
- A list icon (green): the action is allowed for particular objects only (hover over the icon for a tooltip listing them)
- An X (red): the role is not allowed this action
The main actions are as follows.
| Action | Admin | Editor | Viewer |
|---|---|---|---|
| Manage users | Allowed | Denied | Denied |
| Manage roles | Allowed | Denied | Denied |
| Change project settings | Allowed | Denied | Denied |
| Configure alert channels | Allowed | Denied | Denied |
| Configure categories | Allowed | Allowed | Denied |
| Configure custom applications | Allowed | Allowed | Denied |
| Configure inspection conditions | Allowed | Allowed | Denied |
| View distributed traces | Allowed | Allowed | Allowed |
| View risks | Allowed | Allowed | Allowed |
| Edit risks | Allowed | Denied | Denied |
| View applications | Allowed | Allowed | Allowed |
| View servers | Allowed | Allowed | Allowed |
Note: where users with custom roles exist, those roles appear in the RBAC table too. Click a custom role's edit button (the pencil icon) to see its fine-grained permission policy by scope, action and object.
Security
The Security tab manages the IP Whitelist. Register an IP address or CIDR range and traffic from that source is excluded from security attack detection. Use it to stop legitimate traffic, such as internal scanners, health checks and trusted gateways, from being flagged as an attack.
To add an entry, enter an IP address or CIDR range and save; remove entries from the list when they are no longer needed.
Note: for more on security attack detection and security events, see the security chapter.
Related documents
- Quick start - connecting an agent with an API key after installation
- Incidents - the incidents raised by inspection conditions
- Applications - using the category filter in the application list