8.1. Security attack detection
Detecting and analysing security attack patterns in HTTP traffic, in real time.
Overview
Security attack detection analyses the URI of every HTTP request entering the Kubernetes cluster in real time, using eBPF, and detects known attack patterns. It lets you monitor the main web attacks in the OWASP Top 10 — SQL injection, XSS, remote code execution (RCE) — without a separate WAF appliance.
Open it from the Attack Detection menu in the left sidebar.
How detection works
- The agent on each node captures HTTP requests' URI and User-Agent at kernel level, through eBPF.
- It applies URL decoding and double decoding to the URI, so attacks that hide behind encoding are detected too.
- It matches against regular expression patterns based on the OWASP ModSecurity CRS, in real time. The Go RE2 engine is used, which is safe against ReDoS (regular expression denial of service).
- Detected events are classified by type and sent to the server as VictoriaMetrics metrics.
- The server aggregates the events and analyses the geographic distribution of the attack sources using GeoIP.
- Events are stored in the database (retained for 90 days) and pushed to the dashboard over WebSocket every 10 seconds.
What the eBPF approach gives you
| Characteristic | Description |
|---|---|
| Agentless | Works at kernel level with no application code changes, whatever the programming language or framework. |
| Minimal performance impact | Pattern matching happens in the kernel, so the effect on service performance is close to nil. |
| Detection only | It detects without blocking traffic. A false positive therefore has no effect on the service. |
Note: this is a monitoring tool that detects attack patterns and tells you about them. Unlike a WAF (web application firewall), which blocks traffic, it makes attack attempts visible so you can understand your security situation and respond.
Important: the X-Forwarded-For header must be configured Identifying the attacking IP and the geographic distribution both work from the client's real IP address. In environments behind a reverse proxy — an ingress controller, a load balancer, a CDN — the
X-Forwarded-Forheader must be configured to pass through. Without it, every security event's source appears as the proxy's internal IP, and neither IP-based detection nor the GeoIP distribution works properly. For how to configure it, see your ingress controller's documentation (Nginx Ingress'suse-forwarded-headersandcompute-full-forwarded-for, HAProxy Ingress'sforwarded-foroption). For concrete examples per ingress controller, see user estimation.
Two detection sources
Security events are detected along two paths.
| Source | Shown as | Description |
|---|---|---|
| Metric-based (metric) | A "metric" badge | Events the agent detected by matching HTTP URI patterns. Aggregated as a per-second rate by type (SQLi, XSS and so on) and kept as a time series covering the last 4 hours. This is the data behind the KPI cards, the event trend chart and the alerts. |
| IP-based (ip) | The IP address | Attacking IP information tracked with HyperLogLog. To let you spot an attack in progress quickly, it uses only the last 10 minutes of data and lists at most the top 50 IPs by request rate in the event table. Once an attack stops, the IP disappears from the list after 10 minutes. |
Metric-based and IP-based detection are not separate paths. When the agent detects an attack pattern, both the metric (the rate by type) and the IP information (which address it came from) are collected together. The metric-based events are the core data showing the kind and scale of the attack; the IP-based events help you see quickly which addresses the same attack is coming from. IP-based events also carry the attack types (SQLi, XSS and so on) that IP attempted.
The attack types detected
The attack types in detail
Every HTTP request's URI and User-Agent is analysed in real time with eBPF against known attack patterns. 63 patterns in 10 categories, drawn from the OWASP CRS, keep false positives low.
Note: click the information icon (ⓘ) at the top right of the attack detection card to read the information below on screen.
SQL injection HIGH
Inserting malicious code into a SQL query to manipulate the database. The most dangerous attack type in the OWASP Top 10. Twelve patterns are detected, including tautologies, UNION SELECT, time delays (SLEEP/BENCHMARK) and system table access.
Examples: ' OR 1=1-- UNION SELECT SLEEP(5) xp_cmdshell
XSS (cross-site scripting) HIGH
Injecting a malicious script into a web page to steal a user's session or run malicious code. Nine patterns are detected, including script tags, the javascript: protocol, event handlers, data: URIs and DOM manipulation.
Examples: <script>alert(1) javascript: onerror=
RCE (remote code execution) CRITICAL
Running arbitrary commands on the server, exploiting critical vulnerabilities such as Shellshock (CVE-2014-6271) and Log4j JNDI (CVE-2021-44228). Seven patterns are detected, including shell command separators and command substitution.
Examples: ;cat /etc/passwd ${jndi:ldap://} powershell -
Path traversal HIGH
Manipulating directory paths to reach sensitive files on the server (/etc/passwd, /proc/self and so on). URL-encoded (%2e%2e) and double-encoded (%252e%252e) evasion is detected too.
Examples: ../../etc/passwd %2e%2e/ %00
Scanner MEDIUM
Detects the signatures of known vulnerability scanners such as Acunetix, Nessus and Netsparker. This is the reconnaissance stage before an attack, and a real attack may follow.
Examples: acunetix-wvs-test sqlmap UA nikto UA
Path probing MEDIUM
Detects probing of sensitive paths such as administration pages, configuration files and backup files.
Examples: /phpmyadmin/ /.env /.git/config /wp-login.php
SSRF (server-side request forgery) HIGH
Detects attempts to make the server reach internal systems or cloud metadata.
Examples: ?url=http://169.254.169.254 gopher:// dict://
CRLF injection HIGH
Detects attempts to manipulate the response by inserting newline characters into HTTP headers.
Examples: %0d%0aSet-Cookie: %0d%0aHTTP/
RFI (remote file inclusion) HIGH
Detects attempts to make the server include a malicious file from an external URL.
Examples: include=http://evil.com/ php://filter phar://
CVE exploit CRITICAL
Detects the paths of known CVE vulnerabilities such as Spring4Shell and Struts OGNL.
Examples: class.module.classLoader /server-info.action ?-s
Severity levels
The severity badges above are only what the screen (the attack detection information dialog) shows, and may differ from the actual alert severity. When classifying events, the backend maps them onto the following three levels (the RCE badge reads CRITICAL, for instance, but its alert severity is HIGH).
| Level | Colour | Types |
|---|---|---|
| HIGH | Red | RCE, CVE exploit |
| MEDIUM | Orange | SQL injection, XSS, path traversal, SSRF, CRLF, RFI |
| LOW | Grey | Scanner, path probing |
Screen layout
The security attack detection screen is made up of the following areas.
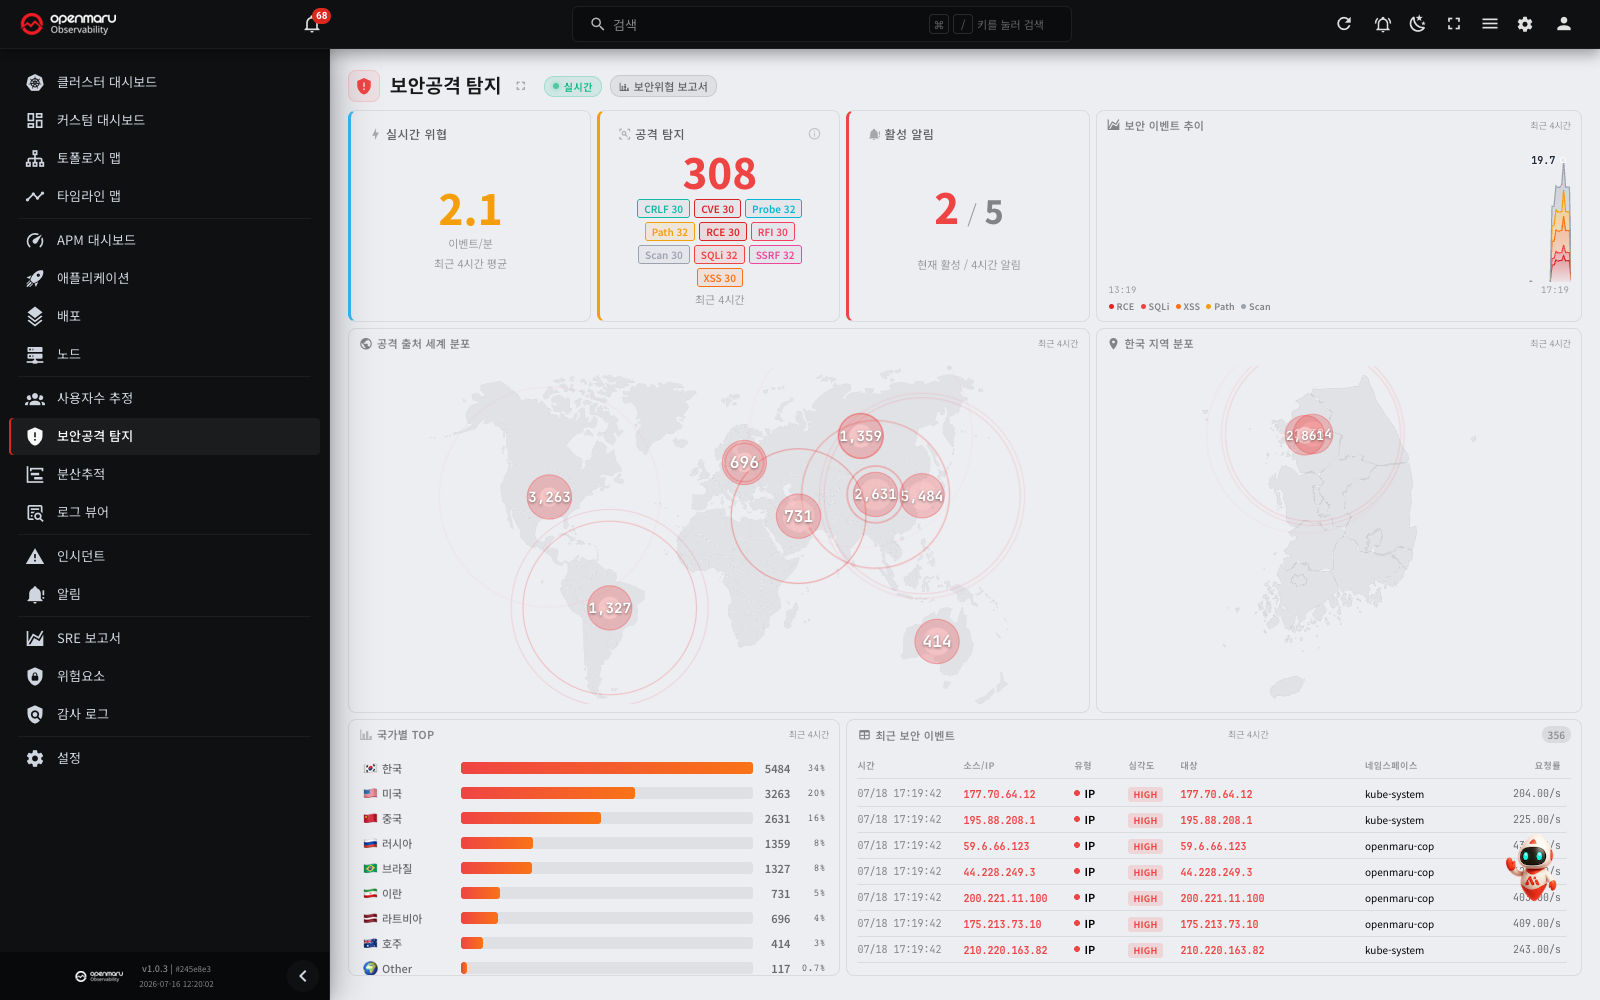
| Area | Description |
|---|---|
| Top header | Real-time connection state, the security threat report button, and the detection exclusion rules |
| KPI cards (row 1, left) | Three cards: live threat, attacks detected, active alerts |
| Event trend chart (row 1, right) | Security events over the last 4 hours (a stacked area chart by attack type) |
| World map (row 2, left) | The worldwide distribution of attack sources (red bubbles) |
| Map of Korea (row 2, right) | The distribution of attack sources across Korea's provinces and metropolitan cities |
| Top countries (row 3, left) | A bar chart of the countries with the most attacks |
| Recent security events (row 3, right) | A table of individual security events (up to 1,000) |
Main features
Checking the real-time connection
The security attack detection screen connects to the server over WebSocket in real time.
| State | Shown as | Description |
|---|---|---|
| Live | A blinking green dot with "Live" | Connected normally. Data refreshes automatically every 10 seconds. |
| Connecting | A loading icon with "Connecting..." | The screen is connecting to the server, or is connecting again automatically after the connection dropped. The seconds until the next attempt are also shown. |
| Disconnected | A red dot with "Disconnected" | The screen did not connect after 10 attempts. The time of the last received data is also shown. The screen continues to try again every 60 seconds. |
When the badge shows Disconnected, a warning bar appears at the top of the screen. Click the Reconnect button to connect again immediately, without a wait for the next attempt. When the server responds again, the screen recovers by itself, so you do not have to refresh the page. For the reconnection intervals, see the "Checking the real-time connection" section in 3.1 Dashboard.
Full screen
Click the full-screen icon in the top header to expand the security dashboard to fill the browser. This is useful for leaving it up on a security operations monitor.
KPI cards
Three KPI cards sit at the left of the first row.

Realtime Threats
Shows security events per minute, averaged over the last 4 hours.
| Colour | Threshold | Meaning |
|---|---|---|
| Green | 0 events/min | No threat |
| Orange | Above 0 up to 10 events/min | Needs attention |
| Red | Above 10 events/min | High threat level |
The change against the previous period is shown alongside — an increase in red (+%), a decrease in green (-%).
Attack Detection
Shows the count per attack type detected over the last 4 hours.
- Where attacks were detected, the total and per-type tags (SQLi, XSS, RCE and so on) are shown in their colours.
- Where none were, a green shield icon and a "Normal" message are shown.
Active Alerts
Shows the number of currently active security alerts alongside the total over the last 4 hours.
- The format is
active / total(for example3 / 12). - Red where there are active alerts, green where there are none.
- Click the card to go to the alert list filtered to the security category.
The event trend chart
Shows security events over the last 4 hours as a stacked area chart, coloured by attack type.
- Each attack type gets its own colour.
- Hover over the chart and the total event count at that moment appears with a vertical guide line.
- The peak is labelled with its value automatically.
- A time axis runs along the bottom.
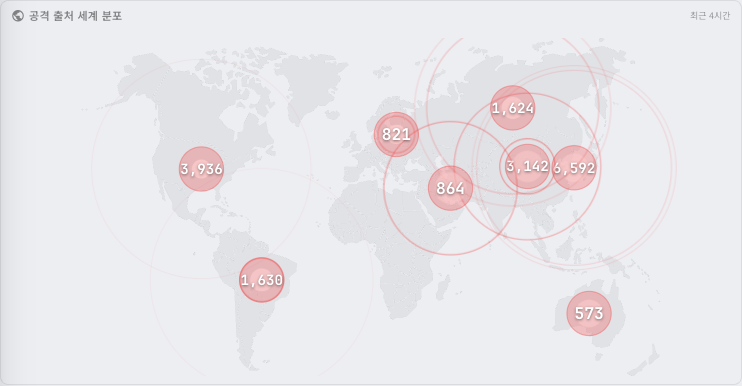
The worldwide distribution of attack sources
Red bubbles on a world map mark the countries attacks came from. A bubble's size is proportional to the number of attacks from that country.
The distribution across Korea
A map of Korea's provinces and metropolitan cities shows where domestic attacks originated.
Top Countries
A horizontal bar chart of the ten countries with the most attacks over the last 4 hours.
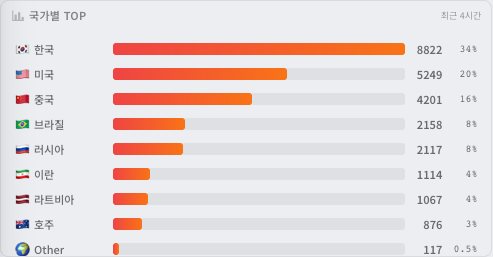
| Element | Description |
|---|---|
| Flag + country name | Identifies the source country |
| Bar | Visualises the proportion against the country with the most attacks |
| Count | Attacks detected from that country |
| Share (%) | The percentage of the total |
Recent Security Events
The individual security events detected over the last 4 hours, as a table. Up to 1,000 are shown, newest at the top.
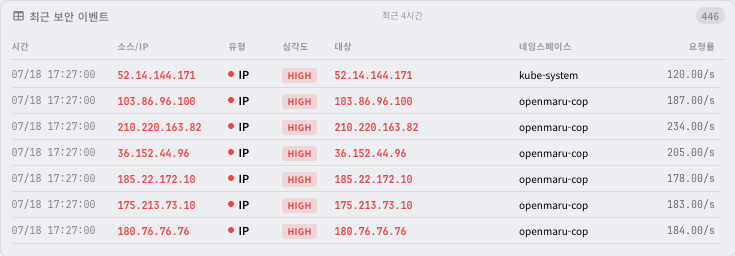
Table columns
| Column | Description |
|---|---|
| Time | When the event occurred |
| Source/IP | Where it was detected. IP-based events show the IP address; metric-based ones show a "metric" badge. |
| Type | The attack type (a colour dot plus the name) |
| Severity | A badge reading HIGH (red), MEDIUM (orange) or LOW (grey) |
| Target | The name of the application attacked. Click it to open that application's detail screen. |
| Namespace | The target application's Kubernetes namespace. Click it to go to the application list filtered to that namespace. |
| Req/s | Requests per second for that event |
The event detail dialog
Click an event row in the table to open its detail dialog.
For an IP-based event:
| Item | Description |
|---|---|
| Attacker IP | The source IP address, with copy and GeoIP lookup buttons. |
| Country / city | The source location from GeoIP (flag + country + city) |
| Detection Type | The attack type (a colour dot plus the name) |
| Req/s | Requests per second |
| Target | The application attacked |
| Namespace | The target's Kubernetes namespace |
For a metric-based event:
| Item | Description |
|---|---|
| Detection method | Reads "Metric-based Detection" |
| Detection Type | The attack type |
| Req/s | Requests per second |
| Target | The application attacked |
Where there are no security events, a green shield icon appears with "No security events detected. System operating normally."
The security threat report
Click the Security Report button in the top header to open the detailed analysis dialog.
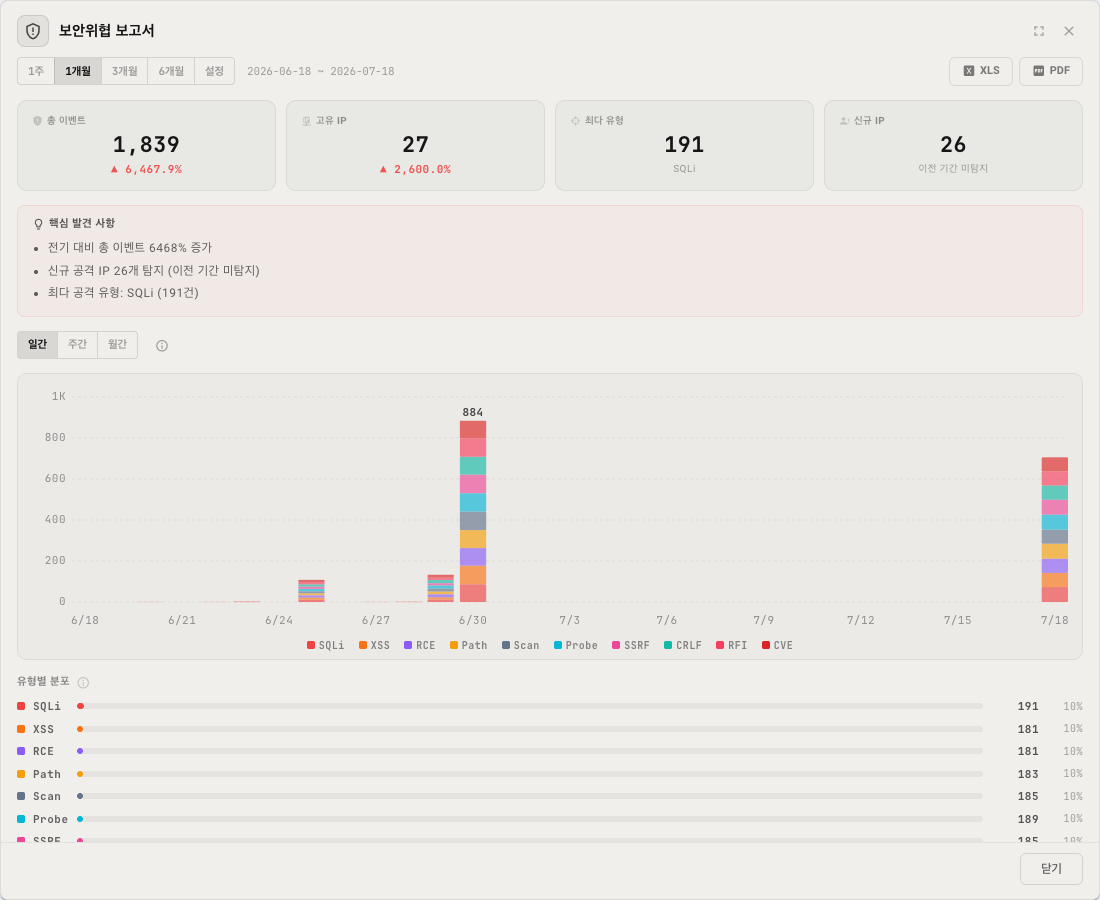
Choosing the period
Choose the analysis period at the top of the report.
| Period | Description |
|---|---|
| 1 Week | The last 7 days |
| 1 Month | The last 30 days |
| 3 Months | The last 90 days |
| 6 Months | The last 180 days |
| Custom | Enter the start and end dates yourself |
KPI cards
Four headline indicators appear as cards at the top of the report.
| KPI | Description |
|---|---|
| Total Events | Security events detected over the selected period, with the change against the previous period. |
| Unique IPs | Distinct IP addresses used in attacks, with the change against the previous period. |
| Top Attack Type | The most frequently detected attack type, and its count |
| New IPs | IPs detected this period that were absent from the previous one |
Key Findings
The system's automatic analysis produces a list of the main insights — a spike in a particular attack type, the peak period, the main source countries and so on.
Type Distribution
Shows how many attacks of each type (SQLi, XSS, RCE, path traversal, scanner and so on) were detected over the selected period, so you can see at a glance which is most frequent.
Trend charts
Shows security events over the selected period as a bar chart. Select the aggregation unit: Daily, Weekly or Monthly.
Top Attack IPs
Lists the 20 IP addresses with the most attacks. For each you can see the following.
| Item | Description |
|---|---|
| IP address | The IP used in the attack |
| Country / region | The location from GeoIP |
| Total count | All events from that IP |
| Attack types | The distribution of attack types that IP attempted |
| First seen | When that IP was first detected |
| Last seen | When that IP was last detected |
New IPs
The IPs that appeared this period but were absent from the previous one. Useful for identifying new attack sources quickly.
Distribution by country
Shows the count and share of attacks per country.
Exporting the report
The report can be exported in the following formats.
| Format | Description |
|---|---|
| A report document including the charts, useful for reporting to management or for keeping. | |
| XLS | A spreadsheet with the detailed data, for further analysis. |
Detection exclusion rules
Where an attack type turns out to be a false positive, you can exclude its detection for a particular application.
Seeing them on the dashboard
Where exclusion rules are active, an Exclusions : N button appears at the right of the top header. Click it to see the exclusion rules currently in force.
| Element | Description |
|---|---|
| Type | The attack type excluded (a colour dot plus the name) |
| Target | The application the exclusion applies to |
| Namespace | The target application's namespace |
| Reason for exclusion | Why it was excluded |
| Created By | The user who created the exclusion |
Click an entry to open that application's detail screen.
Setting them on an application
Manage exclusion rules through the Security Detection Exclusions panel on each application's detail screen.
| Feature | Description |
|---|---|
| Exclude | Excludes alerts for a particular attack type. You can enter a reason. |
| Reactivate | Turns alerts for an excluded attack type back on. |
What an exclusion rule does and does not do:
- Still shown on the charts: after exclusion, events of that type still appear on the charts and in the event table.
- Alerts only are excluded: no alert (incident) is raised for that type.
- Reversible at any time: you can re-enable it whenever you need to.
Security auditor alerts
Beyond security events, the system detects the following anomalies automatically and raises alerts. These are registered automatically as built-in rules, and their thresholds and conditions can be adjusted on the settings screen.
| Alerting rule | Default severity | Pending period | Grace period |
|---|---|---|---|
| DDoS / Traffic spike detected | WARNING | 2 minutes | 5 minutes |
| Brute force attack detected | WARNING | 1 minute | 5 minutes |
| 5xx error rate spike | WARNING | 2 minutes | 5 minutes |
| Security attack pattern detected | WARNING | 1 minute | 5 minutes |
Pending period (For): the condition must hold continuously for this long before an alert fires. This prevents false alerts from momentary spikes. Grace period (KeepFiringFor): the alert is held open for this long after the condition clears. This stops alerts for intermittent attacks from disappearing too quickly.
Traffic spike detection (DDoS-like patterns)
An alert fires when request traffic passes well above the baseline. To avoid false positives from normal increases — the start of the working day, say — it applies three stages of verification.
| Stage | What it checks |
|---|---|
| Stage 1: minimum absolute threshold | Only traffic of at least 0.5 requests per second counts as a spike. This prevents false positives on services that normally see almost no traffic. |
| Stage 2: composite signal analysis | Checks whether the traffic increase is accompanied by a rise in the error rate (5xx). A normal increase (the start of the working day) does not raise errors, so it is filtered out. |
| Stage 3: 7-day EWMA re-verification | Runs only where stages 1 and 2 passed. It calculates an EWMA (exponentially weighted moving average) baseline from the last 7 days of traffic and re-verifies against it. Reflecting weekly patterns (weekday/weekend) and time-of-day variation, this prevents false positives at the start of the working day after a quiet night. |
The default condition: the alert fires when the 15-minute average passes 8× the baseline and holds for at least 2 minutes.
Brute force detection
An alert fires when the proportion of 401/403 responses is abnormally high. To avoid false positives on low-traffic services, it applies three stages of verification.
| Stage | What it checks |
|---|---|
| Stage 1: minimum absolute threshold | The ratio is only judged at 1.0 requests per second or more. This prevents one or two authentication failures on a very quiet service from producing a wildly high ratio. |
| Stage 2: windowed average ratio | The authentication failure ratio is calculated over the last 15 minutes rather than from the last instantaneous value. This prevents false positives from momentary variation. |
| Stage 3: 7-day EWMA re-verification | Runs only where stages 1 and 2 passed. It compares against the EWMA of the authentication failure ratio over the last 7 days, which prevents false positives on services where failures are normally high (a public API, for instance). |
The default condition: the alert fires when authentication failures (401 + 403) exceed 50% of all requests on the 15-minute average and hold for at least 1 minute.
5xx error spike detection
An alert fires when server errors (5xx) pass well above the baseline. To avoid a false positive when one or two errors appear on a service that normally has none, it applies three stages of verification.
| Stage | What it checks |
|---|---|
| Stage 1: minimum absolute threshold | A spike is only judged where the hourly average error rate is at least 0.1 per second (about 6 per minute). This prevents one error on an error-free service from producing a wildly high ratio. |
| Stage 2: ratio check | Checks whether the 15-minute error rate passes 10× the hourly baseline. This prevents false positives from one or two momentary errors. |
| Stage 3: 7-day EWMA re-verification | Runs only where stages 1 and 2 passed. It calculates an EWMA baseline from the last 7 days of error rates and re-verifies against it. Reflecting weekly patterns, this prevents false positives where the hourly average happened to be low. |
The default condition: the alert fires when the 15-minute average passes 10× the baseline and holds for at least 2 minutes.
Attack pattern detection
An alert fires when one of the attack types described above (SQLi, XSS, RCE and so on) is detected in an HTTP URI.
- Counts by type: the alert message carries the detection count per type.
- Exclusions applied: types with a detection exclusion rule are left out of the alert.
Data retention
| Data | Retained for |
|---|---|
| Security events (security_events) | 90 days |
| IP summaries (security_ip_summary) | 365 days |
Data past its retention period is cleaned up automatically each day.
Frequently asked questions
An attack was detected — is it actually blocked?
No. This is a monitoring tool that detects attack attempts and tells you about them. To block traffic you need a separate WAF (web application firewall). You can use the detection information to write WAF rules, or to block a particular IP at the firewall.
There are too many false positives
Where legitimate requests to a particular application are being flagged as attacks, set a detection exclusion rule on that application's detail screen.
Elements removed from the original OWASP patterns to reduce false positives:
The original OWASP ModSecurity CRS patterns contain elements that produce frequent false positives on ordinary web traffic, so the following have been taken out of scope.
- RCE (shell command): the original OWASP pattern treats the URL query separator
&as a shell operator, so an ordinary parameter such as&id=123is flagged as RCE.&is excluded and only;and|are checked. - RCE (Shellshock): the original OWASP pattern matches on
() {alone, which produces false positives on JSONP callbacks and JavaScript function expressions. The scope has been narrowed to match only where a colon or semicolon (:,;) follows the brace. - SSRF (OAuth/OIDC): internal URLs in standard OAuth/OIDC parameters such as
redirect_uriandpost_logout_redirect_uriare part of a normal SSO flow. Nine standard OAuth parameters are excluded automatically so that SSO integrations with Keycloak, Okta, Auth0 and others do not produce false positives.
Types that can still produce false positives:
Attack pattern detection is performed on the HTTP request's URI (the URL path and query parameters) only. Request bodies and responses are not inspected. The false positives below therefore occur only where the pattern string appears in the URI, and can be managed with a detection exclusion rule on that application.
| Type | Common false positive | Recommended action |
|---|---|---|
| XSS (script tag) | Rich text editors (TinyMCE, CKEditor), SVG/XML content, code sharing platforms | Exclude XSS on CMS and editor apps |
| XSS (event handler) | onclick and onload attributes in HTML templates, Vue/Angular event bindings | Exclude XSS on SPA framework apps |
| XSS (iframe/embed) | YouTube and map embeds, CMS form builders, media players | Exclude XSS on apps with embed features |
| XSS (DOM manipulation) | JavaScript framework API documentation, code review tools | Exclude XSS on developer tool apps |
| SQL injection (tautology) | Names containing an apostrophe ("O'Brien"), boolean search parameters | Monitor and exclude if needed |
| SQL injection (hex) | CSS hexadecimal colour codes (0x1a2b3c), hash values | Monitor and exclude if needed |
| SQL injection (system tables) | Database administration tools, analytics dashboards | Exclude SQLi on database admin apps |
| Path traversal (../) | Relative path URLs (../assets/style.css), breadcrumb navigation | Exclude path traversal on static file serving apps |
Because excluded events still appear on the charts, you reduce unnecessary alerts without losing data.
The attack source country is inaccurate
- The source location depends on the GeoIP database, so there is some margin of error.
- Attacks routed through a VPN or proxy appear somewhere other than the attacker's real location.
- Distributed attacks such as botnets can appear across many countries.
There are security events but the KPI card reads 0
The "live threat" figure on the KPI card is a 4-hour average. Very rare, intermittent events can average close to zero. Check the individual events in the event table.
I want to block a particular IP
Find the attacker's IP in the event detail dialog and add it as a blocking rule on your firewall or WAF. The copy button puts the IP on the clipboard, and the GeoIP lookup button gives you its detailed geographic information.