2.2. Installation — Kubernetes
How to install OPENMARU Observability on a Kubernetes cluster.
Overview
OPENMARU Observability is installed on a Kubernetes cluster with a Helm chart. A single chart deploys every component together — server, UI, data stores and agents.
Once installation is complete, the node agent starts collecting metrics, logs, traces and profiling data automatically on every node. There is no need to change application code or install a separate SDK.
Automatic configuration with COP: if you build your platform with OPENMARU COP (Container Orchestration Platform), OPENMARU Observability and the components it depends on (storage provisioner, cert-manager, ingress, SSO, OTel Operator, APM server and more) are installed and configured automatically. In that case the manual Helm procedure in this chapter is not needed. Use this chapter when you want to add OPENMARU Observability on its own to a Kubernetes cluster you already run.
Non-Kubernetes installation: this chapter covers installing on Kubernetes with the Helm chart. Installing and operating the server stack with Docker Compose on an ordinary Linux host without Kubernetes — including air-gapped and offline installation — is also supported and is provided as a separate installation and operations guide. Contact your product representative if you need a non-Kubernetes installation.
Components that get installed
| Component | Role | Deployed as |
|---|---|---|
| Server | Processes collected data and serves it to the UI | StatefulSet (1 replica by default) |
| UI | The web interface you open in a browser | Deployment |
| Cluster Agent | Collects cluster-wide metrics and resource metadata (cluster state) | Deployment |
| Node Agent | Collects system metrics, logs, traces and profiling data on each node | DaemonSet (one per node) |
| ClickHouse | Stores log, trace and profiling data | Deployment |
| VictoriaMetrics | Time-series database that stores metric data | Deployment |
| PostgreSQL | Stores configuration and user information | Deployment |
| kube-state-metrics | Exposes Kubernetes resource state as metrics | Deployment |
| OTel Collector | Receives OpenTelemetry data | Deployment |
System requirements
Kubernetes cluster
| Item | Requirement |
|---|---|
| Kubernetes version | 1.23 or later |
| Helm version | 3.x or later |
| Storage class | A storage class able to provision PersistentVolumes |
Node requirements
The node agent uses eBPF to collect traces and metrics automatically without changing application code. That requires the following.
| Item | Requirement |
|---|---|
| Operating system | RHEL 8.2 or later (or a compatible Linux distribution) |
| Kernel version | 4.16 or later (eBPF support required) |
| CPU architecture | x86_64 (amd64) or arm64 (aarch64) |
| Access rights | Needs host PID, cgroup, tracefs and debugfs access (runs in privileged mode) |
Note: eBPF is a technology for running code safely inside the Linux kernel; the node agent uses it to observe network requests, system calls and more automatically. On kernels older than 4.16 the node agent may not work.
Recommended resources
Below are the default resource requests for each component. They may need adjusting for the size of your cluster.
| Component | CPU (request) | Memory (request) | CPU (limit) | Memory (limit) | Storage |
|---|---|---|---|---|---|
| Server (1 replica) | 500m | 1Gi | - | - | 50Gi |
| UI | 100m | 512Mi | - | - | - |
| Cluster Agent | 100m | 1Gi | - | - | - |
| Node Agent (DaemonSet, per node) | 500m | 500Mi | - | 4Gi | - |
| ClickHouse | 1,000m | 2Gi | - | - | 300Gi |
| VictoriaMetrics | - | - | - | - | 20Gi |
| PostgreSQL | - | 512Mi | - | 512Mi | 5Gi |
Note: VictoriaMetrics has no resource requests or limits set, so specify them in a custom
values.yamlfor a large cluster. The default metric retention is 3 days (--retentionPeriod=3d) and cannot be changed throughvalues.yaml; to extend it you must edit the argument in the VictoriaMetrics deployment template.
Caution: the values above are defaults. Provision enough storage for ClickHouse and VictoriaMetrics according to the size of your cluster and how long you retain data. The more logs and traces you collect, the more storage you need.
Sizing storage capacity (large, medium, small)
PersistentVolume (PVC) capacity grows for different reasons depending on the data. What each store holds, and the main variable that drives its size, is as follows.
| Store | What it holds | What drives capacity | Default PV |
|---|---|---|---|
| ClickHouse | Distributed traces and logs | Traffic volume (requests, spans and log lines per second) — log volume dominates. ClickHouse's own diagnostic logs (system.*_log) are disabled or held to a 7-day TTL by the chart defaults; older charts accumulate them without limit, so apply the current chart settings | 300Gi |
| VictoriaMetrics | Metric time series | Cardinality (number of services and containers) × retention (3 days by default). If it fills up, metric collection stops entirely, so leave headroom | 20Gi |
| Server | Configuration and state + metric query cache | Number of metrics queried | 50Gi |
| PostgreSQL | Configuration DB (users, rules) + alert history + user-count estimation statistics | Alert volume and namespace count × retention (alert and incident history converges on an upper bound at the default 62-day retention) | 5Gi |
Capacity is driven mainly by ClickHouse (traffic) and VictoriaMetrics (cardinality). Below are starting recommendations by cluster size. Monitor actual usage and adjust.
| Size | Environment | ClickHouse | VictoriaMetrics | Server | PostgreSQL |
|---|---|---|---|---|---|
| Small | Development and PoC, 5 nodes or fewer, tens of services | 300Gi (default) — can be reduced in a development environment with few logs | 20Gi (default) | 20–50Gi | 5Gi (default) |
| Medium | Production, 10–30 nodes, moderate traffic | 500–600Gi | 50–100Gi | 50Gi | 10Gi |
| Large | Large scale, 30+ nodes, high traffic | 1Ti or more | 200Gi or more | 100Gi or more | 20Gi or more |
Note: these are starting points derived from the product defaults and general observability sizing practice, not measured benchmarks. They vary with traffic, service count and retention, so start generously and adjust as you watch real usage.
Note: trace and log data (ClickHouse) changes sharply with traffic. When disk usage passes a threshold (70% by default), the oldest data is removed a day at a time so that as much history as possible is kept within the disk you allocated. Rather than fixing a retention period, it is safer to set the disk size to your budget.
Before you install
Check the storage class
OPENMARU Observability uses PersistentVolumes to store data. The Helm chart's default storage class is nfs-client.
Check which storage classes are available in your cluster.
kubectl get storageclass
Note the name of the one you want to use. If it differs from the default (nfs-client), specify it at install time.
Check registry access
All container images are served from registry.openmaru.io. Check that your cluster can reach that registry.
If you use a private registry, set imagePullSecrets. See the Key settings section below.
Note: in an air-gapped environment you must move the images into an internal registry beforehand. Contact OPENMARU technical support for details.
Installing OPENMARU Observability
Step 1: add the Helm chart repository
helm repo add openmaru-observ http://registry.[domain].[tld]:8181/
helm repo update openmaru-observ
Important: replace
[domain].[tld]with the registry domain you were given.
Step 2: install
Install with defaults
helm install -n openmaru-observ --create-namespace \
  openmaru-observ openmaru-observ/openmaru-observ
Install with a specific storage class
If your cluster's storage class is not nfs-client, change it with --set.
helm install -n openmaru-observ --create-namespace \
  --set openmaruObservGlobal.storage.storageClassName=<storage class name> \
  openmaru-observ openmaru-observ/openmaru-observ
Install with an Ingress host
To set the external domain at the same time:
helm install -n openmaru-observ --create-namespace \
  --set openmaruObservServer.ingress.hosts[0].host=observ.example.com \
  openmaru-observ openmaru-observ/openmaru-observ
Install with a custom values.yaml
When you need to change several settings, write a values.yaml file and use it.
helm install -n openmaru-observ --create-namespace \
  -f my-values.yaml \
  openmaru-observ openmaru-observ/openmaru-observ
Step 3: watch the installation
Wait until every Pod reaches Running.
kubectl -n openmaru-observ get pods -w
A successful installation produces output similar to this.
NAME                                              READY   STATUS    RESTARTS   AGE
openmaru-observ-server-0                          1/1     Running   0          3m
openmaru-observ-server-1                          1/1     Running   0          3m
openmaru-observ-ui-xxxxxxxxxx-xxxxx               1/1     Running   0          3m
openmaru-cluster-agent-xxxxxxxxxx-xxxxx           1/1     Running   0          3m
openmaru-node-agent-xxxxx                         1/1     Running   0          3m
openmaru-observ-clickhouse-xxxxxxxxxx-xxxxx       1/1     Running   0          3m
openmaru-observ-victoria-metrics-xxxxxxxxxx-xxxxx 1/1     Running   0          3m
openmaru-observ-postgres-xxxxxxxxxx-xxxxx         1/1     Running   0          3m
openmaru-observ-kube-state-metrics-xxxxx-xxxxx    1/1     Running   0          3m
openmaru-observ-otel-collector-xxxxxxxxxx-xxxxx   1/1     Running   0          3m
When every Pod shows STATUS Running and is ready, installation is complete.
Note: on first start the server can take up to five minutes to initialise its data.
Key settings
You can adjust the following in values.yaml to suit your environment.
Common
| Setting | Default | Description |
|---|---|---|
openmaruObservGlobal.storage.storageClassName | nfs-client | The storage class used by every component |
Server
| Setting | Default | Description |
|---|---|---|
openmaruObservServer.replicas | 1 | Number of server replicas |
openmaruObservServer.resources.requests.cpu | 500m | Server CPU request |
openmaruObservServer.resources.requests.memory | 1Gi | Server memory request |
openmaruObservServer.persistentVolume.size | 50Gi | Server data storage size |
Access (Ingress)
| Setting | Default | Description |
|---|---|---|
openmaruObservServer.ingress.enabled | true | Whether Ingress is enabled |
openmaruObservServer.ingress.className | (none) | Ingress class name |
openmaruObservServer.ingress.hosts | (none) | Hostnames to serve on |
openmaruObservServer.ingress.tls | (none) | TLS certificate settings |
Tip: when using Ingress, set the domain name in
hosts. Configure TLS as well to serve over HTTPS.
If you use an OpenShift Route instead of Ingress:
| Setting | Default | Description |
|---|---|---|
openmaruObservServer.route.enabled | false | Enable the OpenShift Route |
openmaruObservServer.ingress.enabled | change to false | Disable Ingress |
Data stores
| Setting | Default | Description |
|---|---|---|
openmaruObservClickhouse.persistentVolume.size | 300Gi | ClickHouse storage size |
openmaruObservClickhouse.resources.requests.cpu | 1000m | ClickHouse CPU request |
openmaruObservClickhouse.resources.requests.memory | 2Gi | ClickHouse memory request |
openmaruObservPostgres.persistentVolume.size | 5Gi | PostgreSQL storage size |
openmaruObservVictoriaMetrics.storage.size | 20Gi | VictoriaMetrics storage size |
Sizing storage: the PVC defaults above are the minimum for the product to run. What you actually need varies a great deal with the scale you monitor (clusters, nodes, applications), how many logs and traces you collect and how long you retain data, so size a production environment against the guidance below.
Each store holds different data and grows for different reasons.
| Store | What it holds | What drives capacity |
|---|---|---|
| VictoriaMetrics | Metrics (time series) | Time-series cardinality, proportional to the number of monitored objects (clusters, nodes, applications, containers) × retention (3 days by default for metrics) |
| ClickHouse | Logs, traces, profiles | Volume collected × retention — the largest of the three stores and the most variable. It grows fastest where there are many logs |
| Server data (cache) | Metric query cache | Proportional to metric cardinality × cache retention |
| PostgreSQL | Configuration and user information + alert history and user-count estimation statistics | Alert and incident history converges on an upper bound at the default 62-day retention (tied to the metric cache TTL) — proportional to alert volume within that window. If the volume fills, the whole database stops, so leave headroom (default 5Gi) |
Sizing guidance:
- The more clusters and applications you have, the more metric time series (cardinality) you get, and the larger VictoriaMetrics and the server cache need to be.
- The more logs and traces you collect, the more ClickHouse grows — by far the most. If some services log heavily, set
openmaruObservClickhouse.persistentVolume.sizegenerously. - The longer you retain data, the more every store grows, in proportion.
- Start larger than the defaults and adjust as you watch real usage. If you run short, expand the PVC (where the storage class supports volume expansion) or shorten retention.
Log retention and tiered storage
ClickHouse keeps logs for 7 days by default. To change the retention, use the server environment variable LOGS_TTL. Put server environment variables in the openmaruObservServer.env list.
When you keep logs for a long time, the ClickHouse disk becomes large. In this case, you can use tiered storage. With tiered storage, recent logs stay on the existing ClickHouse volume (hot). Logs older than a set period move to a separate volume (cold). Tiered storage is off by default. Trace and profile data do not move. They stay on the existing volume.
To turn on tiered storage, set the server environment variables and the ClickHouse values together.
Server environment variables (openmaruObservServer.env)
| Environment variable | Default | Description |
|---|---|---|
LOGS_TTL | 7d | Log retention. For example, 30d or 180d |
LOGS_STORAGE_POLICY | (none) | Set to hot_cold to turn on tiered storage. Set it only when tieredStorage.enabled on the ClickHouse side is true |
LOGS_HOT_TTL | 15d | How long logs stay on the hot volume. It must be shorter than LOGS_TTL. If it is equal or longer, the server does not start |
LOGS_COLD_GUARD_THRESHOLD | 0.9 | If the cold volume usage (0 to 1) is equal to or more than this value, the server shortens the log retention. 0 turns off this check |
ClickHouse values (openmaruObservClickhouse.tieredStorage.*)
| Setting | Default | Description |
|---|---|---|
openmaruObservClickhouse.tieredStorage.enabled | false | Turns tiered storage on or off |
openmaruObservClickhouse.tieredStorage.cold.type | pvc | The cold storage type: pvc (a block storage PVC) or s3 (S3-compatible object storage) |
openmaruObservClickhouse.tieredStorage.cold.size | (none) | The cold volume size. Necessary for pvc. Calculate it as (retention − hot period) × daily log growth |
openmaruObservClickhouse.tieredStorage.cold.storageClass | (none) | The storage class of the cold volume. Necessary for pvc. If you set nfs-client or local-path, the installation fails |
openmaruObservClickhouse.tieredStorage.cold.allowUnenforcedSize | false | Set to true only if you use nfs-client or local-path on a disk that is only for this volume, so that the disk limits the size |
openmaruObservClickhouse.tieredStorage.cold.node | (none) | Necessary for local-path. The name of the node that has the cold disk. ClickHouse runs on this node |
openmaruObservClickhouse.tieredStorage.cold.s3.endpoint | (none) | Necessary for s3. The address, including the bucket and the prefix. Create the bucket before you install |
openmaruObservClickhouse.tieredStorage.cold.s3.accessKey / secretKey | (none) | Both are necessary for s3 |
openmaruObservClickhouse.tieredStorage.moveFactor | 0.25 | If the free space on the hot volume becomes less than this ratio, old logs move to cold before their period ends |
Example: keep logs for 180 days and move logs older than 15 days to a cold PVC.
openmaruObservServer:
  env:
    - name: LOGS_TTL
      value: "180d"
    - name: LOGS_STORAGE_POLICY
      value: "hot_cold"
    - name: LOGS_HOT_TTL
      value: "15d"

openmaruObservClickhouse:
  tieredStorage:
    enabled: true
    cold:
      type: pvc
      size: 1Ti
      storageClass: <storage class name>
Caution: always set
LOGS_STORAGE_POLICYandtieredStorage.enabledtogether. If you setLOGS_STORAGE_POLICYon the server but do not turn on the ClickHouse side, the server cannot prepare the log table. Log collection then stops.
Caution: after you turn on tiered storage, you cannot turn it off fully. If you clear
LOGS_STORAGE_POLICY, logs stop moving. But the log table continues to refer to the cold volume. If you remove the cold volume, ClickHouse does not start.
Caution: the cold volume check deletes old logs. If the cold volume usage is equal to or more than the threshold, the server shortens the log retention by 10% every 10 minutes. The retention does not become shorter than 2 ×
LOGS_HOT_TTL. The server does not make a shortened retention longer again. If an audit requirement tells you to keep all logs for a set period, setLOGS_COLD_GUARD_THRESHOLDto0.
Tip: turn on tiered storage while there are few logs. When you turn it on, all stored logs older than
LOGS_HOT_TTLmove to cold at one time. If there are many logs, this move takes a long time and uses the disk at the same time as log collection. When you turn on tiered storage,LOGS_TTLmust be longer thanLOGS_HOT_TTL. If it is not, the server stops at start with a configuration error. The default values (LOGS_TTL7 days,LOGS_HOT_TTL15 days) do not meet this condition. Thus set the two values at the same time asLOGS_STORAGE_POLICY.
UI
| Setting | Default | Description |
|---|---|---|
openmaruObservUi.config.use_cogentai | false | Whether CogentAI (AI analysis) is enabled |
openmaruObservUi.config.cop_console_url | (none) | COP console URL (set when integrating) |
openmaruObservUi.config.readtimeout_ms | 300000 | Read timeout for server requests (ms, 5 minutes by default) — raise for large queries |
openmaruObservUi.config.writetimeout_ms | 300000 | Write timeout for server requests (ms, 5 minutes by default) |
Cluster agent
| Setting | Default | Description |
|---|---|---|
openmaruClusterAgent.config.api_key | (none) | API key used to authenticate to the server |
openmaruClusterAgent.config.metrics.scrape.interval | 15s | Metric collection interval |
openmaruClusterAgent.config.profiles.scrape.interval | 1m | Profile collection interval |
openmaruClusterAgent.config.config.update.interval | 60s | Configuration sync interval |
openmaruClusterAgent.resources.requests.cpu | 100m | CPU request |
openmaruClusterAgent.resources.requests.memory | 1Gi | Memory request |
Node agent
| Setting | Default | Description |
|---|---|---|
openmaruObservNodeAgent.resources.requests.cpu | 500m | CPU request per node |
openmaruObservNodeAgent.resources.requests.memory | 500Mi | Memory request per node |
openmaruObservNodeAgent.resources.limits.memory | 4Gi | Memory limit per node (no CPU limit by default) |
openmaruObservNodeAgent.tolerations | All nodes allowed | Which nodes the agent is deployed to |
Note: the node agent is deployed as a DaemonSet, one per node. By default it is deployed to every node, including tainted ones. To exclude particular nodes, adjust
tolerationsoraffinity.
Node agent runtime options
The following options tune node agent behaviour in detail. With Helm, set them as openmaruObservNodeAgent.<Helm value>; outside Helm (Docker Compose, systemd) set them as environment variables (or command-line flags of the same name).
Log volume control — protects agent CPU and storage from a container that floods logs (added in v1.0.3). New installations enable this by default, capping a runaway container's logs. Set the value to 0 if you need everything forwarded.
| Helm value / environment variable | Default | Description |
|---|---|---|
logMessagesPerContainerPerSec / LOG_MESSAGES_PER_CONTAINER_PER_SEC | 100 | Rate limit for INFO, DEBUG and unclassified logs per container (per second). 0 disables |
(not exposed in Helm) / LOG_MESSAGES_BURST | 0 | Burst allowance for the rate limit above. 0 means twice the limit |
logDedupFirstNPerSec / LOG_DEDUP_FIRST_N_PER_SEC | 5 | For repeated WARN-and-above logs, pass only the first N per second per (level, pattern). 0 disables |
logDedupEveryNth / LOG_DEDUP_EVERY_NTH | 100 | After the first N, forward only one in every M |
(not exposed in Helm) / LOG_PATTERNS_PER_CONTAINER | 256 | Maximum distinct log patterns per container and level |
(not exposed in Helm) / DISABLE_LOG_PARSING | false | Disable container log parsing entirely |
Note: logs dropped by rate limiting and deduplication are exposed in the
container_log_messages_dropped_totalmetric, so you can see how much was capped (per-level counts are preserved).
TLS instrumentation denylist — excludes binaries whose Go/OpenSSL TLS uprobe instrumentation would load the entire symbol table and cause memory to spike.
| Helm value / environment variable | Default | Description |
|---|---|---|
tlsInstrumentDenylist / TLS_INSTRUMENT_DENYLIST | argocd,argocd-dex,karmada-controller-manager,karmada-scheduler,karmada-webhook,karmada-aggregated-apiserver,karmada-agent | Binary names or absolute paths to exclude from TLS uprobe instrumentation (comma separated). Empty means instrument everything |
Host process monitoring — also monitors standalone host processes running outside Kubernetes.
| Helm value / environment variable | Default | Description |
|---|---|---|
(not exposed in Helm) / TRACK_STANDALONE_PROCESSES | false | Monitor host processes that set the OBSERV_APP_NAME environment variable (app ID: /host-process/<name>:<port>). Mainly used with Compose and systemd installations |
OTel Collector
| Setting | Default | Description |
|---|---|---|
openmaruObservOTelCollector.enabled | true | Whether the OTel Collector is enabled |
openmaruObservOTelCollector.OPENMARU_OBSERV_API_KEY | openmaru-observ-api-key | Key that authenticates incoming OpenTelemetry data |
Tip: if you already have applications instrumented with OpenTelemetry, their data can be collected too, through the OTel Collector.
Installing the node agent separately
The node agent is included in the main Helm chart and installed with it. Installing with Helm as described above deploys the node agent as a DaemonSet, so it lands on every node in the cluster automatically — there is no need to add nodes one by one.
The procedure below is needed only when you must add the node agent to a Linux server that is not part of Kubernetes, or to a separate cluster.
Note: to send data to the server, the node agent needs the OPENMARU Observability URL and an API key. Create the API key on the Settings > General tab (creating one requires the Admin role) and supply the URL and key at install time.
Installing directly on a Linux server
You can install the node agent directly on a Linux server that is not running Kubernetes.
Requirements:
- Linux operating system (x86_64 or arm64)
- Kernel version 4.16 or later
- systemd support
- root privileges
The node agent is registered as a systemd service so that it starts automatically; the OPENMARU Observability URL and API key are supplied as environment variables at install time. Detailed commands and scripts for a direct Linux install are provided in a separate installation and operations guide (ask your product representative).
Trusting the certificate in your browser
If HTTPS is served with a certificate issued by an internal certificate authority (CA), this procedure must be carried out once on every PC that connects. This applies to closed networks that use an internal domain such as .local.
If you use a public certificate (Let's Encrypt and similar), you can skip this section.
Why it is needed
If the certificate is not in the trust store, two problems follow.
First, a warning screen appears every time you connect. The browser shows "Your connection is not private" with the error NET::ERR_CERT_AUTHORITY_INVALID.
Second, even if you dismiss the warning each time, the live screens stop periodically. Clicking Advanced > Proceed does let you in, but that is not permanent — it is a temporary exception that lasts only seven days. After seven days the exception disappears, and at that point the dashboard's live connection (WebSocket) is cut. The browser cannot show a warning screen for a live connection; it simply fails the connection, so the screen stays as it is and only the data stops updating. This is a particular problem where an APM dashboard is left open for long periods.
Adding the certificate to the trust store removes both problems.
Step 1: obtain the certificate file
Ask your system administrator for the internal root CA certificate file (.crt or .pem).
If the administrator extracts it themselves, it can be obtained from the Kubernetes cluster with the commands below.
# Download the full certificate chain used by the Ingress
kubectl -n kube-system get secret wildcard-tls \
  -o jsonpath='{.data.tls\.crt}' | base64 -d > full-chain.pem

# Take only the second certificate (the root CA)
awk '/BEGIN CERT/{n++} n==2' full-chain.pem > openmaru-ca.crt

# Check — it must show CA:TRUE
openssl x509 -in openmaru-ca.crt -noout -subject -dates -ext basicConstraints
Note: the Secret name and namespace can differ between installations. If the command above does not work, check the Ingress configuration or ask your product representative.
Note the certificate's fingerprint before distributing it, so you can confirm that the right certificate was installed on each PC.
openssl x509 -in openmaru-ca.crt -noout -fingerprint -sha256
Step 2 (Windows): install the certificate
On Windows, add it to the Trusted Root Certification Authorities store. There are two ways; the result is the same.
Option A. Through the UI
- Double-click the
openmaru-ca.crtfile. - Click Install Certificate.
- Choose Local Machine as the store location and click Next.
- Click Yes if User Account Control (UAC) prompts you. Administrator rights are required.
- Choosing Current User applies it only to that account. Choose Local Machine if several people use the PC.
- Select Place all certificates in the following store and click Browse.
- Choose Trusted Root Certification Authorities and click OK.
- Click Next > Finish.
- The message "The import was successful" means it is registered.
Caution: if you leave step 4 on Automatically select the certificate store based on the type of certificate (the default), it is placed in a different store and has no effect. Always choose the store explicitly.
Option B. From the command line
Open a command prompt as administrator and run:
certutil -addstore -f Root openmaru-ca.crt
Output ending in CertUtil: -addstore command completed successfully. means it is registered.
Confirm with:
certutil -store Root | findstr /i "openmaru"
Many PCs — deploy by Group Policy
In an Active Directory domain you can deploy it to every PC at once with Group Policy, without visiting each machine.
-
Open the Group Policy Management Editor on a domain controller.
-
Navigate to:
Computer Configuration → Policies → Windows Settings → Security Settings→ Public Key Policies → Trusted Root Certification Authorities -
Right-click in the right pane and choose Import.
-
Select
openmaru-ca.crtand complete the wizard.
PCs pick the policy up at the next refresh (within 90 minutes by default) or on reboot. To apply it immediately, run gpupdate /force on that PC.
Step 2 (macOS): install the certificate
On macOS, add it to the System keychain and set it to Always Trust. Adding it without setting trust leaves the warning in place, so do both steps.
Option A. Through the UI
- Double-click
openmaru-ca.crt. Keychain Access opens.- If asked which keychain, choose System.
- Enter your administrator password.
- Select the System keychain on the left in Keychain Access and find the certificate you just added. Its name starts with
ca.followed by your internal domain. - Double-click that certificate.
- Expand Trust.
- Change When using this certificate to Always Trust.
- Close the window and enter your administrator password to save.
- A blue
+badge on the certificate icon in the list means trust is applied.
Option B. From the command line
Run the following in Terminal. It adds the certificate and sets trust in one step.
sudo security add-trusted-cert -d -r trustRoot \
  -k /Library/Keychains/System.keychain openmaru-ca.crt
Enter your administrator password to finish.
The options mean:
| Option | Meaning |
|---|---|
-d | Apply for all users (without it, only the current user) |
-r trustRoot | Trust as a root certificate authority |
-k /Library/Keychains/System.keychain | Store in the System keychain |
Confirm with:
security find-certificate -a -c "ca." /Library/Keychains/System.keychain | head
Step 3: verify
Quit the browser completely and start it again. Closing the tab is not enough.
- Open the OPENMARU Observability address.
- A padlock icon with no warning in the address bar means it worked.
- Check that the Live badge at the top of the dashboard is active.
To check from the command line, run the following, replacing address with the real address.
# macOS and Linux
echo | openssl s_client -connect address:443 -servername address 2>&1 | grep 'Verify return code'
| Output | Meaning |
|---|---|
Verify return code: 0 | Registered correctly |
Verify return code: 19 | Not registered yet |
Return code 19 is followed by (self-signed certificate in certificate chain). It means this PC does not know the authority at the top of the certificate chain.
Browser differences
| Browser | Trust store it uses | Extra work |
|---|---|---|
| Chrome, Edge (Windows) | Windows certificate store | None |
| Chrome, Safari (macOS) | macOS System keychain | None |
| Firefox (all operating systems) | Its own trust store | Procedure below |
Firefox does not use the operating system trust store, so it needs the certificate separately.
- Go to Settings > Privacy & Security.
- Scroll down and click View Certificates.
- Select the Authorities tab and click Import.
- Select
openmaru-ca.crt. - Tick Trust this CA to identify websites and click OK.
Note: if you connect to several clusters, each has its own certificate. Register the certificate for every environment you use.
Confirming the installation
Check connection status in the UI
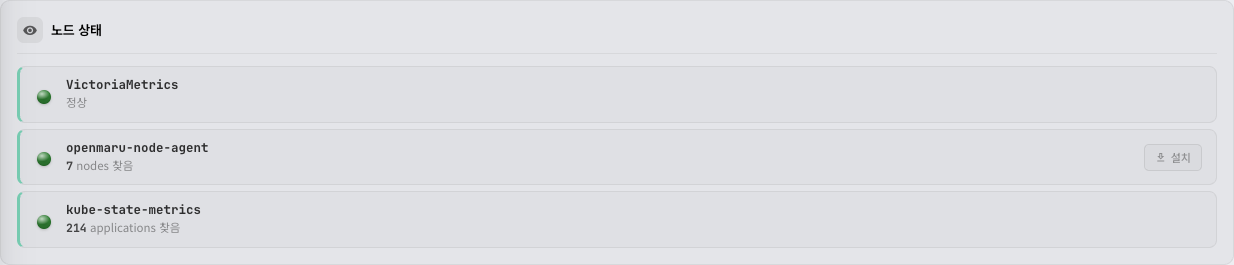
After installation, check each component's connection status on the General tab of the Settings menu.
- Click Settings at the bottom of the left menu.
- Look at the Server Status section of the General tab.
| Item | Healthy state |
|---|---|
| VictoriaMetrics | Healthy |
| openmaru-node-agent | N nodes Found |
| kube-state-metrics | N applications Found |
When every item is healthy, installation is complete.
Tip: right after the agents are installed it can take one to two minutes before the first data reaches the server. If the status does not appear at once, refresh the page after a moment.
Check data on the dashboard
- Click Cluster Dashboard in the left menu.
- Check that CPU and memory usage appear on the cluster resource gauges.
- Check that the cluster's Pods appear on the Pod map.
If data appears, OPENMARU Observability is collecting normally.
Check with kubectl
The following command shows the state of every component.
kubectl -n openmaru-observ get pods
What to look for:
- Every Pod shows STATUS
Running. - One node agent Pod is running on each node.
- The cluster agent Pod is running.
Upgrading
Use helm upgrade to move an installed OPENMARU Observability to a new version.
Step 1: update the chart repository
helm repo update openmaru-observ
Step 2: run the upgrade
helm upgrade -n openmaru-observ \
  openmaru-observ openmaru-observ/openmaru-observ
If you use a custom values.yaml:
helm upgrade -n openmaru-observ \
  -f my-values.yaml \
  openmaru-observ openmaru-observ/openmaru-observ
Step 3: confirm the upgrade
kubectl -n openmaru-observ get pods -w
When every Pod has been replaced with the new version and is Running, the upgrade is complete.
Caution: data collection can pause briefly while the server restarts during an upgrade. The server is deployed with a RollingUpdate strategy, so replicas are replaced one at a time.
Removal
To remove OPENMARU Observability from the cluster, run:
helm uninstall -n openmaru-observ openmaru-observ
Caution: PersistentVolumeClaims (PVCs) are not deleted automatically when Helm uninstalls. To delete the data completely, remove the PVCs manually.
kubectl -n openmaru-observ get pvc
kubectl -n openmaru-observ delete pvc <PVC name>
Troubleshooting
Cannot connect to VictoriaMetrics (the metric store)
- Check that the server Pod is running.
- Check the VictoriaMetrics Pod logs for errors.
kubectl -n openmaru-observ logs <victoria-metrics-pod-name>
Node agents are not detected
- Check that the node agent Pod is
Runningon every node. - Check that the API key is set correctly.
- Check the node agent Pod logs for connection errors.
kubectl -n openmaru-observ logs <node-agent-pod-name>
kube-state-metrics is not detected
- Check that the kube-state-metrics Pod is running in the cluster.
- Check that
openmaruObservKubeStateMetrics.enabledistruein the Helm chart.
The node agent Pod does not start
- Check that the node's Linux kernel is 4.16 or later.
- The node agent must run in privileged mode. Check that your cluster's security policy allows it.
- Check the Pod events.
kubectl -n openmaru-observ describe pod <node agent Pod name>
Storage errors
- Check that the storage class you specified exists in the cluster.
kubectl get storageclass
- Check that the environment can provision PersistentVolumes automatically.
- If capacity is short, adjust that component's storage size in
values.yamland upgrade.
Tip: see the Troubleshooting document for more.
Related documents
- Quick start — checking your first data and touring the main features after installing
- Settings — API key management, inspection conditions, alert channels
- Nodes — the node list and agent status
- Troubleshooting — problems that can arise during installation and operation, and how to resolve them