8.3. Audit logs
Querying and analysing Kubernetes and operating system audit events.
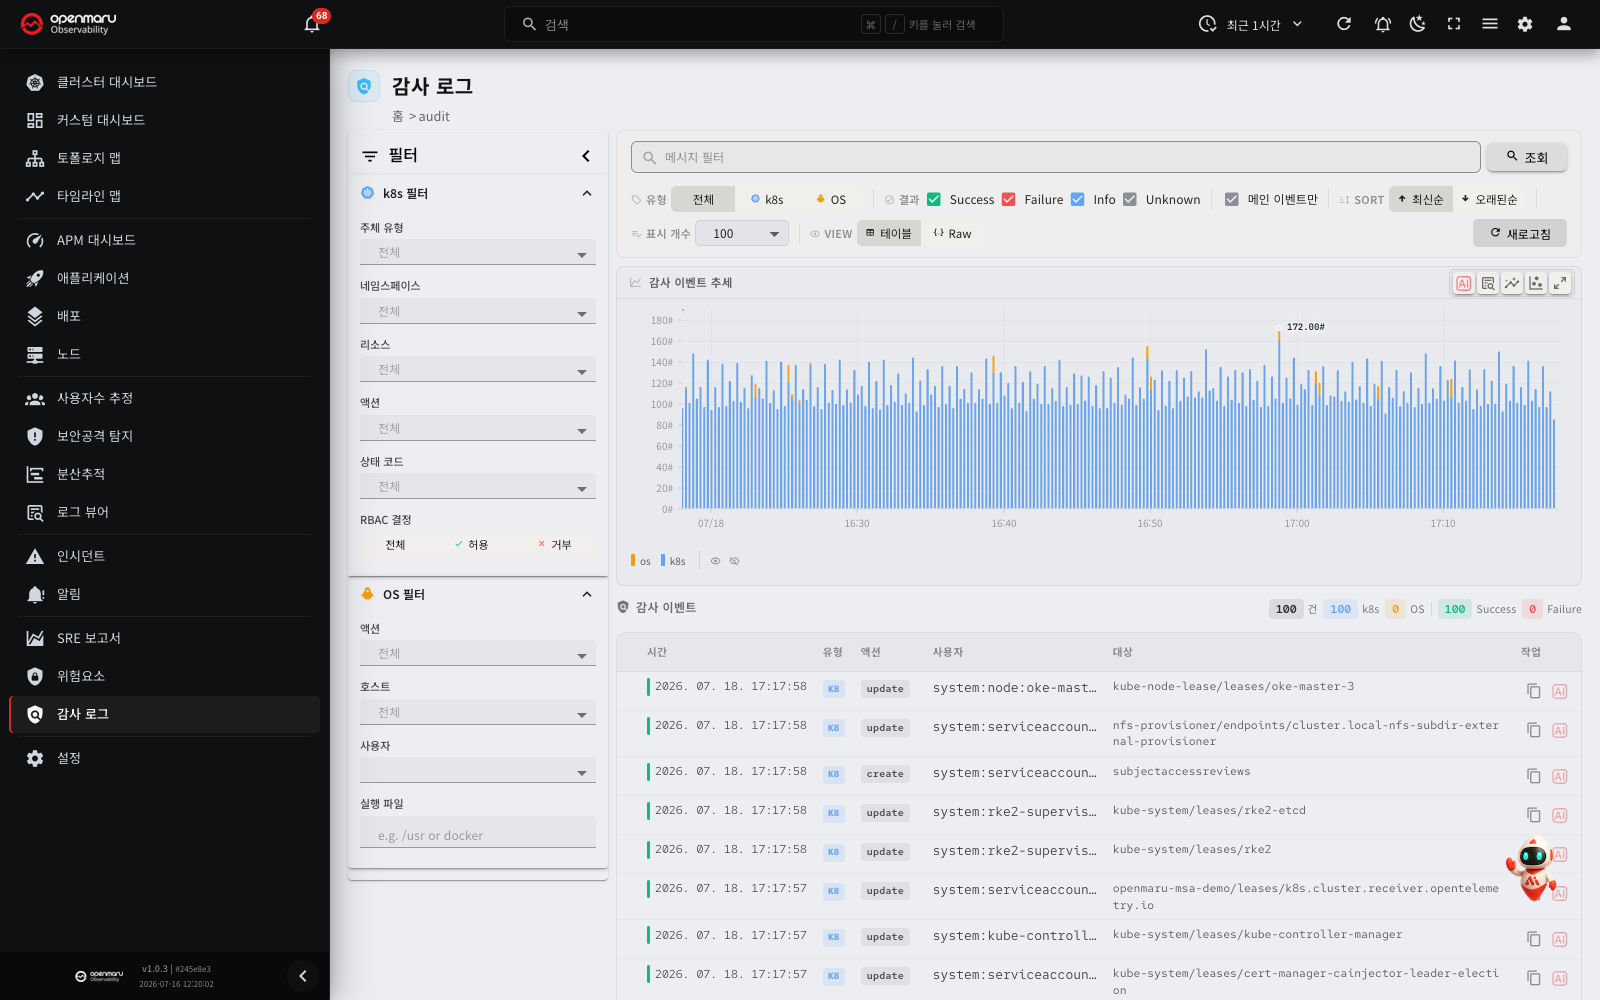
Overview
The audit log screen lets you query the audit events produced by the Kubernetes API server and by the servers' operating systems. Because it records who did what to which resource and when, it serves security auditing and change history alike.
Audit logs come in two kinds.
- k8s: events recorded by the Kubernetes API server. These cover the creation, modification and deletion of Kubernetes resources such as pods, Deployments and ConfigMaps, along with access records.
- OS: events recorded by a server's operating system. These cover system calls, user authentication, command execution and other activity at OS level.
Reach this screen from the Audit logs menu in the left sidebar.
Screen layout
The audit log screen has a filter panel on the left and a main content area on the right.
The filter panel
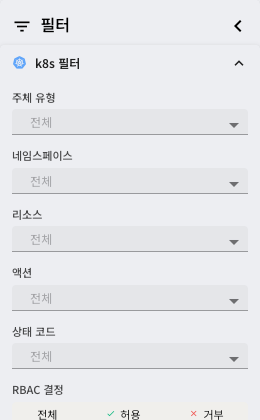
Set detailed filters for k8s events and OS events separately. Each filter section is an accordion you can expand and collapse, and the close button at the top of the panel hides it altogether to give the event list more room.
k8s filters
| Filter | Description |
|---|---|
| Subject type | The kind of subject that raised the event: user, service account or system |
| Namespace | The Kubernetes namespace the event occurred in. Several can be selected |
| Resource | The kind of resource affected. Several of pods, deployments, services, secrets, configmaps, nodes, namespaces, persistentvolumeclaims, roles, rolebindings and clusterroles can be selected |
| Action | The operation performed. Several of get, list, watch, create, update, patch, delete and deletecollection can be selected |
| Status code | The HTTP response code range: 2xx (success), 4xx (client error) or 5xx (server error) |
| RBAC decision | The result of the permission check: all, allow or deny |
Note: selecting a value in the k8s filters switches the type to k8s automatically.
OS filters
| Filter | Description |
|---|---|
| Action | The kind of OS event. Several of SYSCALL, EXECVE, USER_AUTH, USER_LOGIN, USER_CMD, SERVICE_START, SERVICE_STOP, NETFILTER_CFG and AVC can be selected |
| Host | The hostname of the server the event occurred on. Several can be selected |
| User | The OS user that raised the event |
| Executable | The path of the executable involved. Partial text matches (/usr or docker, for instance) |
Note: selecting a value in the OS filters switches the type to OS automatically.
Note: a badge beside each filter section's title gives the number of filters currently applied.
The main content area
To the right of the filter panel sit the search bar, the query options bar, the event trend chart and the event list, in that order.
Main features
Searching and querying events
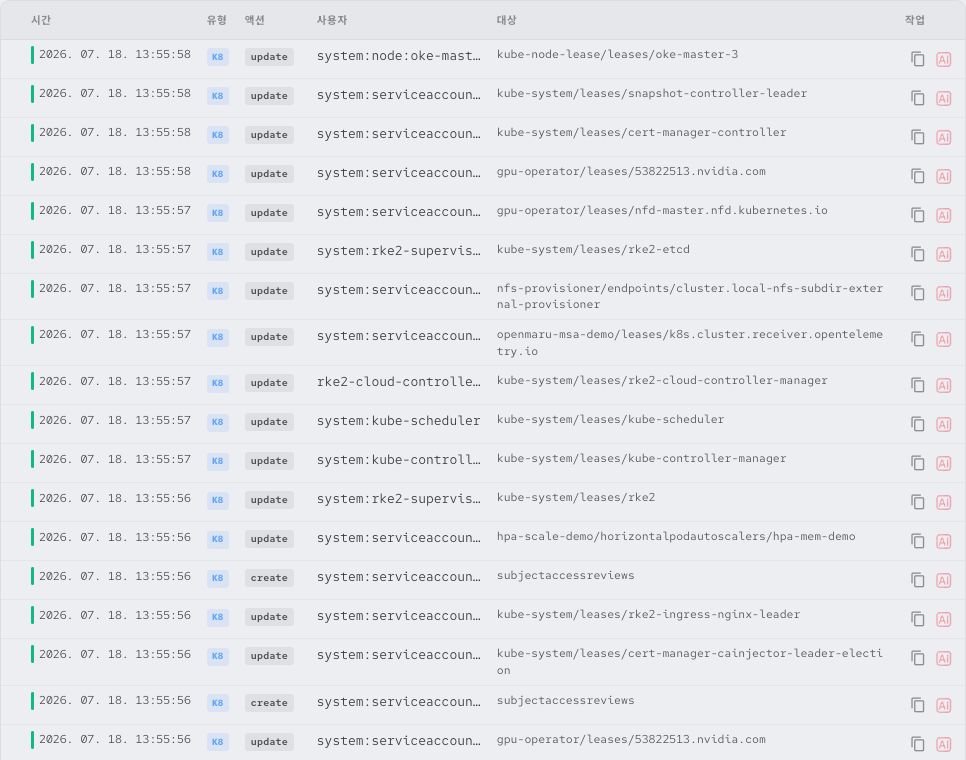
- Type your search term into the Message filter field at the top of the screen.
- Click Query, or press Enter, to run the search.
Filtering by type and result
Combine the following conditions in the query bar to narrow which events are shown.
- Type: all, k8s or OS. Choosing k8s or OS expands only that section's detailed filters in the left panel.
- Result: the Success, Failure, Info and Unknown checkboxes choose which results to show. Several can be selected at once.
- Main events only: when ticked, OS audit events are shown without their related records, leaving only the main events. This is on by default.
Tip: to look for permission denials, set the type to k8s and the RBAC decision to deny. This gets you to unauthorised access attempts quickly.
Sorting and how many to show

- Sort: newest first or oldest first.
- Limit: the maximum number of events to show at once — 50, 100, 200, 500 or 1000.
Switching view mode

- Table: shows the events as a table with time, type, action, user and target columns. A colour marker at the left of each row follows the result (success: green, failure: red, info: blue).
- Raw: shows the events' original data as text.
The audit event trend chart
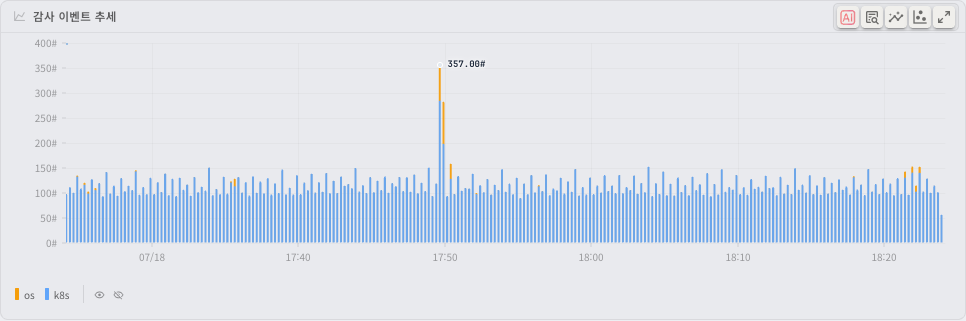
A chart above the event list shows how audit events trended over the selected time range. k8s and OS events are distinguished by colour (k8s: blue, OS: orange), so you can see at a glance where events concentrate.
Drag on the chart to zoom into a particular period.
The event list header gives the total number of events found, along with the k8s/OS split and the success/failure counts.
Looking at an event in detail
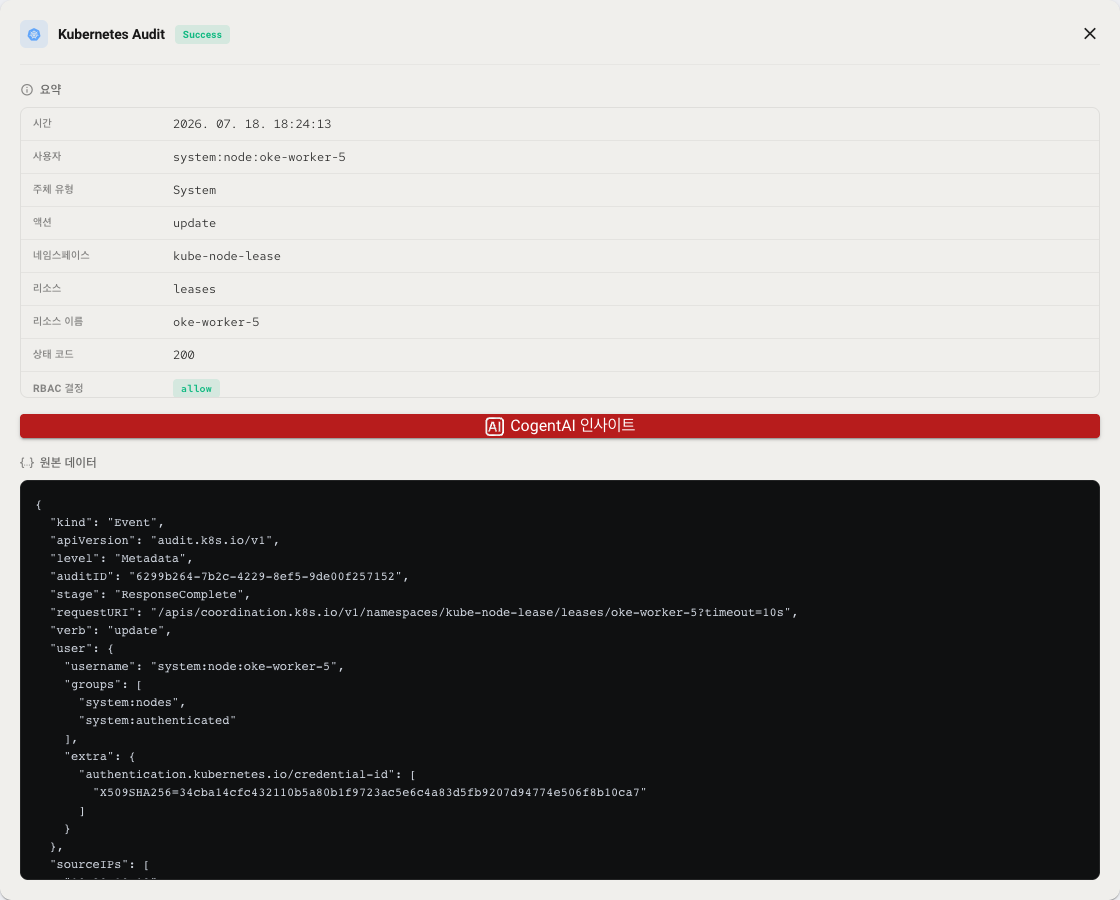
Click a row in the event list to open its detail dialog.
k8s event details:
| Item | Description |
|---|---|
| Timestamp | When the event occurred |
| User | The user or service account that performed the operation |
| Subject type | User, service account or system |
| Action | The operation performed (get, create, delete and so on) |
| Namespace | The target resource's namespace |
| Resource | The kind of resource affected |
| Resource name | The name of the resource affected |
| Status code | The HTTP response code |
| RBAC decision | Allow or deny |
| Source IP | The IP address the request came from |
OS event details:
| Item | Description |
|---|---|
| Timestamp | When the event occurred |
| Host | The server the event occurred on |
| User | The OS user that raised the event |
| UID / AUID | The user ID and the audit user ID |
| Action | The kind of event (SYSCALL, USER_AUTH and so on) |
| Executable | The path of the executable involved |
| Command | The command involved |
| PID / PPID | The process ID and the parent process ID |
The bottom of the detail dialog shows the raw data as JSON, so you can see the event in full.
Related records on OS events
An OS event row may carry an expand button. Click it and the related records belonging to that event unfold as a tree, letting you see the several system call records that make up one OS audit event together.
Note: clear the Main events only option to see the full OS event list with the related records included.
CogentAI analysis

Where CogentAI is enabled, you can analyse audit events with AI for security insight.
Requesting analysis from the event list:
- Click the CogentAI icon in the Actions column of the event row you want analysed.
- The CogentAI widget opens and that audit event's structured information and raw data are passed to the AI.
- Read the AI's analysis of the audit event from a security point of view.
Requesting analysis from the detail dialog:
- Click an event row to open the detail dialog.
- Click the CogentAI Insight button below the summary.
- Read the AI's analysis.
What each kind of analysis looks at:
- k8s audit logs: identifies RBAC (role-based access control) policy issues, abnormal access patterns and privilege escalation attempts, and recommends how to tighten security.
- OS audit logs: analyses from an OS security point of view, detecting suspicious system calls, unauthorised process execution and file system access, and advising on how to respond.
Tip: type a follow-up question into the CogentAI widget to ask for deeper analysis of a particular security issue.
Copying an event
Click the copy button on an event row to copy that event's content to the clipboard, ready to paste into another tool for further analysis.
Showing and hiding the filter panel
- Click Hide filters at the top of the filter panel to collapse it.
- Click the filter icon at the left edge of the screen to expand it again.
- Where filters are active, the collapsed filter bar carries a visual marker.
Note: whether the filter panel is shown is saved in the browser and persists into your next visit.
Adjusting the time range
Change the range in the time range picker at the top of the screen and the audit events from that period are shown. This is useful for narrowing your analysis to the events either side of an incident.
Related documents
- Risks - detecting and managing Kubernetes security risks
- Log viewer - searching and analysing application logs together
- Nodes - node state and resource monitoring
- Settings - managing user permissions and system settings