3.4. Nodes (Node Management)
Overview
The Nodes page manages the nodes of every member cluster registered with the MCM control plane in one place. You can take in and monitor node status, resource usage, and role information per cluster at a glance.
What it is for:
- Monitoring multi-cluster nodes together
- Filtering and searching nodes per cluster
- Checking node status and resource usage
- Identifying and managing GPU nodes
- Diagnosing and analysing node problems
How the Screen Is Laid Out
The node management page comes in two forms, a table view and a grid view.
1. Table View
The default form, showing the node list as a table.
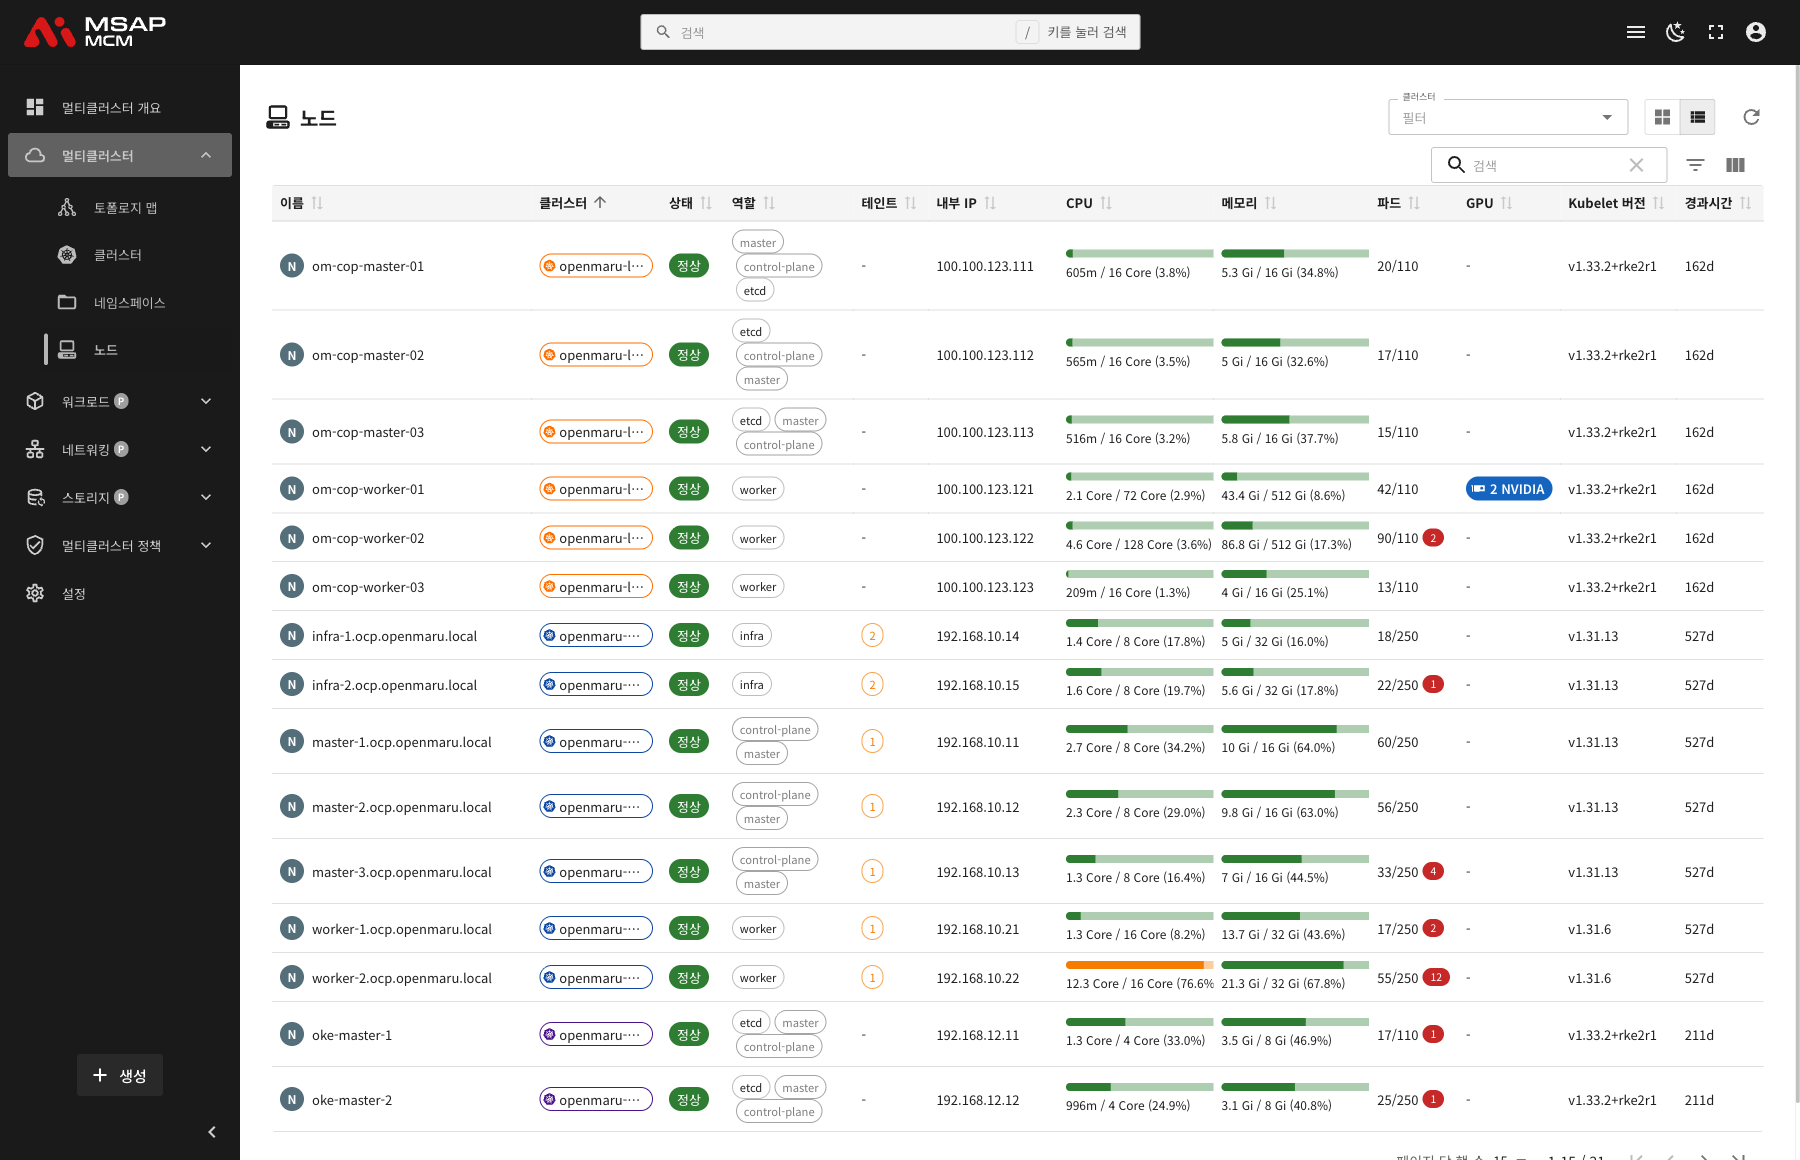
The Elements at the Top of the Page
| Element | Description |
|---|---|
| Cluster filter | Shows only the nodes of a particular cluster |
| View switch buttons | Switch between grid view and table view |
| Refresh button | Refreshes the node list |
| Search box | Searches by node name |
Table Columns
| Column | Description | Sortable |
|---|---|---|
| Name | The node hostname | ✅ |
| Cluster | The cluster the node belongs to | ✅ |
| Status | Ready / Not Ready | ✅ |
| Role | master, worker, control-plane, etcd, infra and so on | ✅ |
| Taints | The number of taints set on the node | ✅ |
| Internal IP | The node's internal IP address | ✅ |
| CPU | CPU usage and utilisation (with a progress bar) | ✅ |
| Memory | Memory usage and utilisation (with a progress bar) | ✅ |
| Pods | Current pods / maximum pods | ✅ |
| GPU | GPU information (shown as NVIDIA where present) | ✅ |
| Kubelet Version | The Kubelet version | ✅ |
| Age | The time since the node was created | ✅ |
The Format Resource Usage Is Shown In
usage / allocatable (utilisation%)
For example 2.1 Core / 72 Core (2.9%)
- Actually used: 2.1 cores
- Allocatable: 72 cores
- Utilisation: 2.9%
2. Grid View (Cards)
Shows the nodes as cards so they can be taken in visually.
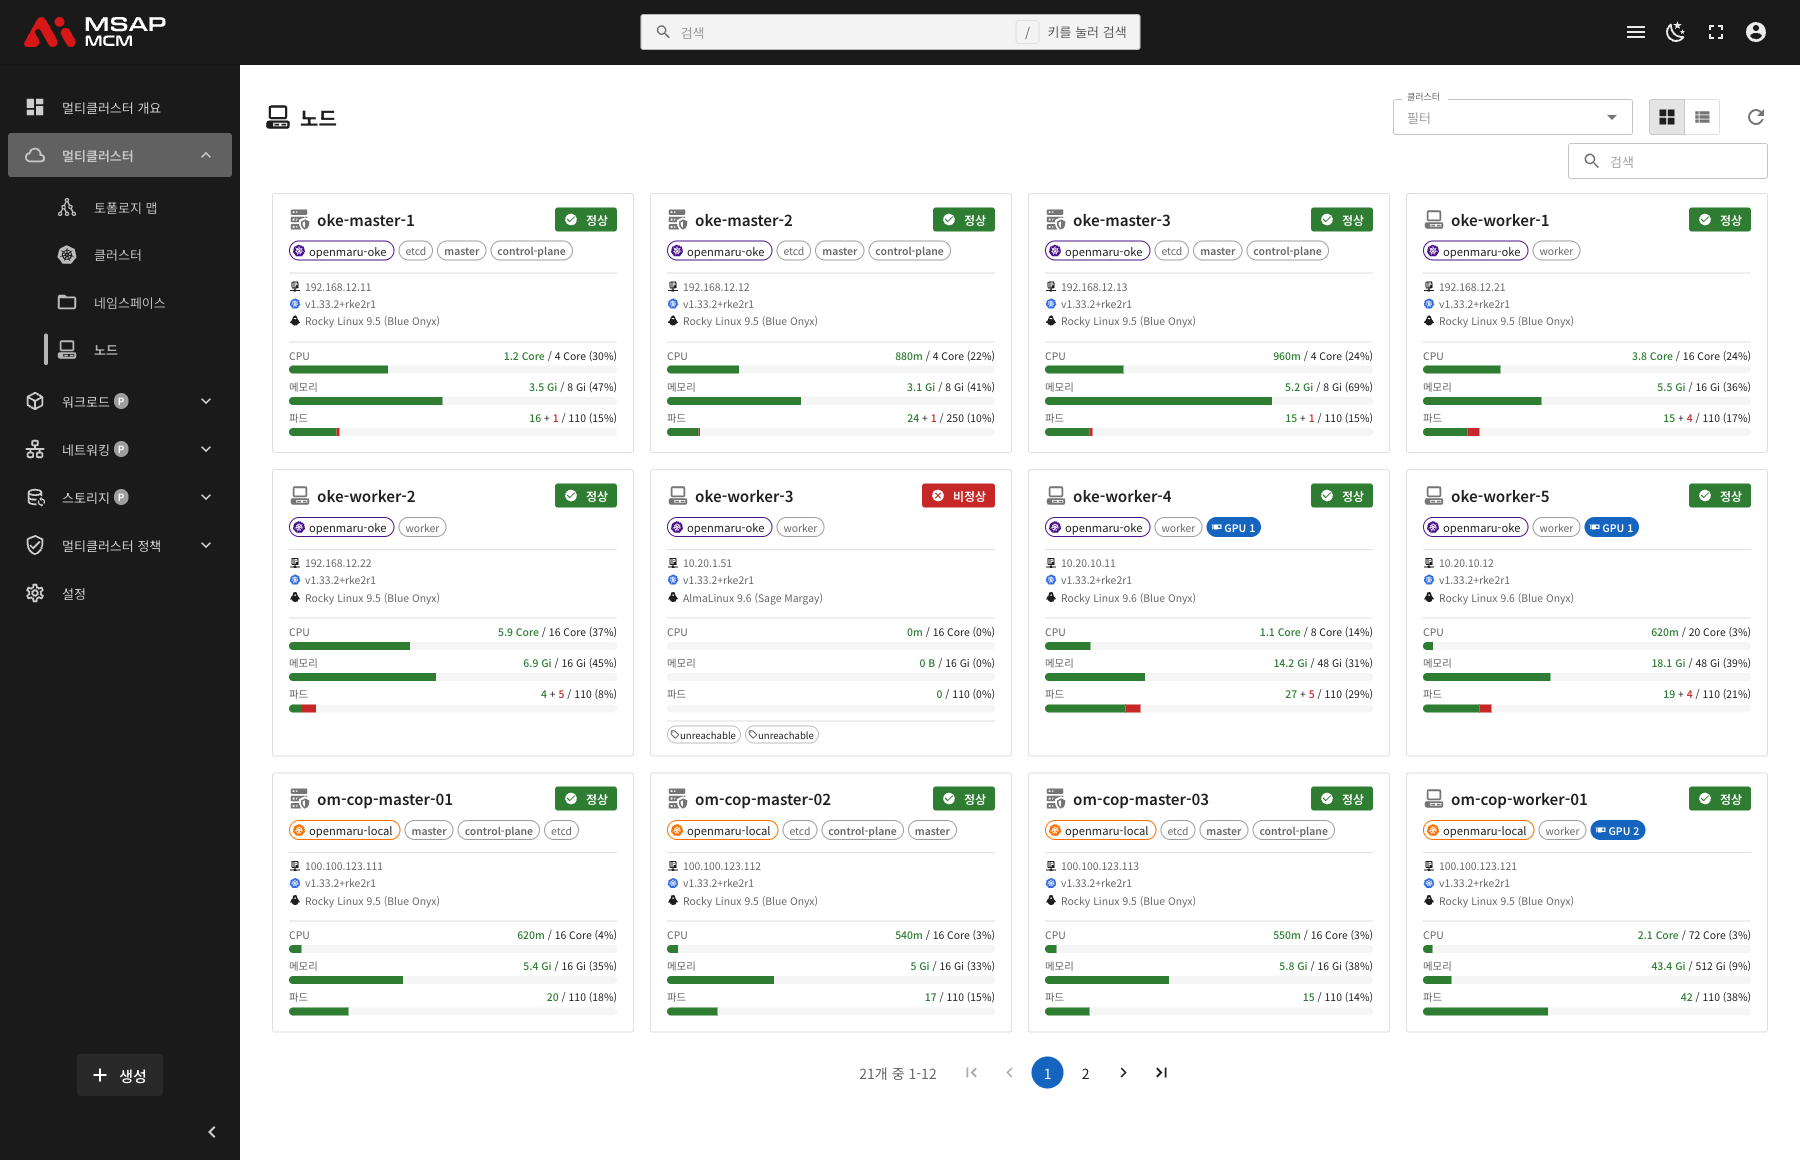
How a Node Card Is Laid Out
Each node card shows:
| Element | Description |
|---|---|
| Node name | The node hostname |
| Status badge | Ready (green) / Not Ready (red) |
| Cluster | The name of the cluster the node belongs to |
| Role badges | master, worker, control-plane, etcd and so on |
| GPU badge | For a GPU node, shows NVIDIA and the GPU count |
| Internal IP | The node's internal IP address |
| Kubelet Version | The Kubelet version |
| OS Image | The operating system (Rocky Linux 9.5, for example) |
| CPU | Usage / allocatable (utilisation%) |
| Memory | Usage / allocatable (utilisation%) |
| Pods | Current + Karmada pods / maximum (utilisation%) |
| Taints | The taints (shown for a not-ready node) |
3. The Cluster Filter
Lets you filter the view to the nodes of particular clusters.
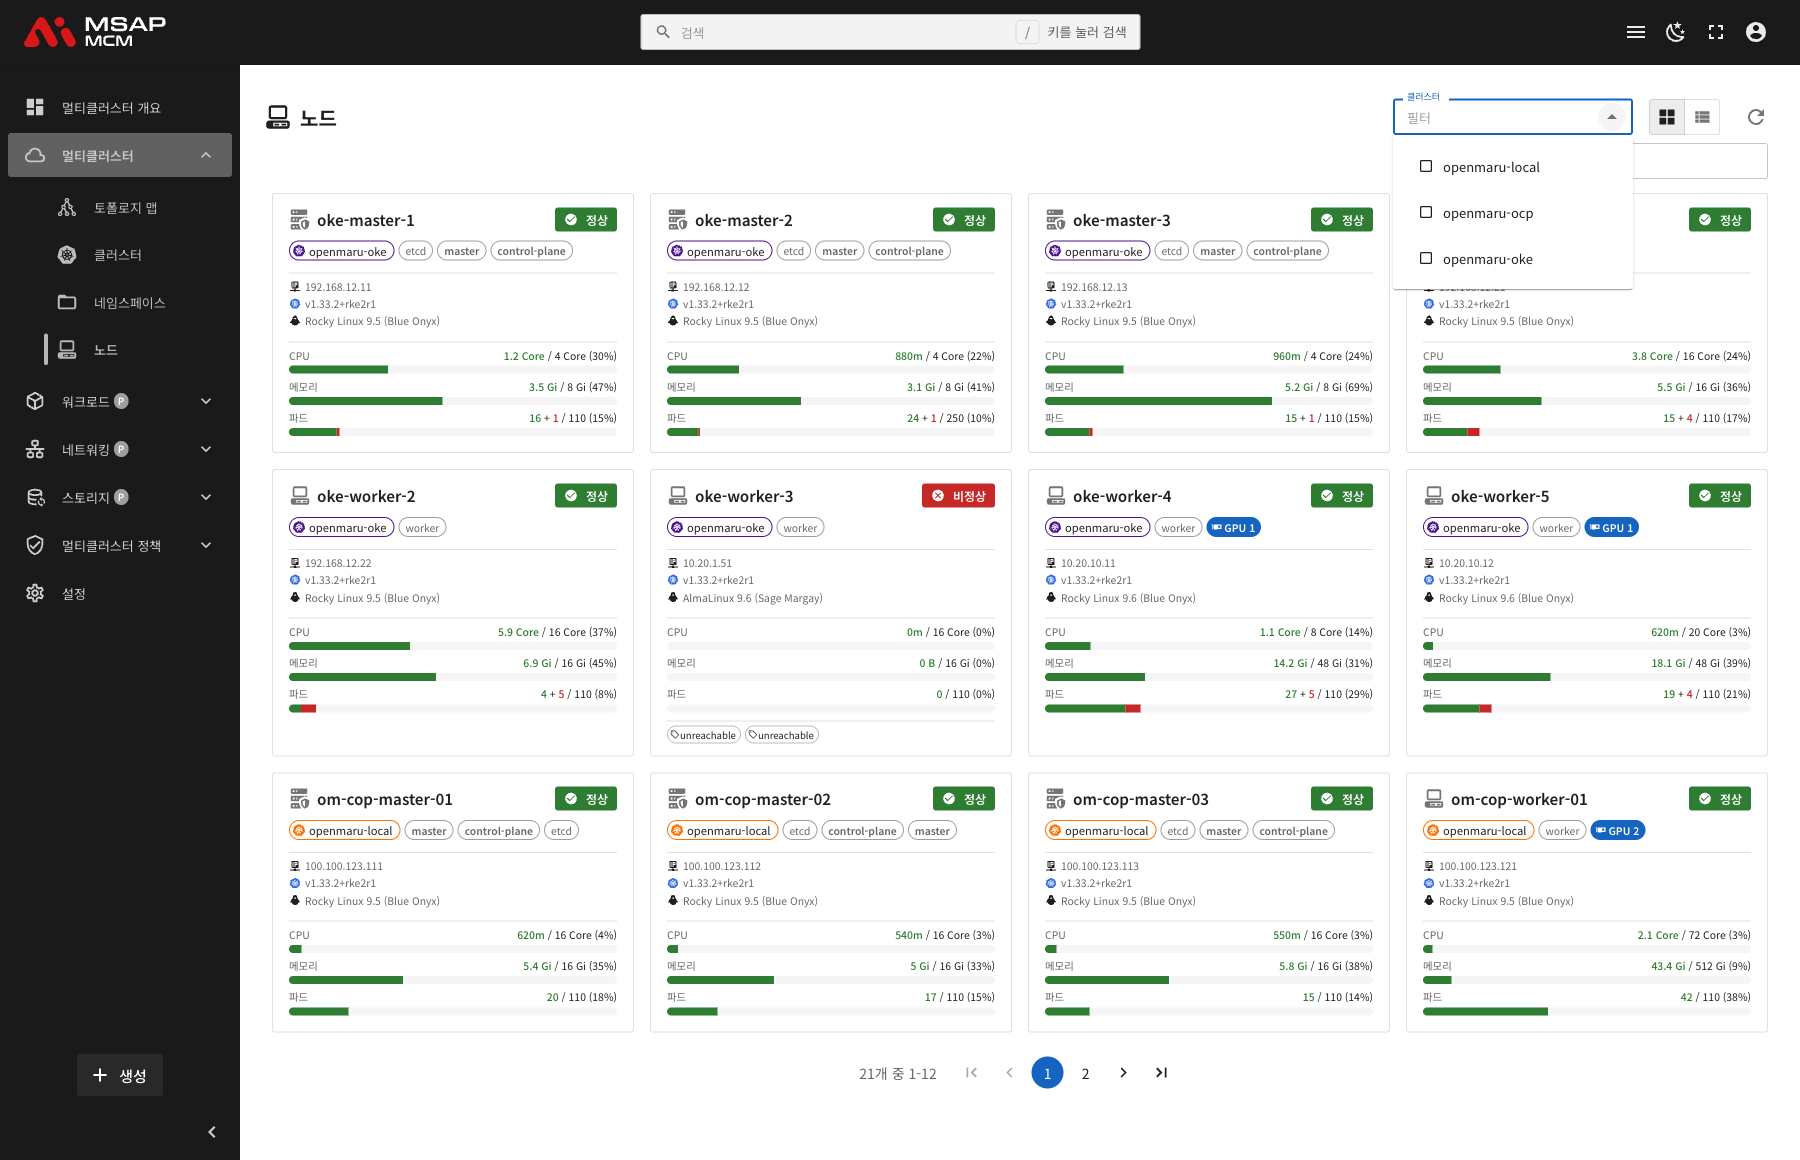
- One or more clusters can be chosen from the dropdown
- Several clusters can be chosen at once with the checkboxes
- Clearing the filter shows the nodes of every cluster
Node Detail
Clicking a node card or a table row opens the detail panel.
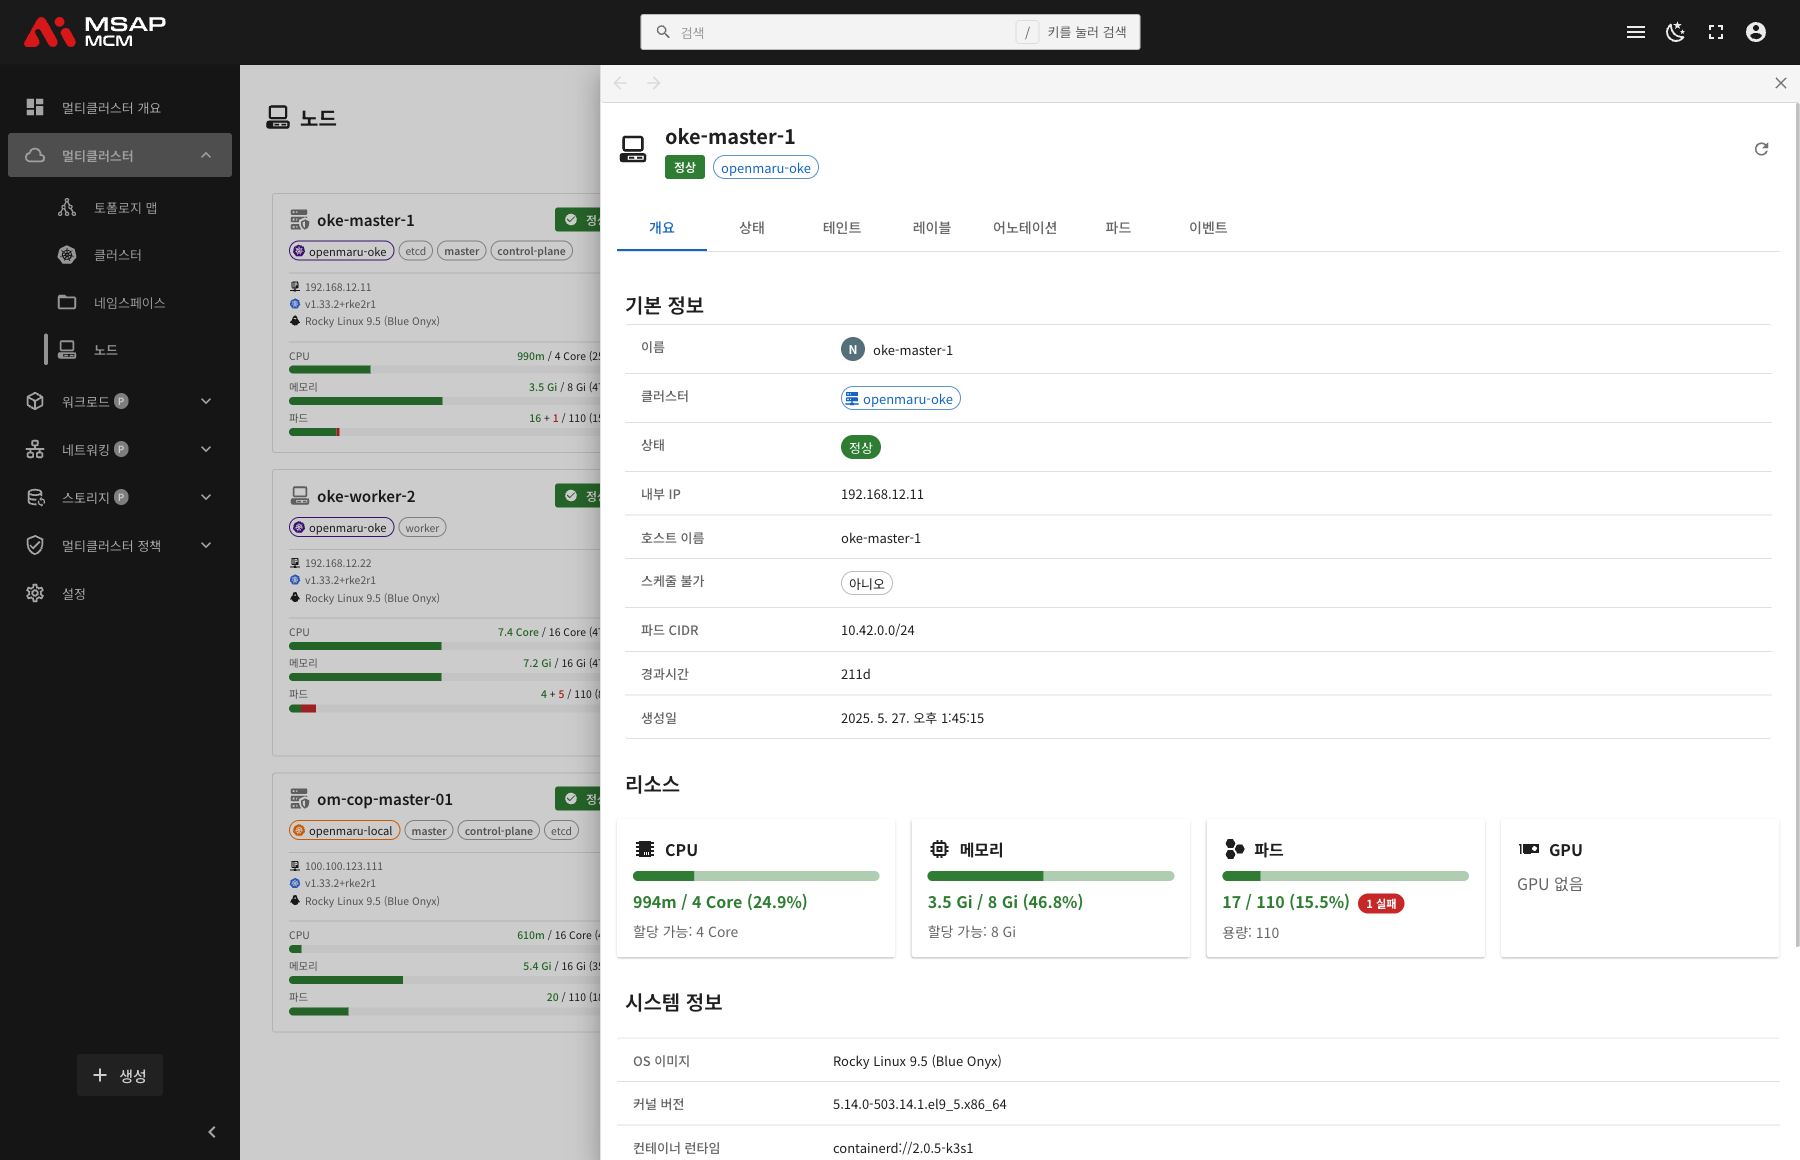
The Detail Panel Header
| Element | Description |
|---|---|
| Node name | The hostname of the chosen node |
| Status badge | Ready / Not Ready |
| Cluster badge | The cluster the node belongs to |
| Refresh button | Refreshes the node information |
The Tabs
The Overview Tab
Shows the node's basic information, resource usage, and system information.
Basic information:
| Item | Description |
|---|---|
| Name | The node hostname |
| Cluster | The cluster the node belongs to |
| Status | Ready / Not Ready |
| Internal IP | The node's internal IP address |
| Hostname | The node hostname |
| Unschedulable | Whether scheduling is possible (Yes/No) |
| Pod CIDR | The pod CIDR assigned to the node |
| Age | The time since the node was created |
| Created | When the node was registered |
Resources:
| Item | What is shown |
|---|---|
| CPU | Usage / allocatable (utilisation%), with a progress bar |
| Memory | Usage / allocatable (utilisation%), with a progress bar |
| Pods | Current / capacity (utilisation%), with the failed pod count |
| GPU | The GPU count, or "No GPU" |
System information:
| Item | Description |
|---|---|
| OS Image | The operating system image (Rocky Linux 9.5, for example) |
| Kernel Version | The Linux kernel version |
| Container Runtime | The containerd or docker version |
| Kubelet Version | The Kubelet version |
| Kube Proxy Version | The Kube Proxy version |
| Operating System | OS/architecture (linux/amd64, for example) |
| Machine ID | The node machine ID |
| System UUID | The node system UUID |
The Conditions Tab
Shows the node's status conditions:
- Ready: whether the node is healthy
- MemoryPressure: whether memory is short
- DiskPressure: whether disk is short
- PIDPressure: whether PIDs are short
- NetworkUnavailable: whether there is a network problem
The Taints Tab
Shows the taints set on the node:
- The taint key
- The taint value
- The taint effect (NoSchedule, NoExecute, PreferNoSchedule)
The Labels Tab
Shows the list of Kubernetes labels applied to the node.
The Annotations Tab
Shows the list of annotations applied to the node.
The Pods Tab
Shows the list of pods running on that node.
The Events Tab
Shows the Kubernetes events related to the node.
Node Status
Status Types
| Status | Description | How it is shown |
|---|---|---|
| Ready | The node is working normally | A green badge |
| Not Ready | The node has a problem | A red badge |
What a Not-Ready Node Looks Like
A not-ready node shows these traits:
- The status badge is red
- Resource usage may show as 0
- The
node.kubernetes.io/unreachabletaint is applied automatically - NoSchedule and NoExecute effects block new pods being scheduled
Node Roles
| Role | Description |
|---|---|
| master | A Kubernetes master node |
| control-plane | A node running control plane components |
| etcd | An etcd cluster member node |
| worker | A node running workloads |
| infra | A node for infrastructure components |
Note: one node can hold several roles (master, control-plane, and etcd, for example).
GPU Nodes
A node with GPUs is shown as follows:
- Table view: shown in the GPU column as "N NVIDIA" (N being the GPU count)
- Grid view: a GPU badge beside the role badges
- Detail panel: the GPU count in the GPU section
Worked Examples
Scenario 1: Checking Nodes per Cluster
- Click the cluster filter dropdown
- Choose the cluster you want to check
- Only that cluster's nodes are listed
- Check the status and resources of each node
Scenario 2: Diagnosing a Not-Ready Node
- Find the nodes with a "Not Ready" status in the list
- Click that node to open the detail panel
- Check which condition is False on the Conditions tab
- Check the automatically applied taint on the Taints tab
- Check the related events on the Events tab
- Resolve the node problem on that cluster
Scenario 3: Monitoring Resource Usage
- Sort by the CPU or Memory column in the table view
- Identify the nodes with high utilisation (visible from the progress bars)
- Click a node for its detail if needed
- Check which pods use a lot of resources on the Pods tab
- Consider redistributing workloads or growing the nodes if needed
Scenario 4: Managing GPU Nodes
- Identify the GPU nodes by checking or sorting the GPU column
- Check the resource usage of the GPU nodes
- Check the GPU information on the node detail page if needed
- Use it when placing GPU workloads
Scenario 5: Searching for a Node
- Type the node name in the search box
- The matching nodes are filtered
- Click the node you want for its detail
Related Concepts
Node Taints
A taint is the mechanism that stops particular pods being scheduled on a node:
- NoSchedule: stops new pods being scheduled
- NoExecute: evicts existing pods as well
- PreferNoSchedule: avoids scheduling where possible (not enforced)
A not-ready node automatically receives the node.kubernetes.io/unreachable taint.
Node Resources
- Allocatable: the resources actually available to pods
- Capacity: the node's total resource capacity
- Usage: the resources currently in use
Karmada Pods
In the pod figure, the number after the "+" is the number of pods Karmada manages:
15 + 4 / 110 (17%)
- 15: ordinary pods
- 4: Karmada-related pods
- 110: the maximum pod count
- 17%: overall utilisation
Next Steps
- Deployments -- managing multi-cluster Deployments
- DaemonSets -- managing multi-cluster DaemonSets