3.2. Clusters (Cluster Management)
Overview
The Clusters page manages every member cluster registered with the MCM control plane. You can check a cluster's status, resource usage, and node information, and add a new cluster or edit or delete an existing one.
What it is for:
- Registering and managing member clusters
- Monitoring the status and resource usage of each cluster
- Checking cluster node information
- Jumping quickly to a cluster console
How the Screen Is Laid Out
The cluster management page comes in two forms, a grid view and a table view.
1. Grid View (Cards)
The default form, showing each cluster as a card.
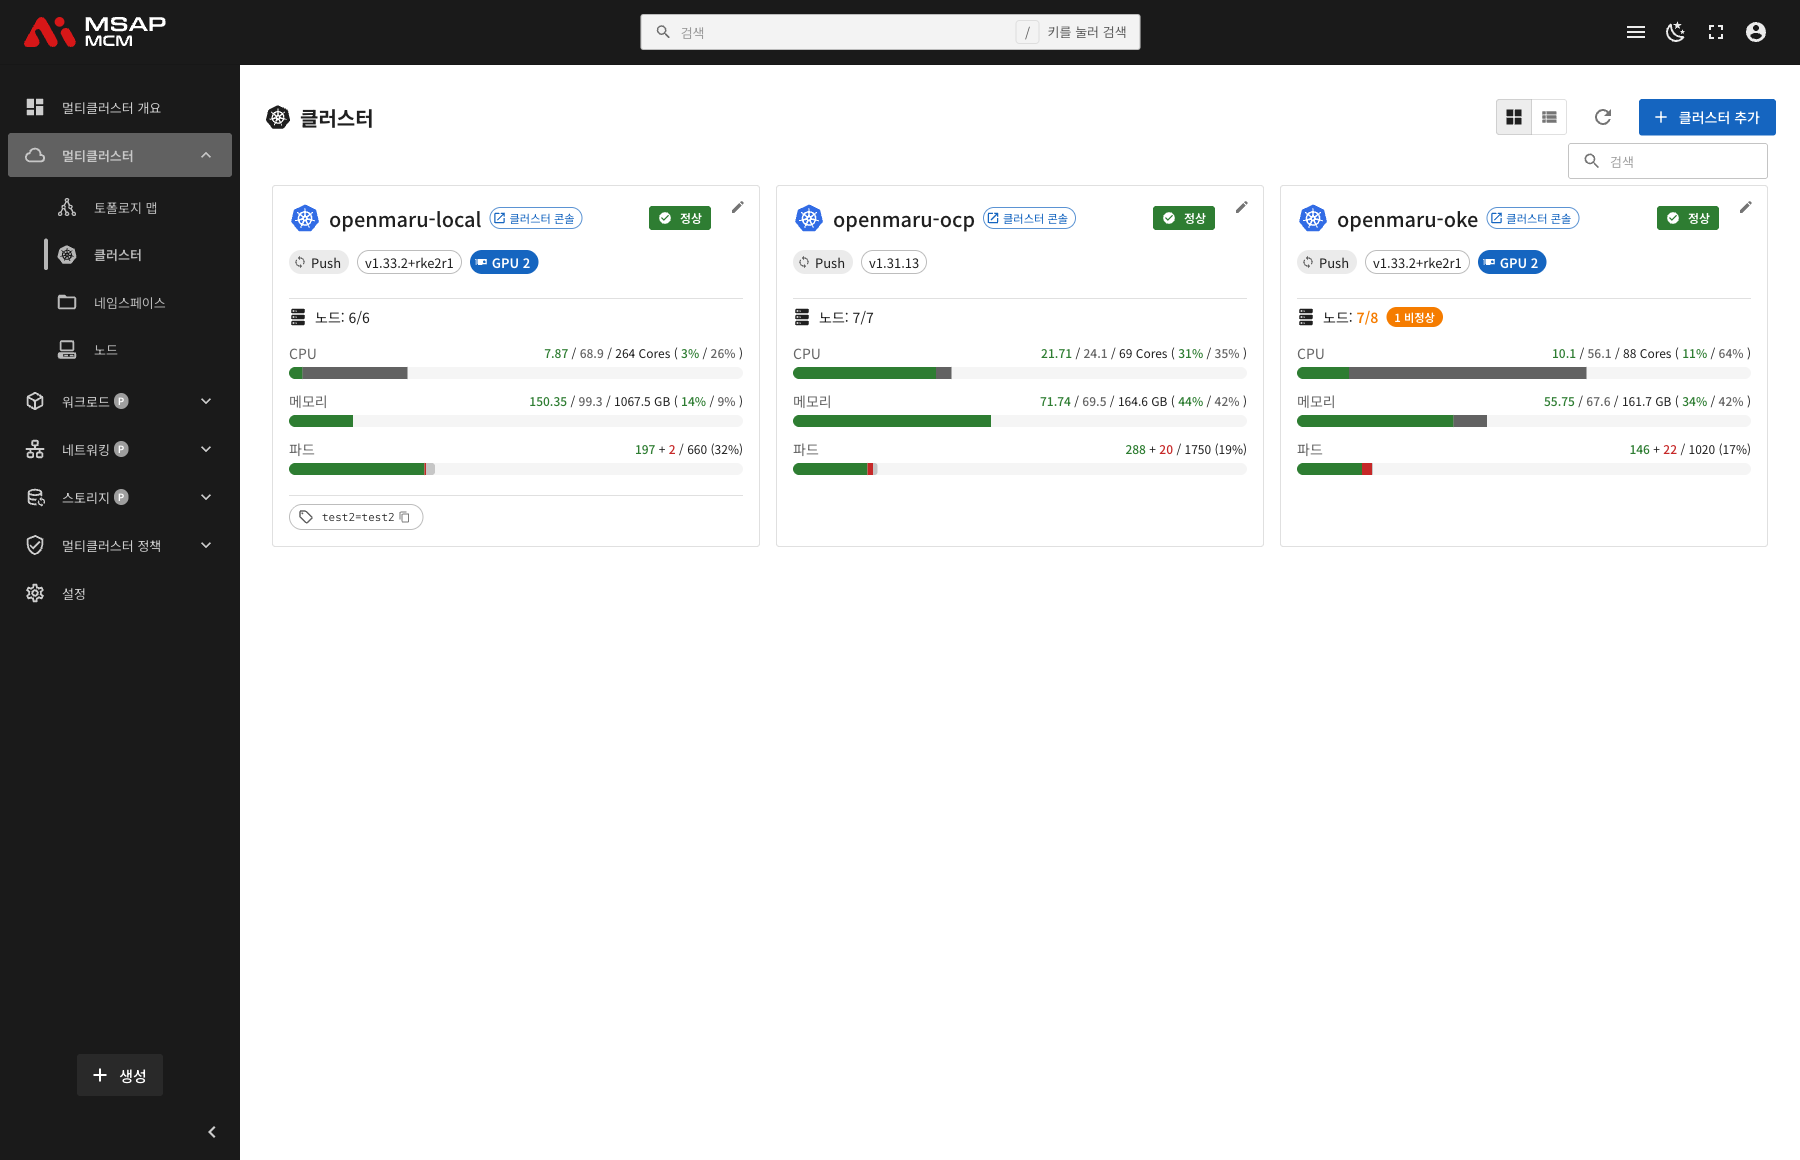
The Elements at the Top of the Page
| Element | Description |
|---|---|
| View switch buttons | Switch between grid view and table view |
| Refresh button | Refreshes the cluster list |
| Add Cluster button | Opens the dialog for registering a new cluster |
| Search box | Searches by cluster name |
How a Cluster Card Is Laid Out
Each cluster card shows:
| Element | Description |
|---|---|
| Cluster Name | The name that identifies the registered cluster |
| Status badge | Ready (green) / Not Ready (red) |
| Cluster Console button | Goes to that cluster's management console |
| Sync Mode | Shows Push or Pull mode |
| Kubernetes Version | The cluster's Kubernetes version |
| GPU badge | Shows the GPU count when the cluster has GPU nodes |
| Node status | Ready / total nodes |
| CPU Usage | Used / requested / allocatable cores (usage% / request%) |
| Memory Usage | Used / requested / allocatable GB (usage% / request%) |
| Pods | Current pods + multi-cluster pods / maximum pods (usage%) |
| Labels | The labels applied to the cluster (can be copied) |
| Edit button | Edits the cluster settings |
2. Table View
Shows the cluster list as a table so they can be compared at a glance.
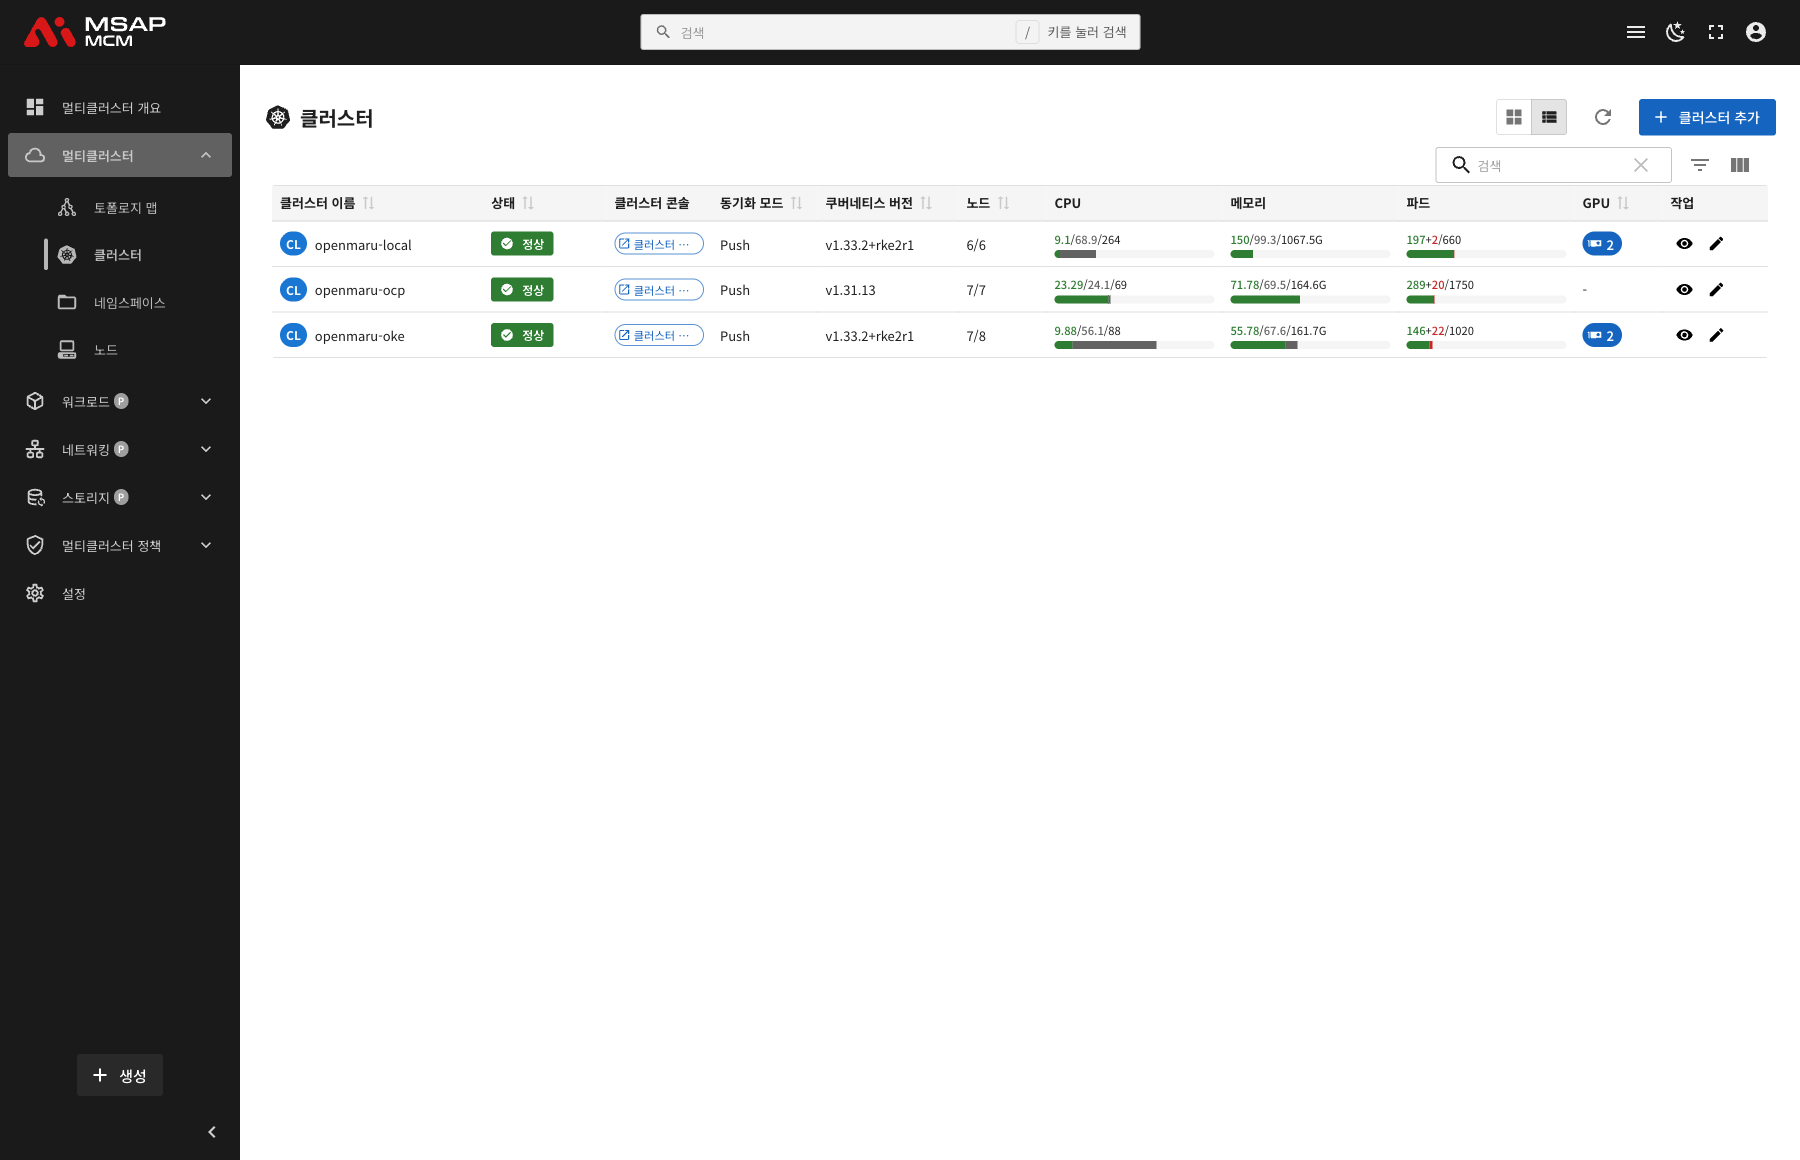
Table Columns
| Column | Description | Sortable |
|---|---|---|
| Cluster Name | The name that identifies the cluster | ✅ |
| Status | Ready / Not Ready | ✅ |
| Cluster Console | The console shortcut button | - |
| Sync Mode | Push / Pull mode | ✅ |
| Kubernetes Version | The Kubernetes version | ✅ |
| Nodes | Ready / total nodes | ✅ |
| CPU | Used / requested / allocatable | - |
| Memory | Used / requested / allocatable | - |
| Pods | Current + Karmada / maximum | - |
| GPU | The GPU count | ✅ |
| Actions | The view and edit buttons | - |
Table Features
- Sorting: click a column header to sort ascending or descending
- Filter: filter by condition with the filter button
- Hide columns: choose which columns to show
Cluster Detail
Clicking a cluster card or a table row opens the detail panel.
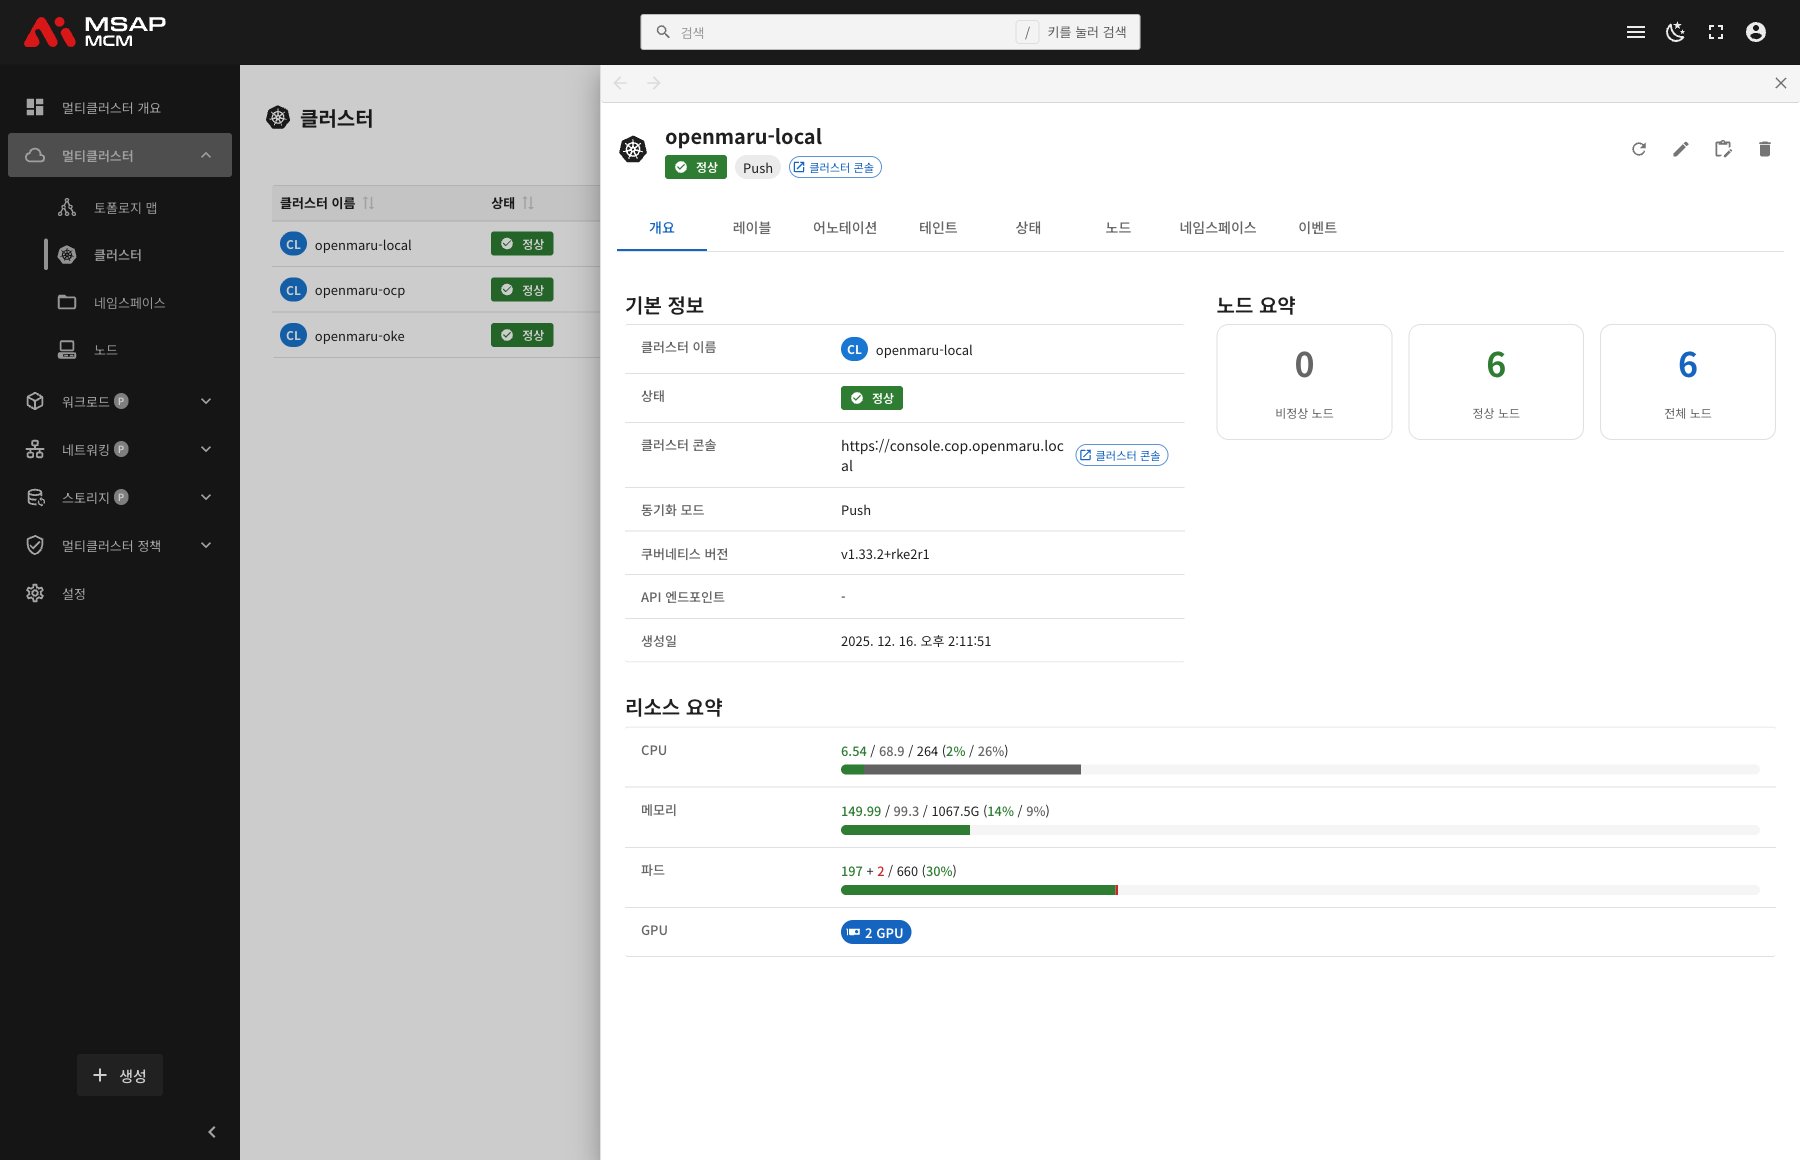
The Detail Panel Header
| Element | Description |
|---|---|
| Cluster Name | The name of the chosen cluster |
| Status badge | Ready / Not Ready |
| Sync Mode | Shows Push or Pull |
| Cluster Console button | Goes to that cluster's console |
The Action Buttons
| Button | What it does |
|---|---|
| Refresh | Refreshes the cluster information |
| Edit | Opens the YAML edit mode |
| Edit cluster | Opens the cluster settings dialog |
| Delete | Unregisters the cluster |
The Tabs
The Overview Tab
Shows the cluster's basic information and a resource summary.
Basic information:
| Item | Description |
|---|---|
| Cluster Name | The name of the registered cluster |
| Status | The cluster's current status |
| Cluster Console | The console URL and shortcut |
| Sync Mode | Push or Pull |
| Kubernetes Version | The cluster's Kubernetes version |
| API Endpoint | The cluster API server address |
| Created | When the cluster was registered |
Node summary:
- The not-ready node count
- The ready node count
- The total node count
Resource summary:
- CPU: used / requested / allocatable (usage% / request%)
- Memory: used / requested / allocatable (usage% / request%)
- Pods: current + Karmada pods / maximum (usage%)
- GPU: the GPU count
The Labels Tab
Shows the list of Kubernetes labels applied to the cluster.
The Annotations Tab
Shows the list of annotations applied to the cluster.
The Taints Tab
Shows the taints configured on the cluster.
The Conditions Tab
Shows the cluster's status conditions.
The Nodes Tab
Shows the detail of every node in the cluster as a table.
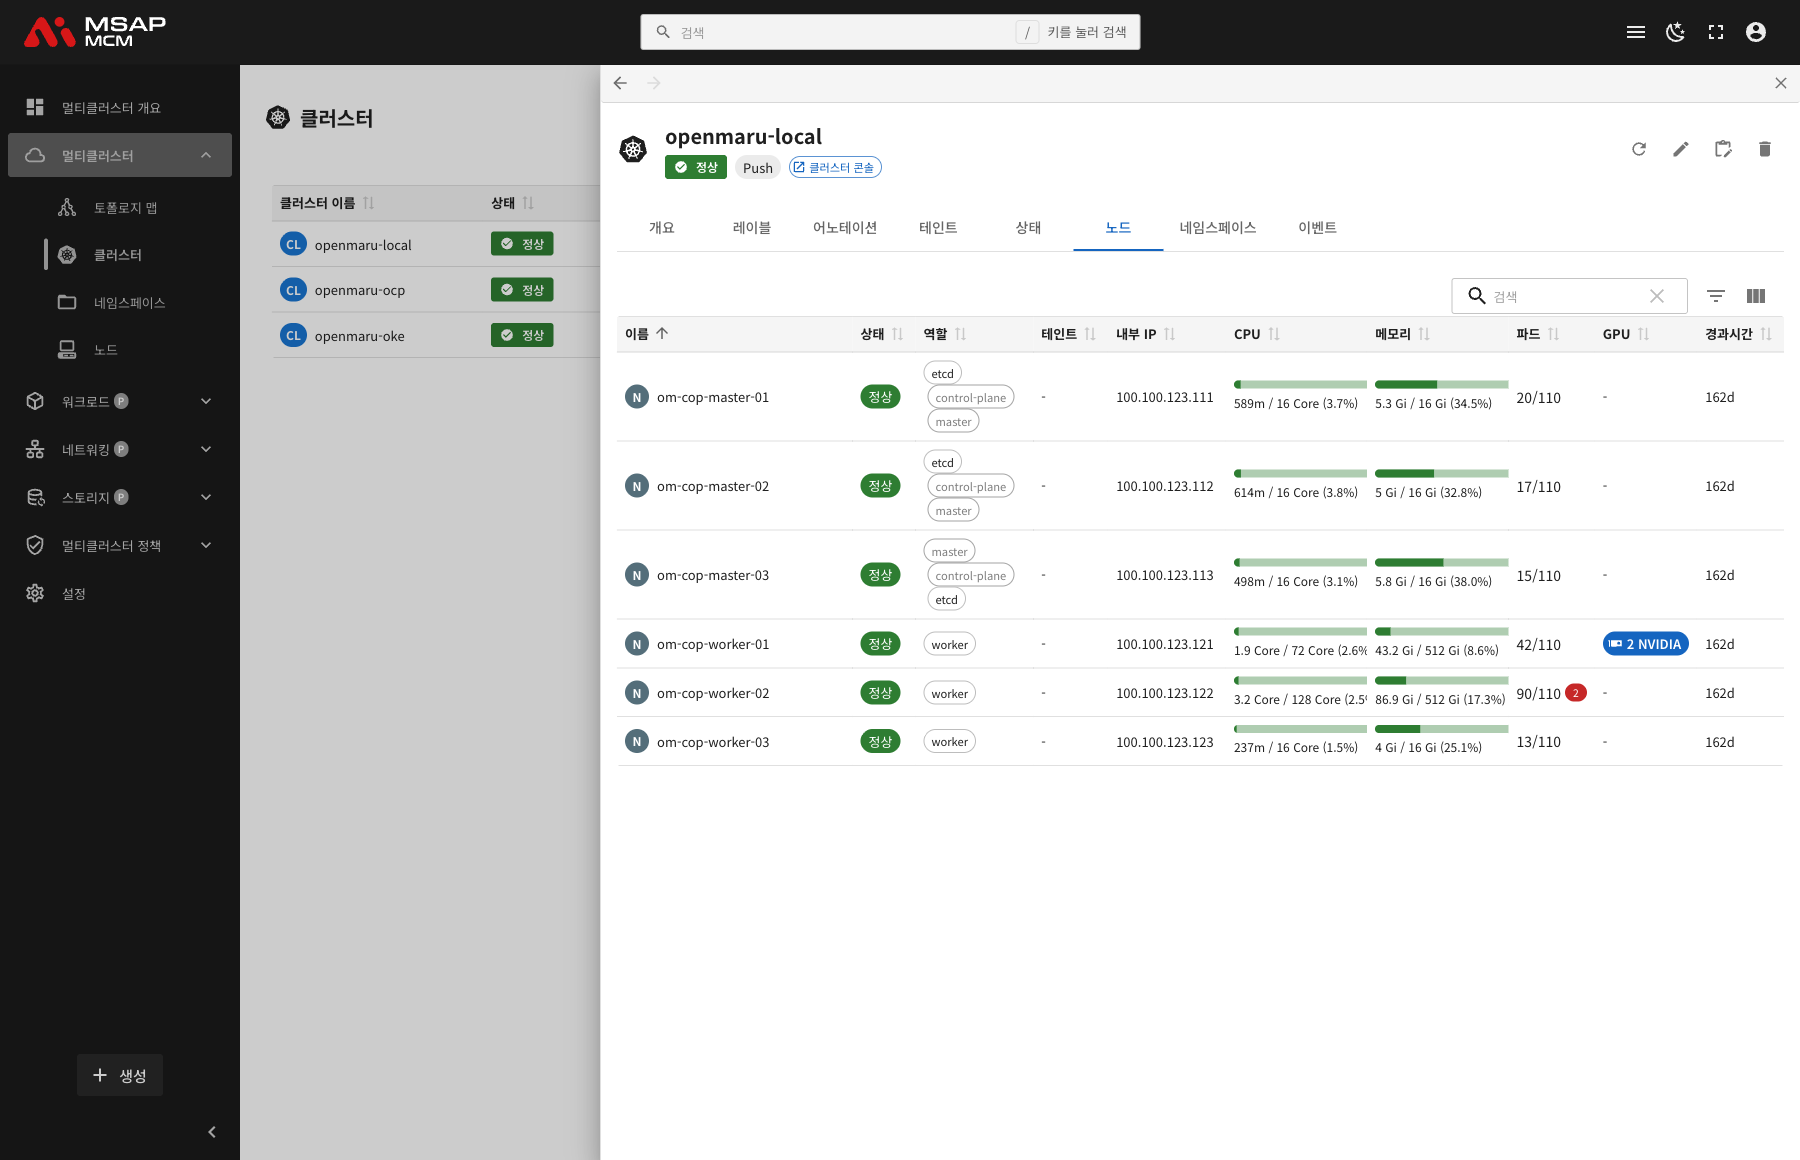
| Column | Description |
|---|---|
| Name | The node name |
| Status | Ready / Not Ready |
| Roles | master, worker, etcd, control-plane and so on |
| Taints | The number of taints set on the node |
| Internal IP | The node's internal IP address |
| CPU | CPU usage (with a progress bar) |
| Memory | Memory usage (with a progress bar) |
| Pods | Current / maximum pods |
| GPU | GPU information (where present) |
| Age | The time since the node was created |
The Namespaces Tab
Shows the list of namespaces in the cluster.
The Events Tab
Shows the Kubernetes events related to the cluster.
Adding a Cluster
Registers a new member cluster with the MCM control plane.
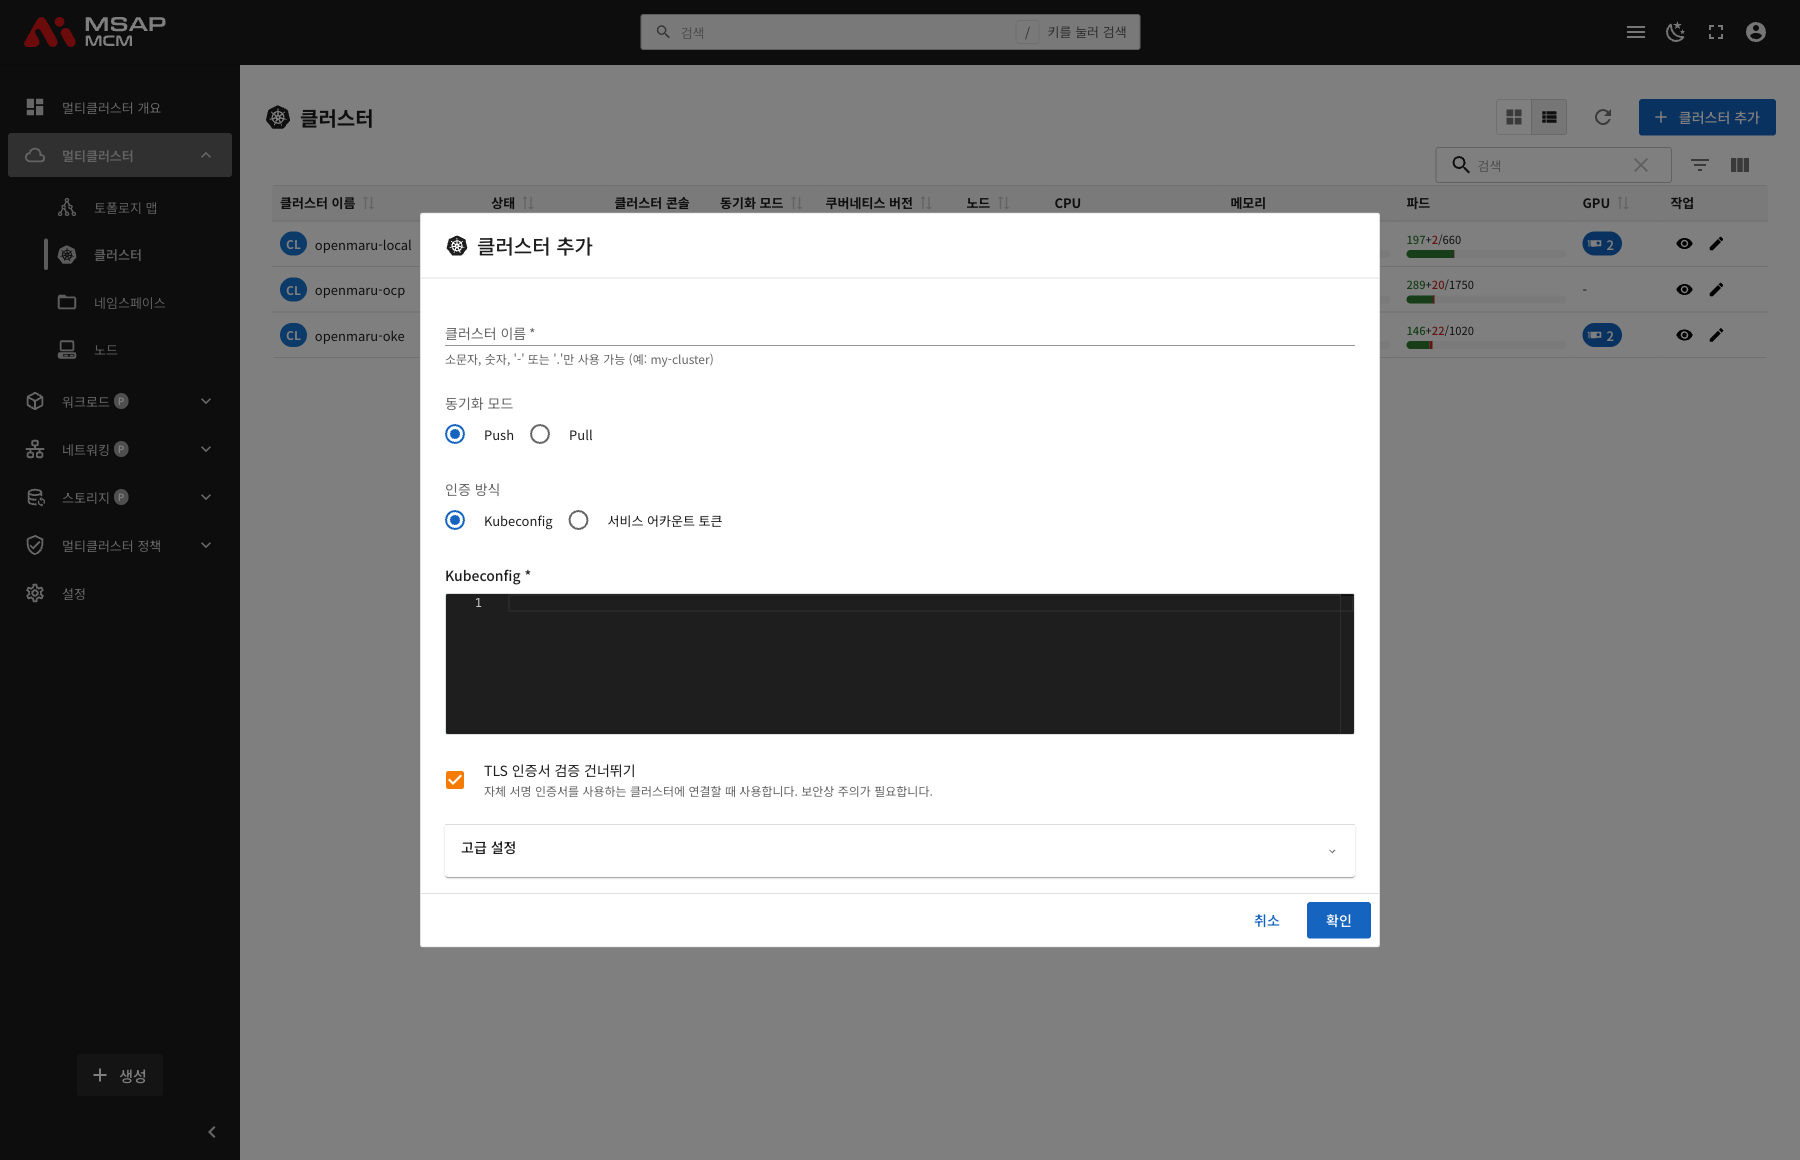
Required Fields
| Field | Description |
|---|---|
| Cluster Name | A unique name identifying the cluster (lowercase letters, numbers, '-' or '.') |
| Sync Mode | Choose Push or Pull |
| Authentication Method | Kubeconfig or a ServiceAccount token |
| Kubeconfig | The kubeconfig contents used to reach the cluster |
Sync Modes
| Mode | Description |
|---|---|
| Push | MCM pushes resources to the member cluster directly (recommended) |
| Pull | The member cluster's agent pulls resources from MCM |
Authentication Methods
| Method | Description |
|---|---|
| Kubeconfig | Uses the contents of the cluster's kubeconfig file |
| ServiceAccount Token | Authenticates with a ServiceAccount token |
Extra Options
| Option | Description |
|---|---|
| Skip TLS certificate verification | Tick this when using a self-signed certificate |
| Advanced Configuration | Further cluster settings |
Editing a Cluster
Changes the settings of a registered cluster.
Editing the YAML
Pressing the "Edit" button lets you edit the cluster resource's YAML directly.
The Edit Cluster Dialog
Pressing the "Edit cluster" button opens a dialog for changing the main settings:
- The cluster console URL
- Labels
- Annotations
- Taints
Deleting a Cluster
⚠️ Caution: deleting a cluster unregisters it from the MCM control plane. Workloads deployed on that cluster are handled according to the deletion policy.
- Choose the cluster to delete
- Press the "Delete" button in the detail panel
- Type the cluster name in the confirmation dialog
- Press the "Delete" button
Worked Examples
Scenario 1: Registering a New Cluster
- Press the "Add Cluster" button
- Enter the cluster name (
production-cluster, for example) - Choose the sync mode (Push is generally recommended)
- Paste in the kubeconfig contents
- Tick "Skip TLS certificate verification" if needed
- Press the "Confirm" button
Scenario 2: Checking Cluster Status
- Check the status badges in the cluster list
- Click the card of a not-ready cluster
- Check the detailed conditions on the Conditions tab
- Check the related events on the Events tab
Scenario 3: Diagnosing a Node Problem
- Check the "Not Ready Nodes" count on the cluster card
- Click the cluster to open the detail panel
- Click the Nodes tab
- Find the nodes that are not ready
- Check that node's CPU and memory usage and its taints
Scenario 4: Monitoring Resource Usage
- Check the CPU, memory, and pod usage of each cluster in the grid view
- Identify the clusters with high usage
- Consider growing the cluster or redistributing workloads if needed
Related Concepts
The Sync Modes in Detail
Push mode:
- The MCM control plane connects to the member cluster directly
- Resources synchronise in real time
- Network reachability is required
Pull mode:
- The Karmada agent has to be installed on the member cluster
- The agent checks the control plane for changes periodically
- Suited to clusters behind a firewall
Next Steps
- Namespaces -- namespace management
- Nodes (node management) -- managing all nodes