8.2. Risks
Detecting security risks in Kubernetes workloads and managing them by severity.
Overview
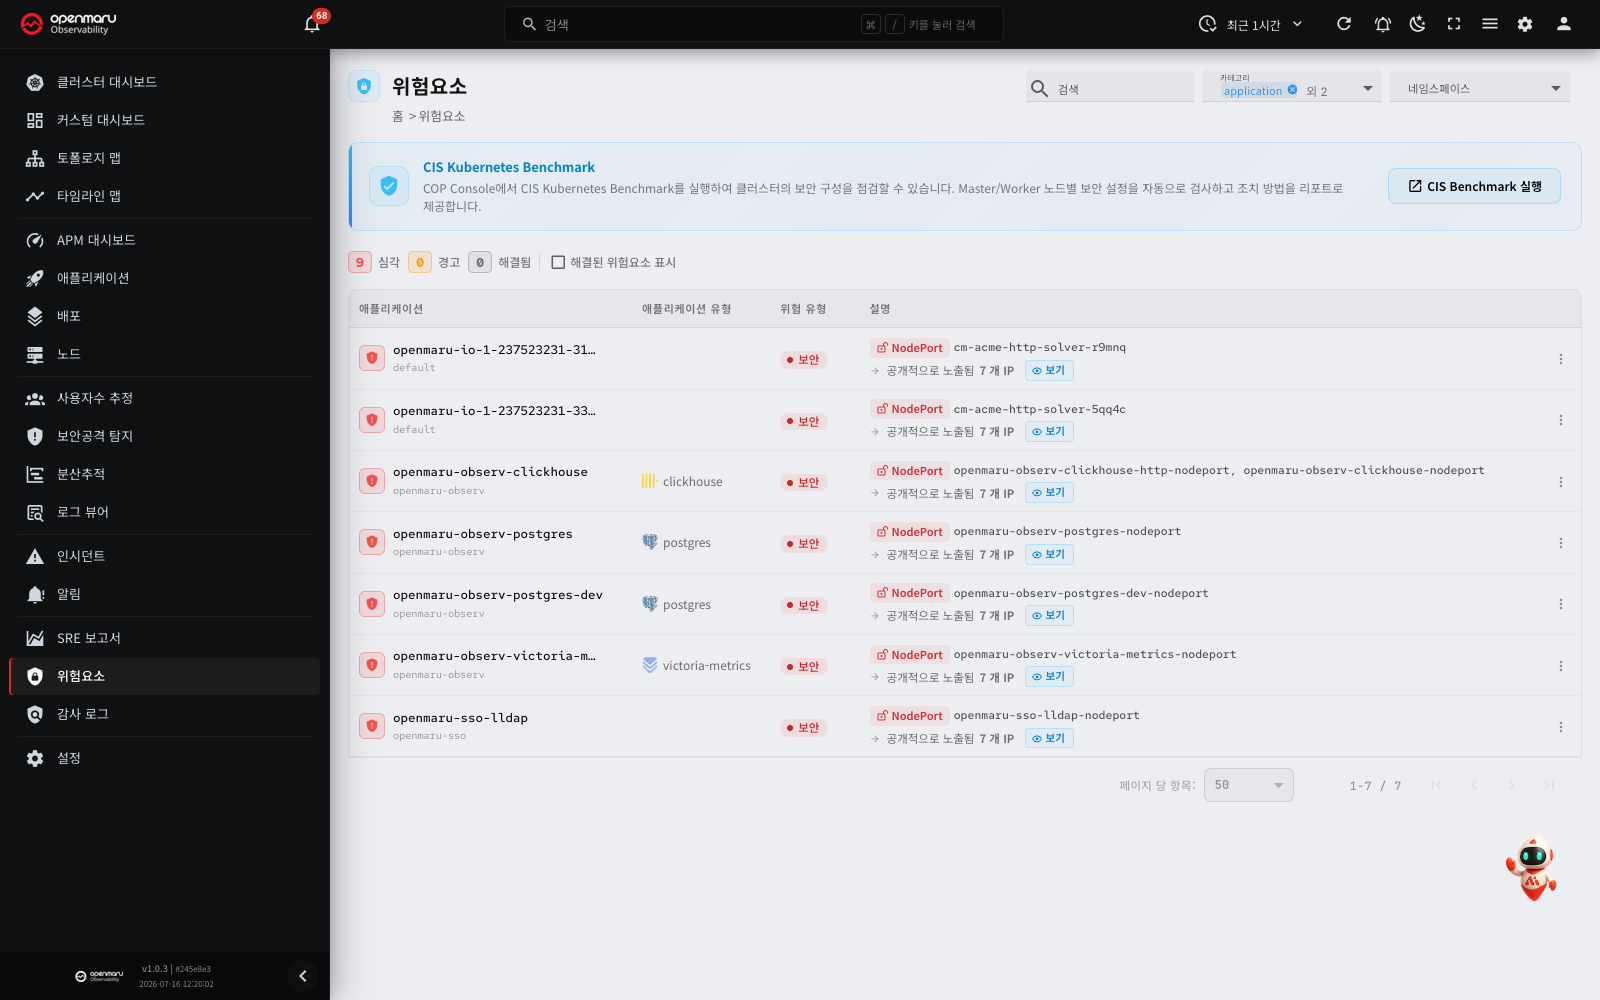
The Risks screen shows the security risks detected on your Kubernetes cluster and lets you manage them. Items that need security attention — a publicly exposed database, an unsafe service exposure — are detected automatically and listed.
Each risk is classified by severity into two levels, critical and warning. Items you have already dealt with, or that are acceptable, can be moved to a dismissed state.
Reach this screen from the Risks menu in the left sidebar.
Screen layout
From top to bottom, the risks screen carries the CIS Kubernetes Benchmark banner, the summary by severity, and the risk table.
The CIS Kubernetes Benchmark banner

A CIS Kubernetes Benchmark banner sits at the top of the screen. The CIS Benchmark is the Kubernetes security configuration standard published by the Center for Internet Security (CIS).
The banner carries the following.
- Title: CIS Kubernetes Benchmark
- Description: you can run the CIS Kubernetes Benchmark from COP Console to check your cluster's security configuration. It inspects the security settings of each master and worker server automatically and reports what to do about them.
- Run CIS Benchmark button: opens COP Console's Kubernetes Benchmark page in a new tab.
Note: the Run CIS Benchmark button appears only where COP Console is connected.
The summary by severity

Below the banner, a summary strip gives the number of risks at each severity. A badge beside each severity carries its count, so you can take in the whole picture at a glance.
| Severity | Description | Colour |
|---|---|---|
| Critical | High-risk items needing immediate action | Red |
| Warning | Medium-risk items needing attention | Orange |
| Dismissed | Items the user reviewed and dismissed | Grey |
Dismissed risks are hidden from the list by default. Tick Show dismissed risks at the right of the summary area to include them.
Tip: where there are no active risks and only dismissed ones, the dismissed items are shown automatically.
The risk table
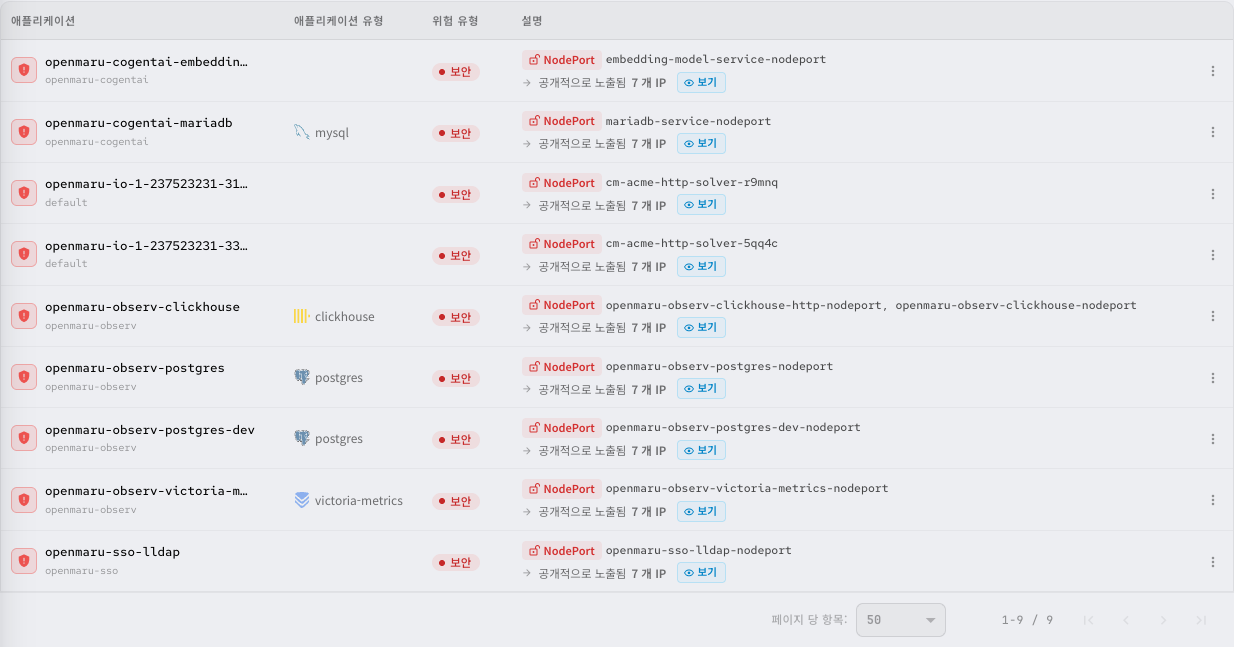
The risks detected are shown as a table.
| Column | Description |
|---|---|
| Application | The name and namespace of the application the risk was found on. The icon colour follows the severity. Click it to open that application's detail page. |
| Application type | The application's technology type, as an icon and a name (PostgreSQL, MySQL and so on) |
| Risk type | The risk's severity classification, as a coloured badge. |
| Description | The risk in detail, including the exposure path, the service name and the IP addresses involved. |
Click a column header to sort by it; sorting by several columns is supported. Below the table you can set the items per page to 10, 20, 50, 100 or all.
Main features
Reading a risk
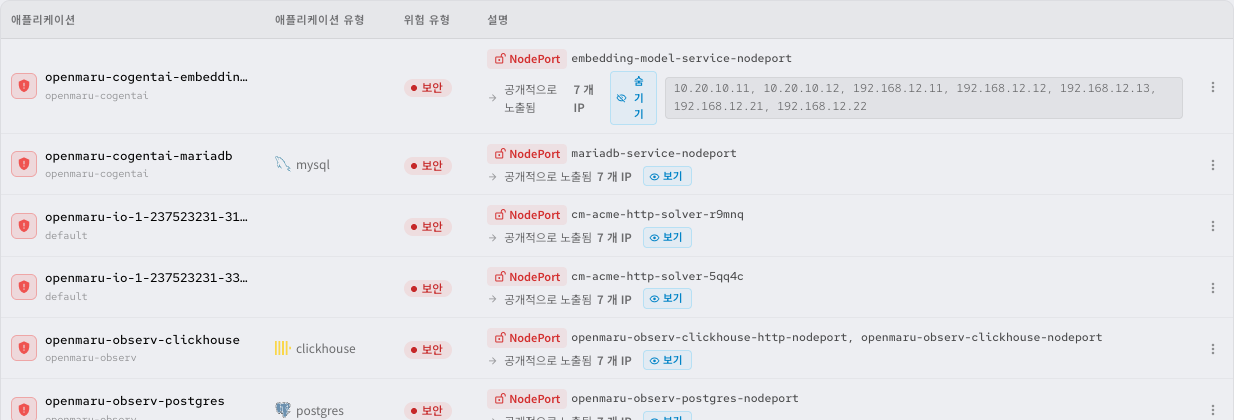
- Click the Risks menu in the sidebar.
- Take in the overall picture from the summary by severity.
- Read each risk in detail in the table.
The Description column carries the following exposure information.
- NodePort: exposed externally through a NodePort service. Shown as a red tag with the service name.
- LoadBalancer: exposed externally through a LoadBalancer service. Shown as a blue tag with the service name.
- Port: a particular port is exposed, with the port number.
Where there are exposed IP addresses, a "publicly exposed" note appears with the number of addresses. Click Show to see the actual list, and Hide to close it again.
Search and filters

Three controls at the top right narrow the list. Where there are many risks, they let you see only the ones you care about.
| Control | What it does |
|---|---|
| Search | Narrows the list by a string in the application name or the description |
| Category | Narrows by application category. You can select several at once |
| Namespace | Shows risks from particular namespaces only. You can select several at once |
The three apply together. Select application under Category and production under Namespace, and only the risks matching both remain.
Dismissing a risk

Where a detected risk is acceptable in your actual environment, you can manage it by dismissing it.
- Click the action menu button (⋮) at the right of the risk's row.
- Choose a reason.
| Reason | Meaning |
|---|---|
| Acceptable for this project | You judge the risk acceptable in this project |
| Controlled by network policy | Access is restricted by network policy, so there is no real risk |
A dismissed item shows who dismissed it, when, and why, and its description area appears translucent.
Note: the Controlled by network policy option appears only on risks that involve network exposure.
Reactivating a risk

A dismissed risk can be returned to the active state.
- Tick Show dismissed risks to display the dismissed items.
- Click the action menu button (⋮) at the right of the item to reactivate.
- Choose Activate and the item becomes an active risk again.
Going to the application details
Click the name in the Application column of the risk table to open that application's detail page, where you can check its metrics, logs and more to understand the risk's blast radius.
The risk management workflow
To manage risks effectively, follow these steps.
- Take in the situation: check the critical count first on the summary by severity.
- Set priorities: review the critical risks first.
- Read the detail: establish each risk's exposure path and which services it affects.
- Act or dismiss: for items that need a real security fix, act and then dismiss them; for acceptable items, choose a reason and dismiss.
- Run the CIS Benchmark: run the CIS Kubernetes Benchmark from COP Console to check the cluster's overall security configuration.
- Review regularly: review the whole list periodically, including the dismissed risks.
Related documents
- Audit logs — Kubernetes and operating system audit events
- Settings — managing security and system settings
- Incidents — the incidents raised by SLO breaches