10.2. Cache PromQL query guide
The PromQL query syntax supported in custom dashboard and report panels.
Overview
Cache PromQL is the Prometheus-compatible query language used to describe the metric a panel shows in custom dashboards and in the custom reports of the SRE report. It supports the widely used subset of standard PromQL and evaluates against the metric cache the product has already computed.
You write these queries in three places.
- The PromQL query of a custom dashboard panel
- The PromQL panel of a custom report
- The
querytype of a variable (label_values(...))
This document is a reference for people building panels themselves. It sets out which operators and functions are available, what is not supported, and the traps people commonly fall into.
Note: you do not need to know PromQL to build most screens — start from a template in custom dashboards or the SRE report. Come here when you modify a template or assemble metrics yourself.
How it works
Cache PromQL evaluates queries not against an ordinary Prometheus server but against the metrics the product has collected, aggregated and stored in its cache. This has a few practical consequences.
- Time series first: the result is a time series over a range. Single value (stat) and table panels use the series' most recent value.
- Cache resolution: values follow the resolution of the interval (step) stored in the cache, not raw samples.
- Value precision: the cache stores and computes values with about 7 significant digits. A very large value (above about 3.4×10³⁸) becomes infinity, and a small difference between large cumulative values (a difference of 1 near 10¹², say) can disappear from the result. For the precision of time values, see Time and date functions.
Metric Explorer — finding out which metrics exist
To write a query you first need to know which metrics exist. You do not have to memorise their names — explore the cache directly as follows.
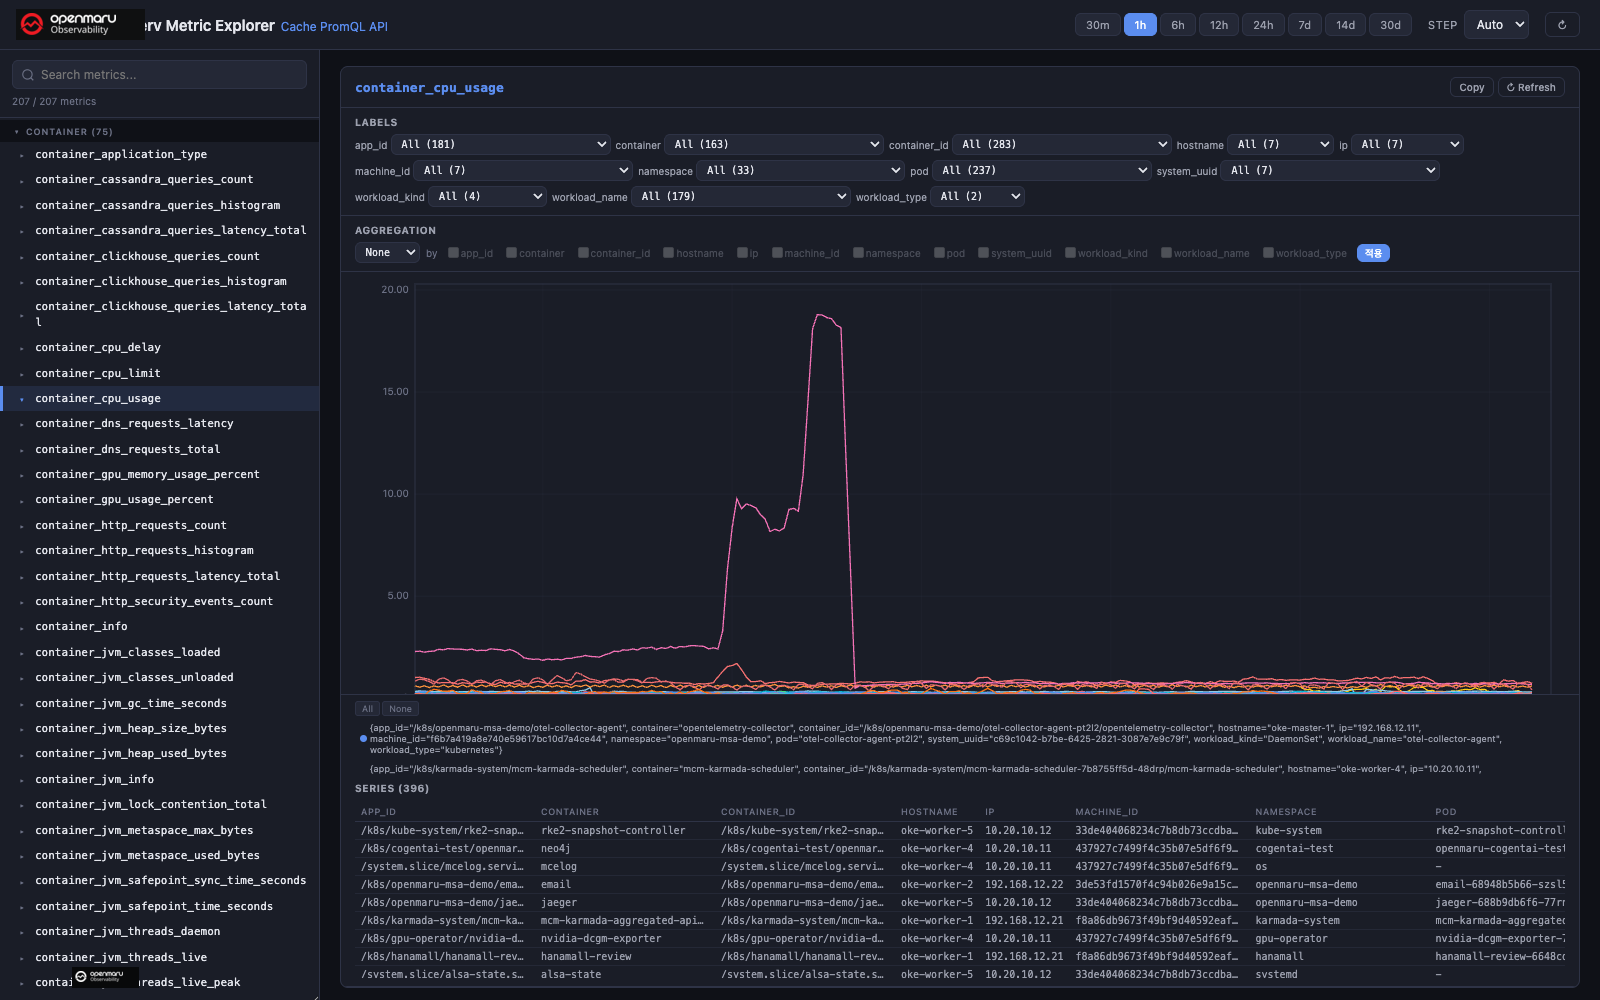
Metric Explorer (at
/api/v1/metrics-explorer) is a dedicated screen for exploring every metric in the cache. Search for and select a metric on the left and the right shows its labels (dimensions) with the number of values each has, the aggregation options, a time-series chart, and the individual series. It tells you at a glance which metrics exist and which labels you can narrow by, without memorising any names.
Listing the metric names
The cache carries Prometheus's standard meta label __name__ (the metric name) as it is. You can use it to pull out every available metric name as a list of values.
- Create a variable on a custom dashboard, set its type to From a query, and set the query to
label_values(__name__). - Save it and the variable combo in the header becomes a dropdown of every metric name in the cache. Scan it for the metric you want.
- To see only a particular prefix, type a search term into the combo (
container_http,node_,kube_).
This variable is for exploration only; delete it once you have found the metric. For how to create variables, see the "Filtering with variables" section of custom dashboards.
Finding a metric's labels (dimensions)
Once you have chosen a metric, find out which labels it carries (namespace, pod, app_id and so on) so you can use them as matchers and aggregation keys.
- Through the preview: in the panel editor dialog of custom dashboards, enter just the metric name and press Preview; the legend of the resulting series shows the labels.
- Enumerating label values:
label_values(<metric>, <label>)lists a label's values. For examplelabel_values(container_http_requests_count, namespace)gives the namespaces the metric exists in.
A catalogue of the main metrics
The metrics in common use, by category. For the full list, use label_values(__name__) above.
Nodes (hosts) — node_*
| Metric | Description |
|---|---|
node_cpu_usage_percent · node_cpu_used · node_cpu_cores | CPU usage (%), cores used, total cores |
node_memory_usage_bytes · node_memory_usage_percent · node_memory_available_bytes | Memory used, usage rate, available |
node_disk_read_bytes · node_disk_written_bytes · node_disk_space_bytes · node_disk_io_time | Disk reads, writes, capacity, I/O time |
node_net_rx_bytes · node_net_tx_bytes · node_net_rx_dropped · node_net_tx_dropped | Network bytes received and sent, and drops |
node_load_average_1m · node_load_average_5m · node_load_average_15m | Load averages |
node_gpu_utilization_percent_avg · node_gpu_memory_used_bytes · node_gpu_power_usage_watts · node_gpu_temperature_celsius | GPU utilization, memory, power, temperature |
node_uptime_seconds · node_info | Uptime, node metadata |
Container and application resources — container_*
| Metric | Description |
|---|---|
container_cpu_usage · container_cpu_limit · container_throttled_time | CPU used, limit, throttled time |
container_memory_rss · container_memory_cache · container_memory_limit | Memory RSS, cache, limit |
container_restarts · container_oom_kills_total | Restart count, OOM kills |
container_net_tcp_bytes_sent · container_net_tcp_bytes_received · container_net_tcp_active_connections · container_net_latency | TCP bytes sent and received, active connections, latency |
container_volume_used · container_volume_size | Volume used and total capacity |
container_log_messages | Log message count (with a level label) |
container_info · container_application_type | Container and application type metadata |
L7 requests and queries (by protocol) — container_<protocol>_*
Application traffic instrumented with eBPF. Each protocol uses the same naming pattern.
| Metric pattern | Description |
|---|---|
container_http_requests_count | HTTP request rate (per second — the rate is already applied; no need to wrap it) |
container_http_requests_total | Cumulative HTTP requests |
container_http_requests_histogram · ..._duration_seconds_total_bucket | The response time histogram (for percentiles) |
container_http_requests_latency_total | Total request-seconds (for approximating average latency) |
container_http_security_events_count · container_http_geo_country_pct | Security event count, and the geographic distribution of requests |
Beyond HTTP, the database and messaging protocols follow the same pattern with either _requests_ or _queries_.
- Request-style (
_requests_):container_kafka_requests_*·container_zookeeper_requests_* - Query-style (
_queries_):container_postgres_queries_*·container_mysql_queries_*·container_mongo_queries_*·container_oracle_queries_*·container_cassandra_queries_*·container_clickhouse_queries_*·container_memcached_queries_* - Others:
container_dns_requests_total·container_dns_requests_latency·container_nats_messages_total
The suffix convention: within a family,
_countis a per-second rate (already applied),_totalis a cumulative count,_histogram/_bucketare for percentiles, and_latency_totalis total request-seconds. The rate is already applied to the_countfamily, so you do not need to wrap it inrate()orincrease()(see rate · irate · increase below).
Language runtimes — container_jvm_* · container_dotnet_* · container_python_*
| Metric (examples) | Description |
|---|---|
container_jvm_heap_used_bytes · container_jvm_heap_size_bytes · container_jvm_gc_time_seconds · container_jvm_threads_live | JVM heap, GC, threads |
container_dotnet_memory_heap_size_bytes · container_dotnet_gc_count_total · container_dotnet_thread_pool_size | .NET heap, GC, thread pool |
container_python_thread_lock_wait_time_seconds | Python thread lock waits |
Kubernetes state (kube-state) — kube_* · pod_*
| Metric | Description |
|---|---|
kube_pod_info · kube_pod_status_phase · kube_pod_container_status_ready | Pod metadata, state, container readiness |
kube_pod_container_resource_limits · kube_pod_container_resource_requests | Container requests and limits (CPU, memory) |
kube_deployment_spec_replicas · kube_statefulset_replicas · kube_daemonset_status_desired_number_scheduled | Workload replicas |
pod_count · pod_pending · pod_failed | Pod count, pending, failed |
kube_node_info · kube_service_info | Node and service metadata |
Note: the tables above list only the main metrics. Which detailed metrics exist — by language, protocol, GPU and so on — varies by environment, so always confirm what is actually available with
label_values(__name__).
The supported syntax
The following is available in the default configuration. An administrator can turn some advanced functions off through a server option (see the note below).
Metric selectors and label matchers
Add label conditions in braces after the metric name to narrow the target.
| Matcher | Meaning | Example |
|---|---|---|
label="value" | Exact match | {namespace="prod"} |
label!="value" | Not equal | {namespace!="kube-system"} |
label=~"regex" | Regular expression match | {pod=~"web-.*"} |
label!~"regex" | Regular expression non-match | {pod!~"canary-.*"} |
Variables can be used alongside: {namespace="{{namespace}}"}. Multi-select variables are substituted automatically in the form namespace=~"a|b".
The metric name can also be chosen by a regular expression, for example {__name__=~"container_(cpu_usage|memory_rss)", namespace="prod"}. Each result series carries its own metric name (__name__). One query can select up to 20 metrics; beyond that an error is shown, so narrow the expression. A selector with labels only and no metric name ({namespace="prod"}) is not supported.
When several metrics are selected and a function or operation that drops the metric name is applied (ceil, abs, x * 2, say), series that differ only in the metric name can no longer be told apart. As in Prometheus, this is an error (HTTP 400, "vector cannot contain metrics with the same labelset"). Split the query per metric, or use an aggregation that keeps the name, such as by (__name__).
Aggregation operators
Gather several series into one. by(...) sets what to group by; without(...) sets which labels to drop.
| Operator | Description |
|---|---|
sum | Total |
avg | Average |
min / max | Minimum / maximum |
count | The number of series |
topk(k, ...) / bottomk(k, ...) | The top / bottom k. In a range query the ranking is made at each point separately, so a line breaks where a series drops out of the ranking, and the legend can show more than k series |
quantile(φ, ...) | Quantile |
stddev / stdvar | Standard deviation / variance |
group | Group existence (every value becomes 1) |
count_values("label", ...) | The number of series with the same value; the value goes into the given label |
For example sum by(namespace)(container_memory_rss) gives memory totals per namespace.
without(...) removes only the listed labels and keeps all the others, so a remaining label such as container_id splits the result into series per that label.
by(...) can list several labels. For example count by (namespace, pod) (kube_pod_info) counts per namespace and Pod pair; count the distinct pairs with count(count by (namespace, pod) (kube_pod_info)).
An aggregation result keeps only the labels listed in by(...); the metric name (__name__) is not kept either. To split by metric, add __name__, for example count by (__name__) ({__name__=~"container_(cpu_usage|memory_rss)"}).
At a point where no series has a value, the result of sum, count and avg is not 0 but a gap, so that missing data can be told apart from a real 0. To show a label such as workload_name in the legend, add it to by(...), for example by (app_id, workload_name).
Binary operations and comparisons
- Arithmetic:
+-*/%^(power)atan2. A unary-changes the sign, for example-sum(metric). - Comparison:
><>=<===!=— keeps only the series that satisfy the condition. The kept series keep their labels and metric name. Add theboolmodifier to turn true/false into 0/1 values. - Logical and set:
andorunless
For example sum(rate_metric) / sum(total_metric) * 100 calculates a percentage.
Vector matching
Pairs different metrics by label for an operation.
| Modifier | Description |
|---|---|
on(labels) | Match on the listed labels only |
ignoring(labels) | Match ignoring the listed labels |
group_left(labels) | The left side is many-to-one (take labels from the right) |
group_right(labels) | The right side is many-to-one |
For example pod_metric * on(node) group_left(role) node_meta.
Functions
Mathematical functions
abs · ceil · floor · round · exp · ln · log2 · log10 · sqrt · sgn · clamp(v, min, max) · clamp_min(v, min) · clamp_max(v, max)
Trigonometric: sin · cos · tan · asin · acos · atan · sinh · cosh · tanh · asinh · acosh · atanh · deg (radians → degrees) · rad (degrees → radians) · pi()
When the whole expression is a constant, such as pi() or 1 + 1, it is shown as one series with no labels and the same value at every point.
Label functions
label_replace(v, dst, replacement, src, regex)— change a label's value, or create a new label, with a regular expressionlabel_join(v, dst, sep, src1, src2, ...)— join several labels into a new one
Time and date functions
time()— the time (in seconds) at each pointtimestamp(v)— the sample's timestamphour(v)·minute(v)·day_of_week(v)·day_of_month(v)·days_in_month(v)·month(v)·year(v)— with an argument, computed from that value; without one, from each point in time
Date functions use Korea Standard Time (KST) by default. Prometheus uses UTC, so the same query can give a result that differs by 9 hours. For example, at 03:00 UTC hour() is 12 on this server and 3 in Prometheus. An administrator can change the zone with the server environment variable OBSERV_PROMQL_TIMEZONE, set to an IANA time zone name (UTC, America/New_York, say). When it is not set the zone is KST; when the value is invalid, the server logs a warning and uses KST.
The results of time(), timestamp(v) and vector(<time>), and adding or subtracting a scalar to them, are exact to the second. Stored metric values keep about 7 significant digits, so a metric whose value is itself a time (process_start_time_seconds, say) can be off by up to about a minute.
Range aggregation (_over_time)
Aggregates the values within a given time window. For example avg_over_time(metric[5m]).
avg_over_time · sum_over_time · min_over_time · max_over_time · count_over_time · last_over_time · present_over_time · stddev_over_time · stdvar_over_time · quantile_over_time
Change functions
These compute how much a value changed within a window, for example changes(container_restarts[1h]).
delta(v[window])— the difference between the first and last value of the window (extrapolated to the window edges)deriv(v[window])— the per-second change (least-squares slope)idelta(v[window])— the difference of the last two values in the windowchanges(v[window])— the number of times the value changedresets(v[window])— the number of times the value decreased
Use them on gauges (metrics that show a current value). On a metric alias that already has a rate applied, such as a request count, they give "the change of a rate", which means something else.
Note: range aggregations and change functions compute the window from the values at the stored interval of the metric being read. Most metrics are stored every 15 seconds; only the user-estimation metrics (
rr_ue_active_*) are stored every 60 seconds. Even when the query interval (step) is longer than the stored interval, every stored value in the window is used.
- The range window (
[5m], say) must be at least as long as the stored interval; a shorter window is an error.- When the stored values one query reads exceed the limit (default 50,000,000,
OBSERV_PROMQL_WINDOW_MAX_POINTS), or the number of queries computing this way reaches the limit (default 4,OBSERV_PROMQL_WINDOW_MAX_CONCURRENT), the server approximates from values reduced to the query interval. It then puts an approximation warning in the responsewarnings, and custom dashboards show a warning icon on the panel. For example, a 5-dayavg_over_time(container_memory_rss[1h])over all containers (about 100 million values) is approximated, and a 1-day range (about 5.3 million values) is computed exactly.- When approximating, the range window must be at least as long as the query interval; a shorter window is an error.
- For
absent_over_time, a window shorter than the query interval is an error.- Inside a subquery there is no approximation; it is an error (see Subqueries).
Other functions
histogram_quantile(φ, ...)— a quantile (P95, say) from a histogramvector(s)— turns a scalar into a series with no labelsscalar(v)— turns a single series into a scalarabsent(v)·absent_over_time(m[5m])— returns 1 where there is no value (detecting gaps)sort·sort_desc·sort_by_label— sorting is meaningless in a range query, so these pass through unchanged
Comparing against an earlier period (offset)
offset fetches the values of the same window in the past for comparison.
For example metric / (metric offset 1d) gives the ratio against a day ago.
When offset is not a multiple of the query interval (step), it is rounded up, into the past, to the nearest multiple of the step. For example, with a 60-second step offset 90s is computed as offset 120s, because the cache holds values only at step boundaries.
When the start of a range query does not fall on a step boundary, the times in the response are aligned to step boundaries (whole minutes, say).
Subqueries
A subquery evaluates an expression at a fixed resolution and gives the result to a range aggregation or change function. The form is <expr>[<range>:<resolution>].
For example max_over_time(sum by (namespace) (container_memory_rss)[1d:5m]) gives the daily maximum of the memory total per namespace.
- Where it can be used: the range argument of the range aggregations (
*_over_time,quantile_over_time), the change functions (changes,resets,deriv,delta,idelta) andabsent_over_time. Subqueries can be nested, and parentheses andoffsetare allowed. - Without a resolution (
[1h:]) the resolution is 1 minute, the Prometheus default. - Evaluation times: the server evaluates the inner expression at multiples of the resolution, so the same subquery gives the same values whatever the query time.
- A resolution shorter than the stored interval: at a time without a stored value, the latest stored value within 5 minutes is used, as in Prometheus. The cache does not record when a series stops, so the last value continues for 5 minutes after the data stops.
- Limits: a subquery whose inner points exceed the per-query limit (default 50,000,000,
OBSERV_PROMQL_WINDOW_MAX_POINTS) or the concurrency limit (default 4,OBSERV_PROMQL_WINDOW_MAX_CONCURRENT) is an error. Use a coarser resolution or a shorter range; the server does not change the resolution. A range aggregation inside a subquery (for examplemax_over_time(count_over_time(x[5m])[1h:2m])) follows the same rule: over the limit it is an error, not an approximation. One subquery uses one concurrency slot. timestamp(metric)inside a subquery: the time of the stored sample that was used, as in Prometheus. With 60-second data and a 10-second resolution, the evaluation times that reuse one stored sample all return that sample's time.timestamp()of an expression that is not a metric (for exampletimestamp(x + 0)) is the evaluation time.
These subqueries are errors (HTTP 400): a subquery without a function (sum(x)[1h:5m]) and a subquery as the argument of rate(), irate() or increase() (the server cannot tell whether the inner result is a raw counter or a value already stored as a rate). A subquery with rate() inside (max_over_time(rate(x[5m])[1h:1m])) is evaluated; rate() follows the rules in rate · irate · increase.
Query interval and time handling
Unlike Prometheus, the cache sets times and intervals by these rules.
- A range query without
step: the server picks the interval — the smallest of 15 s, 30 s, 1 min, 2 min, 3 min, 5 min, 15 min, 30 min and 1 h that gives at most about 1,000 points. For example a 1-hour range gets 15 s, 24 hours gets 2 min and 7 days gets 15 min. Prometheus returns an error whenstepis missing. - The evaluation time of an instant query: the server rounds the evaluation time down to a boundary of the stored interval of the metrics the query reads (the shortest one when there are several, usually 15 seconds), so the window of a range aggregation can move up to one interval into the past.
- How far back an instant query looks for a value: when there is no value at the evaluation time, the server looks back up to 5 minutes for the latest value, as Prometheus does. This applies only to metric selectors, not to the results of operations or functions. The cache has no staleness markers, so a metric whose collection stopped keeps its last value for 5 minutes.
- Unreadable cache files: when part of a cache file is damaged and cannot be read, the server returns the result from the parts it could read and puts a "the result may be incomplete" warning in the response
warnings. Custom dashboards show this warning on the panel. Operators can see the read failures in the server metricopenmaru_cache_chunk_read_errors_total. - Filling gaps in a range response: a gap in the middle of a series that is 60 seconds or shorter is filled with a straight line between the values on either side. With an interval longer than 60 seconds, only a one-interval gap is filled, so a query with a 1-hour interval also fills a 1-hour gap. The results of comparison filters (
x > 5, say),and,or,unless,topk,bottomkandcount_valuesare not filled.
Common patterns and their caveats
rate · irate · increase
The cache stores most cumulative counters, such as request counts and CPU time, already as a per-second rate. For example, container_cpu_usage is rate(container_resources_cpu_usage_seconds_total[…]), stored with a window of 3 × the scrape interval.
The server picks the calculation from the argument of rate(), irate() or increase():
| Argument | rate(x[N]) | increase(x[N]) | irate(x[N]) |
|---|---|---|---|
A metric already stored as a rate (container_cpu_usage, container_http_requests_count, …) | The mean of the stored rate in window N | The mean × N (seconds) | The latest stored rate in the window |
Any other metric (a raw counter such as container_oom_kills_total) | As in Prometheus (counter resets, extrapolation to the window edges) | As in Prometheus | As in Prometheus |
-
On a metric already stored as a rate, the response
warningssays the stored rate was averaged. The custom dashboard shows this warning on the panel. The value is close to, but not the same as, what Prometheus computes withrate(x[N])from the original counter: each stored rate was itself computed over a window of 3 × the scrape interval, so the start of window N includes a little data from before the window. -
When window N is shorter than the stored rate window (3 × the scrape interval, usually 45 seconds), a shorter-window value cannot be made. The server uses the stored values as they are and adds a warning.
-
With and without
rate(), the unit is the same but the value is different, because the averaging window is different.Query What the server computes Meaning container_cpu_usageThe stored value as is Per-second usage over about the last 45 seconds (3 × the scrape interval) rate(container_cpu_usage[5m])avg_over_time(container_cpu_usage[5m])Mean per-second usage over the last 5 minutes. The graph is smoother irate(container_cpu_usage[5m])last_over_time(container_cpu_usage[5m])The latest stored value, the same as without rate()increase(container_cpu_usage[5m])avg_over_time(container_cpu_usage[5m]) * 300The increase over the last 5 minutes Example measured at the same time: the sum of
rate(container_cpu_usage[5m])is 3.447, the sum ofcontainer_cpu_usageis 3.041. -
For a metric already stored as a rate, write the expression for what you need. The query then shows what it computes and gets no warning.
- Current value: use the metric as is, e.g.
sum by(app_id)(container_http_requests_count{namespace="{{namespace}}"}). - Window mean: use
avg_over_time(x[5m])(the same value asrate(x[5m])). - Increase in the window: use
avg_over_time(x[5m]) * 300(the same value asincrease(x[5m])).
- Current value: use the metric as is, e.g.
-
A metric-name regex (
{__name__=~"a|b"}) as the argument is an error, because each metric needs a different calculation.
Narrowing by namespace
Most metrics can be narrowed by namespace with the {namespace="{{namespace}}"} matcher. Using a variable re-queries the panel automatically when you change namespace in the header combo.
Response time percentiles
Get latency percentiles either by applying histogram_quantile to a histogram-based metric, or by approximating — dividing a load-weighted total (total request-seconds, say) by the request count. See the SLO and RED examples in the templates.
Tip: when building a new panel, check the query first with the Preview button in the panel editor dialog of custom dashboards. Errors and empty results are reported with a message.
What is not supported
The following are not currently supported.
| Item | Alternative |
|---|---|
The @ modifier (a fixed point in time) | Not supported — use offset |
limitk · limit_ratio | Not supported — use topk · bottomk |
A subquery without a function, a subquery under rate() | Use it inside a range aggregation or change function (see Subqueries) |
A metric-name regex as the argument of rate() · irate() · increase() | Name each metric |
predict_linear · holt_winters | Use Resource Forecast in the SRE report |
Time masking such as metric and hour() >= 9 | Not supported (time functions carry no labels, so masking is impossible) |
Unsupported syntax is reported as an error at preview or output time. The message names the unsupported feature.
Using variables
A variable is a filter value applied across several panels. Refer to it in a query as {{variable}}.
- query type variables look values up with
label_values(metric, label). For examplelabel_values(namespace). - Dependent variables put the parent variable into a matcher to narrow the child list. For example
label_values(container_info{namespace="{{namespace}}"}, pod).
For how to define and select variables, see the "Filtering with variables" section of custom dashboards.
Note: some special metrics (user estimation metrics stored under a composite key, for instance) may not be suitable as a source for
label_values(). Where a variable list comes up empty, enumerate namespaces from an ordinary metric such ascontainer_http_requests_count.
Frequently asked questions
The query returns nothing
- Check the metric name and label values for typos.
- Check that the matcher is not too narrow (that the
{namespace="..."}value actually exists). - Where you use a dependent variable, the parent variable has to be selected first.
- Use the Preview button to see the result and any error message.
Short gaps in a chart are joined by a line
A short gap where collection briefly stopped is shown by joining the values on either side with a straight line, so that the chart does not look broken. A long gap is shown as a gap. For how long a gap is filled, see Query interval and time handling.
The request rate looks strangely high or low
The rate is already applied to request count metrics. Wrapped in rate(), the server averages the stored rate over the window, so a long window flattens short spikes. Use sum by(...) alone, without rate(), to see the stored values as they are. The response warning (the warning icon on a custom dashboard panel) tells which calculation was used.
I want to use predict_linear
Cache PromQL does not support forecasting functions. For forecasting future usage, use the Resource Forecast tab of the SRE report, which offers linear regression, Holt-Winters, ARIMA and SARIMA.
An advanced function does not work
Mathematical functions, range aggregation and other advanced functions are on by default, but in environments where an administrator has disabled them through a server option you may see "this function is disabled". Ask your administrator.
Related documents
- Custom dashboards — building dashboards with PromQL panels and variables
- SRE report — the PromQL panels of custom reports, and forecasting
- Common chart guide — the shared components and controls of time-series charts