7.6. Runtime Security
When to Look at This
- When checking that observation is running normally
- When looking for why no events appear
- When checking which tracing policies are in place and what they catch
What Runtime Security Is
It observes what containers actually do while they run.
Where the policy engine checks a resource's configuration before it is deployed, runtime security watches what the resulting process executes, which files it opens, and where it connects. Configuration can satisfy every rule and the runtime behavior still differ.
An agent on each node observes kernel-level activity and records what it catches as events.
Menu: Cluster > Runtime Security
This screen shows whether observation is working and which policies are in place. The collected events themselves are viewed in OPENMARU Observability.
Screen Layout
The screen has three parts, top to bottom.
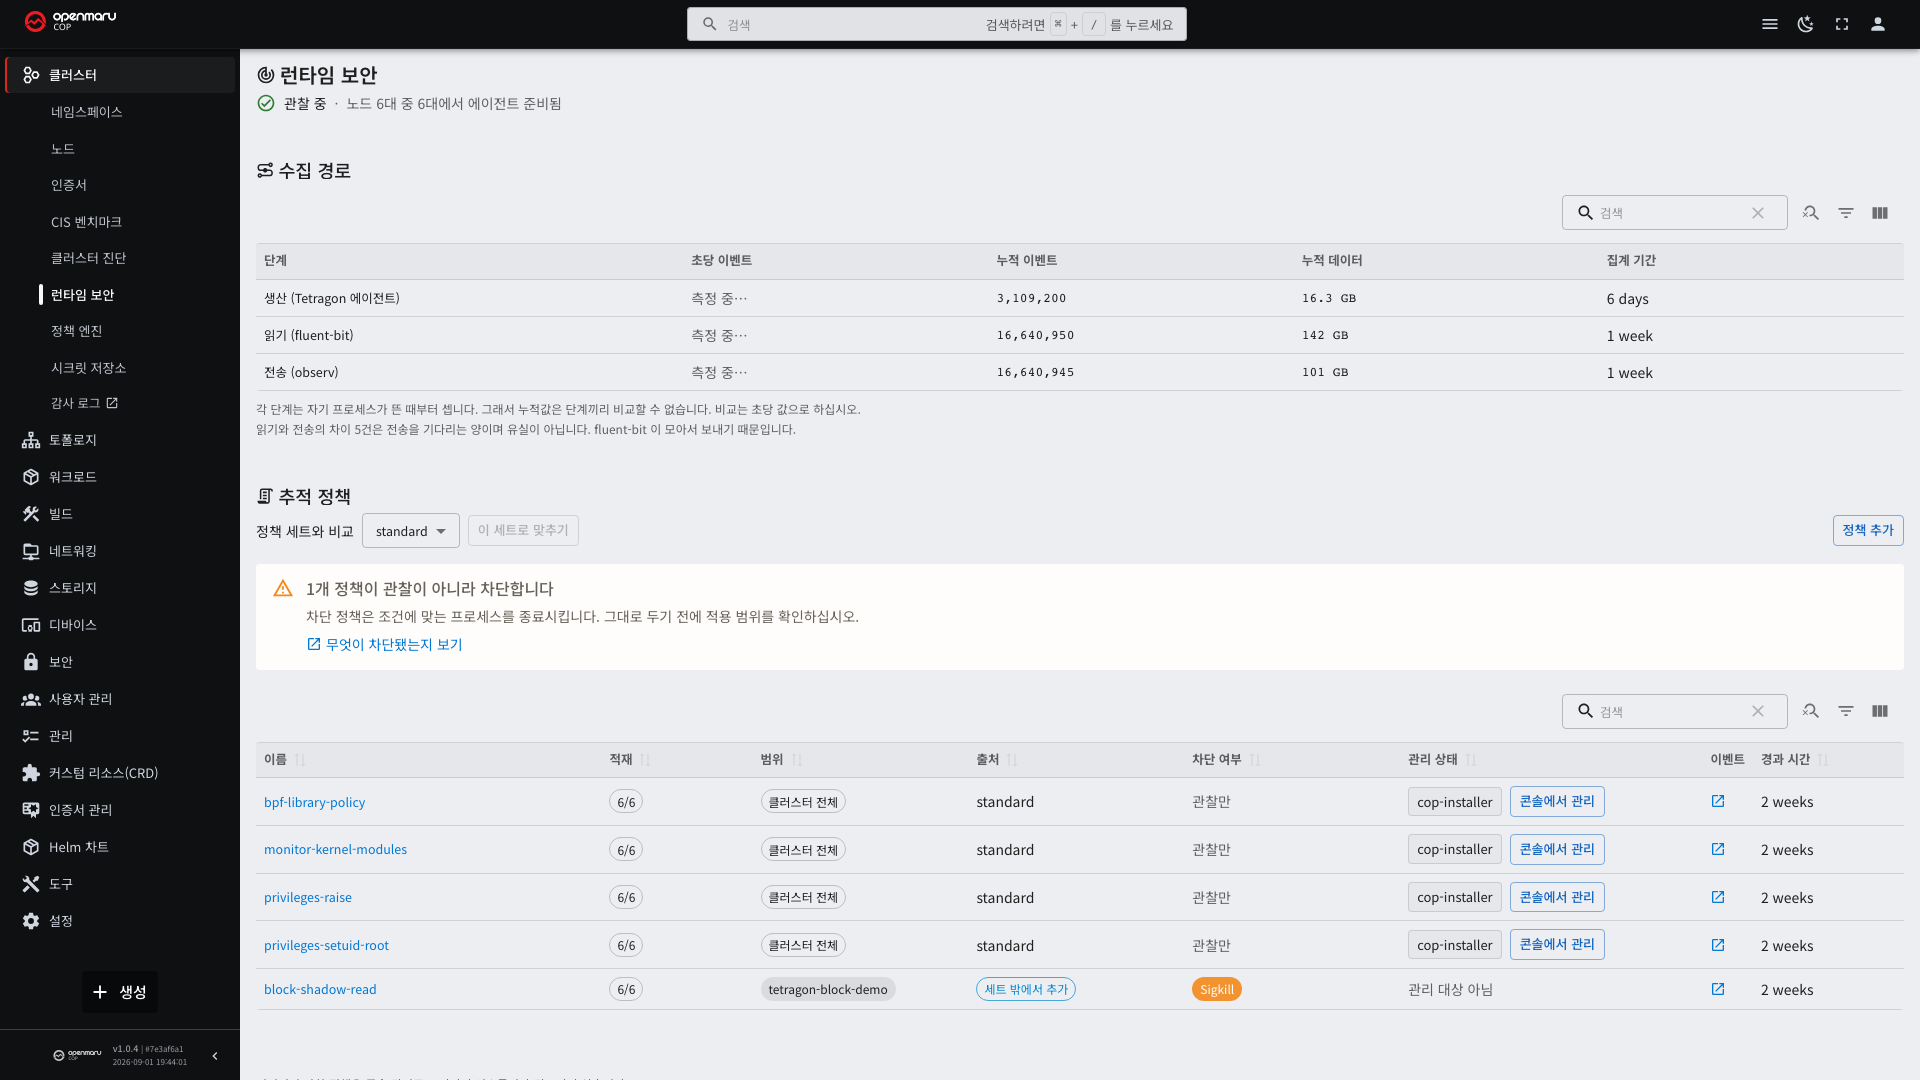
| Part | What it shows |
|---|---|
| Runtime security | Whether the agent is running on each node |
| Collection path | How far events got: produced, read, or forwarded |
| Tracing policies | The policies in place, and matching a policy set |
Without permission you see a notice instead of numbers. This screen reads agent metrics from the nodes directly. If your account cannot read them, the screen says so.
Agent Status
The top of the screen shows how many nodes have a ready agent. When every node is healthy it shows a single Observing line; when a node is not ready, a warning appears.
Nodes without a running agent produce no events. No events does not mean nothing happened on that node.
This is the first place to check when events are missing.
The Collection Path
Events pass through three stages before reaching OPENMARU Observability. The table shows how much each stage has handled.
| Stage | What it does |
|---|---|
| Produce | The node agent writes what it observed in the kernel to a file |
| Read | The log collector reads that file |
| Forward | It sends the events to OPENMARU Observability |
| Column | Description |
|---|---|
| Events per second | Recent throughput. Right after the screen opens it reads Measuring… and values appear after 15 seconds |
| Total events | How many that stage has handled so far |
| Total data | How much it has handled |
| Counting since | When the count started. Nodes start at different times, so this may be a range |
Do not compare totals between stages. Each stage counts from when its own process started. To compare stages, read events per second.
The gap between read and forward is usually what is waiting to be sent, not loss. The collector batches events before sending them.
Events from the namespaces holding COP's own components are never recorded. They account for more than half the volume and would bury the behavior of business applications.
Notices on the Collection Path
When something is wrong, a notice appears above the table.
| Notice | Meaning | What to do |
|---|---|---|
| Events are produced but not collected | The agent is writing but the collector is not reading | Ask your operator to check the collector. Events already lost to log rotation cannot be recovered |
| Forwarding is falling behind | Unsent events are piling up | Once the buffer fills, events are dropped. The forwarding target needs checking |
| Events were dropped | The buffer limit was exceeded and events were discarded | They cannot be recovered. Ask your operator about the cause |
Tracing Policies
The policies applied to the cluster. Cluster-wide policies and namespace-scoped policies appear in one table.
| Column | Description |
|---|---|
| Name | The policy name. Selecting it opens the detail screen |
| Loaded | Nodes the policy actually loaded on / nodes checked |
| Scope | Whole cluster or the target namespace |
| Source | Whether the policy belongs to the selected policy set or was added outside the set |
| Blocking | The blocking action if it has one, otherwise observe only |
| Managed state | Whether the installer manages it or it was changed in the Console |
| Events | Opens the events that policy produced in OPENMARU Observability |
| Age | Time since the policy was created |
A loaded count short of every node, such as
4/6, is highlighted, along with which node missed it. A node without the policy loaded produces no events for it.
When a policy has a blocking action, a notice appears above the table. A blocking policy terminates matching processes, so check its scope before leaving it in place.
Matching a Policy Set
Selecting a policy set above the table shows the difference between that set and the current cluster.
[Match this set] first shows what would be added and what would be removed in a confirmation dialog, and runs only after you approve. With no difference, the button cannot be selected.
A difference is not automatically a problem. The policies may have been adjusted on purpose.
The smallest set contains no policies at all. Matching it removes every cluster-wide policy.
The Console may not be able to recreate a policy it removed. Policy bodies come from the policy library the installer uploaded, so a policy missing from the library can only be restored by running the installation again. The confirmation dialog says so when this applies.
Adding a Policy
[Add policy] offers two ways.
| Way | Description |
|---|---|
| From the policy library | Choose from the policies the installer uploaded that are not yet applied |
| Write it yourself | Create it in YAML. A starting body is provided |
Both are marked as managed by the Console, so the installer leaves them alone.
Changing the Managed State
The Managed state column decides who manages the policy.
| Button | Result |
|---|---|
| Manage in Console | The installer stops updating this policy. Changes made in the Console stay |
| Return to installer management | The next installation run updates the policy again. Changes made in the Console are lost |
Editing a policy outside the Console means the next installation reverts it, because it does not carry the Console-managed mark. Change the managed state to the Console before editing.
Namespace-scoped policies are neither created nor updated by the installer, so they read not managed and have no such button.
Seeing What a Policy Observes
Selecting a policy name opens a detail screen with what this policy observes. It gives a one-line description of the kernel activity it catches, then three columns: hook point, what it catches, and the filter.
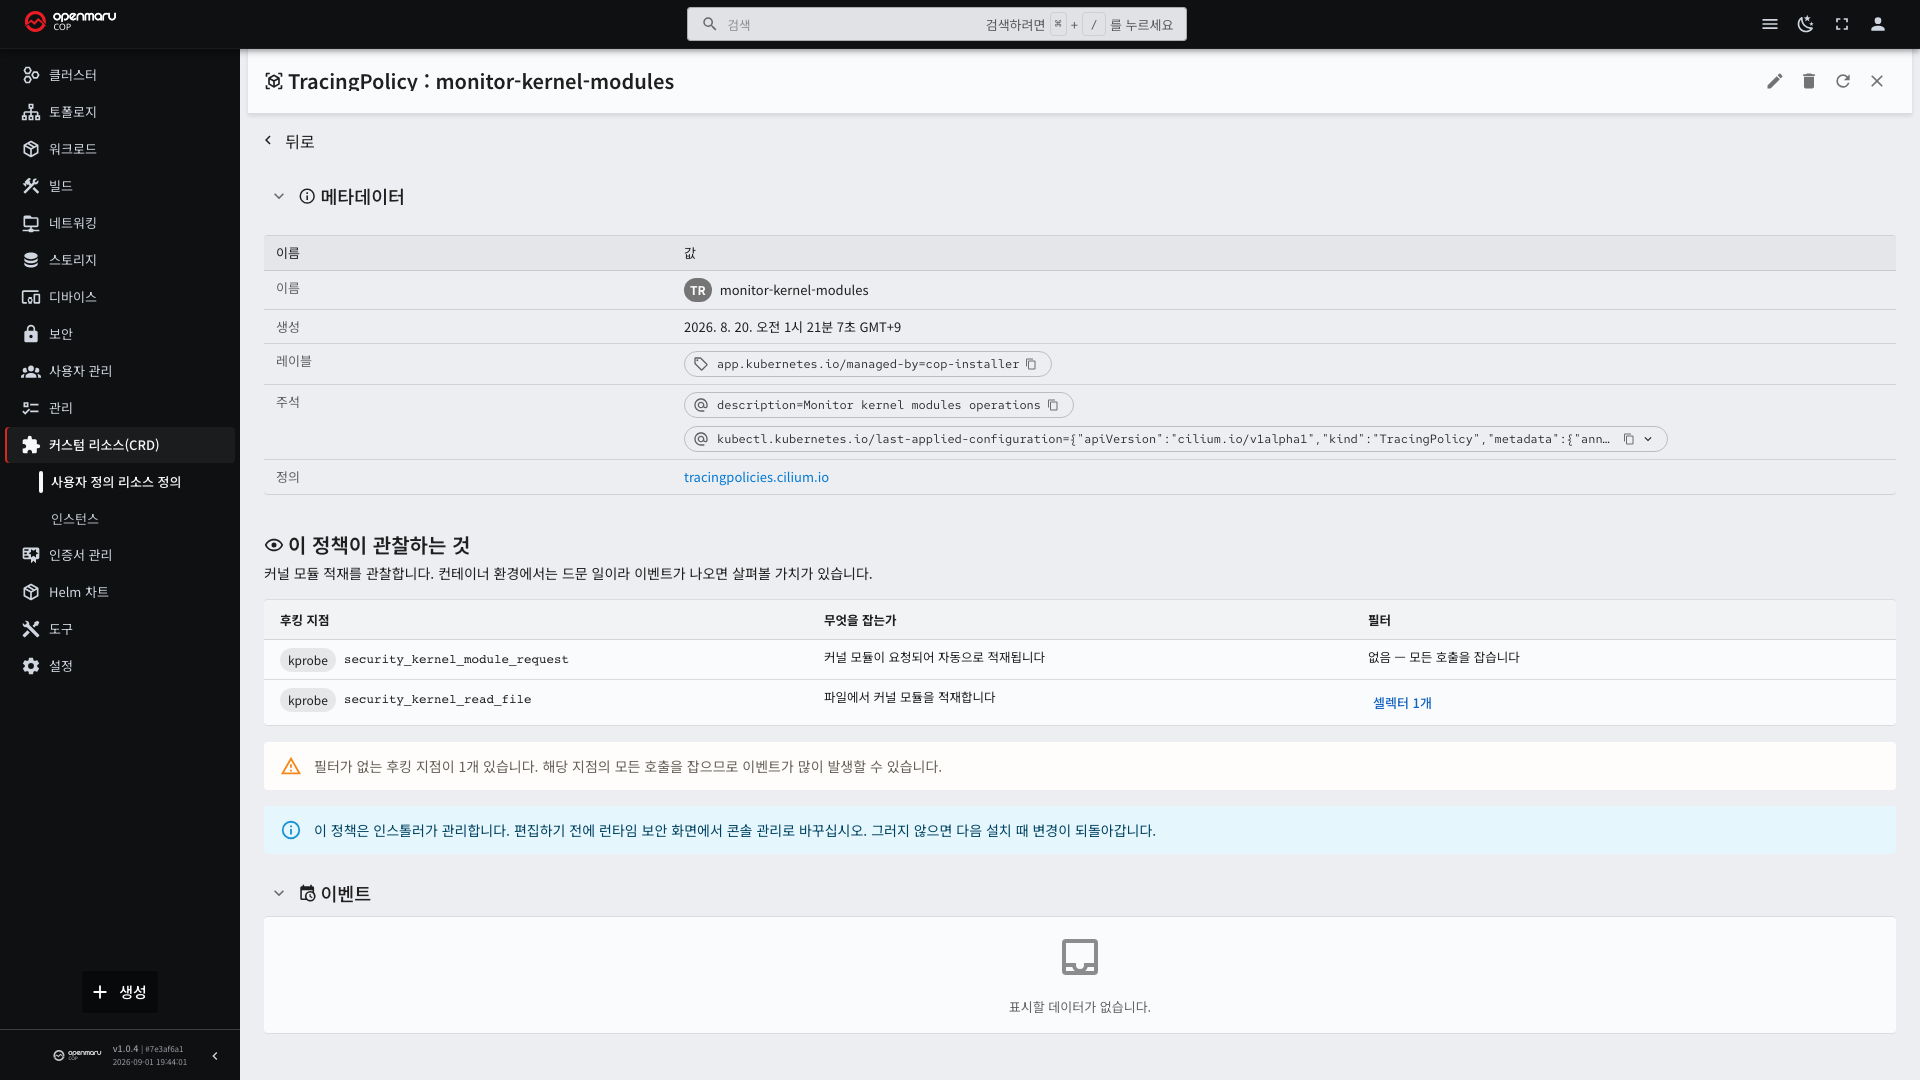
[n selectors] shows the conditions in full. With several condition sets, matching any one of them is enough; within one set, every condition must match.
A hook point with no conditions catches every call to that kernel activity. It can produce a large number of events, and the screen says so.
Viewing Events
This screen shows only policies and collection status. The collected events are viewed on the runtime security screen in OPENMARU Observability.
| What you select | Where it goes |
|---|---|
| The Events icon on a policy row | Only the events that policy produced |
| See what was blocked in the blocking notice | Only the events that were actually blocked |
They open in a new tab. Without OPENMARU Observability installed, these links do not appear.
When It Is Not Installed
Runtime security is optional. On a cluster without it, the screen explains how to turn it on. Installation is done by the operator.
Common Tasks
| Goal | How |
|---|---|
| Confirm observation is healthy | Read the agent status at the top and events per second on the collection path |
| Find why events are missing | Check agent status, then the policy Loaded column, then the collection path notices |
| Widen what is observed | Match a larger policy set, or add from the policy library |
| See events from one policy only | Select the Events icon on that policy's row |
| Edit a policy in the Console | Change Managed state to the Console, then edit |
| Check which policies block | Look for rows in the Blocking column that are not observe only |