2.1. Cluster Overview
When to Look at This
- To check at a glance in the morning that the cluster is healthy
- To see whether resources are left when a pod is not being scheduled
- To find out what is happening, through events
The Overview Dashboard
Select Cluster in the left menu.
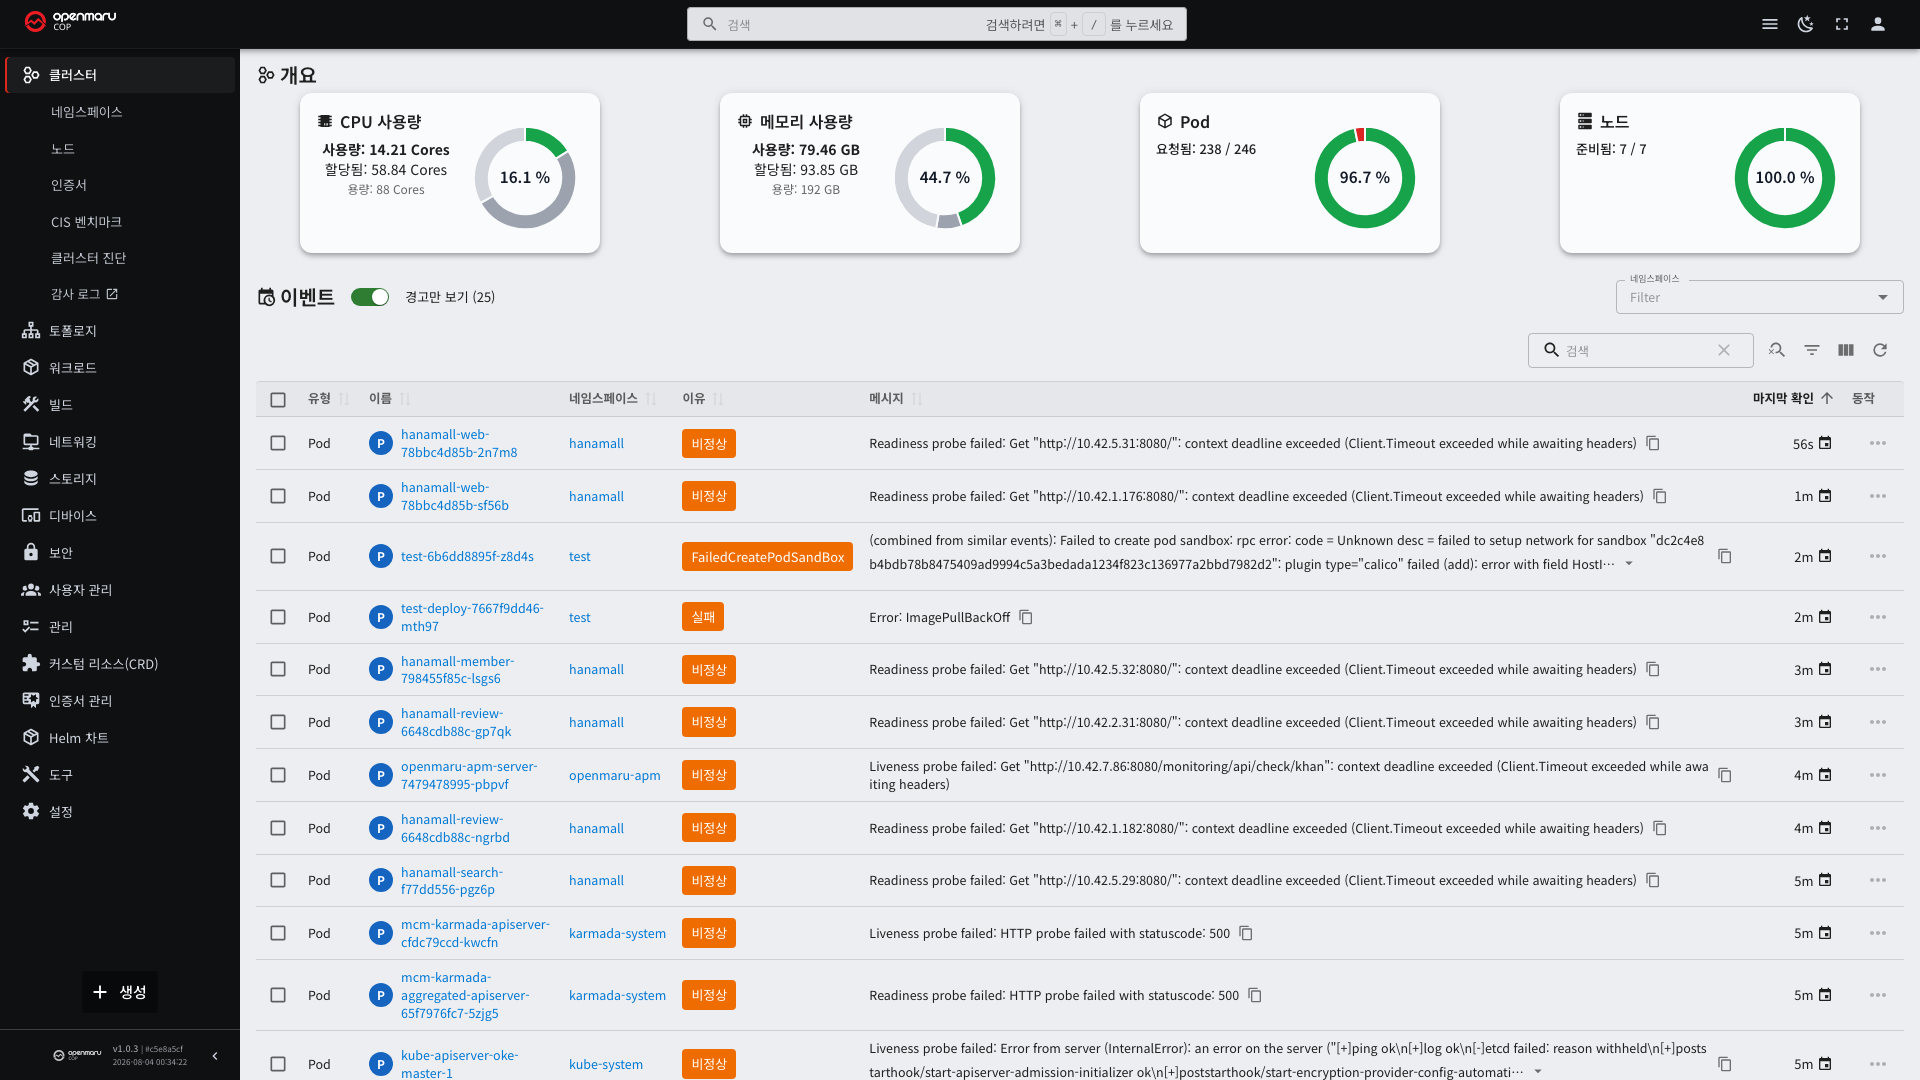
There are four resource usage tiles at the top.
| Tile | What it shows |
|---|---|
| CPU Usage | CPU actually in use, the sum of requests, total capacity |
| Memory Usage | Memory actually in use, the sum of requests, total capacity |
| Pod | The number of running pods and the maximum that can be scheduled |
| Nodes | The number of healthy nodes and the total node count |
Reading Resource Usage
Each tile shows three numbers. They mean different things.
| Label | Meaning | What it tells you |
|---|---|---|
| Used | The amount actually in use now | Performance problems |
| Allocated | The sum of what the pods requested | Whether a new pod can be scheduled |
| Capacity | The total size of the cluster | When to add capacity |
When a pod will not move past Pending, look at Allocated, not Used. Even if actual usage is 20%, nothing more
can be scheduled once Allocated reaches 100%, because Kubernetes schedules based on requests.
Conversely, if usage is 90% while Allocated is 40%, the pods are using far more than they requested. Raising the requests to match reality is more stable.
The Event List
Below the tiles, recent activity in the cluster is shown.
| Column | Description |
|---|---|
| Type | The kind of resource the event occurred on |
| Name | The resource name. Selecting it goes to the detail screen |
| Namespace | The namespace the resource belongs to |
| Reason | Why the event occurred |
| Message | The details |
| Last seen | The most recent occurrence time |
Turning on Only warnings leaves only events with problems. It is usually best to keep it on. Most events are normal-operation events, and without it, problems are hard to find.
Repeated occurrences of the same event are grouped into one row, with only the Last seen time updated. A time that keeps changing means the problem is still ongoing.
Events disappear after about an hour by default. To investigate an older failure, look at the monitoring screen rather than events (see 9.2).
Namespaces
View the list under Cluster > Namespaces.
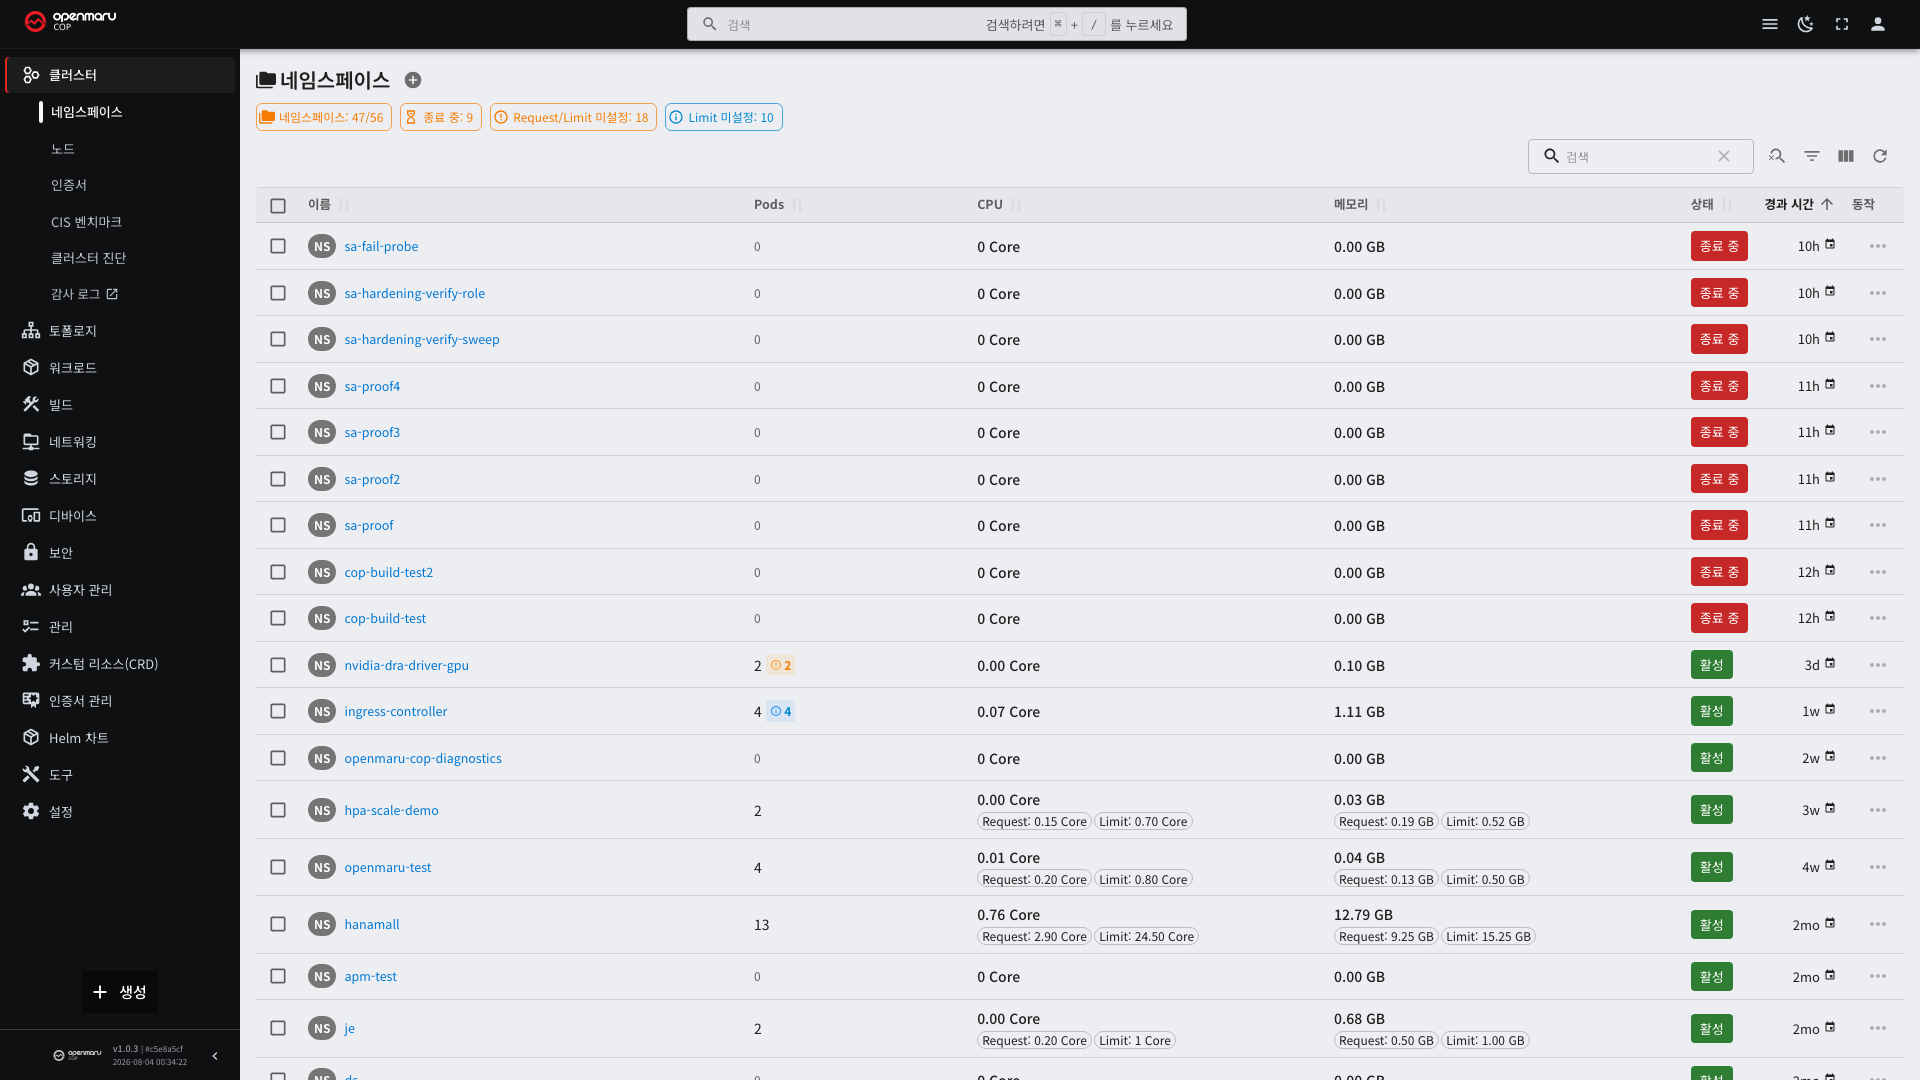
A namespace is a unit for dividing resources. Dividing by team or environment prevents name collisions and lets you grant access permissions and resource limits separately.
| Column | Description |
|---|---|
| Name | The namespace name |
| Status | Active means in use, Terminating means deletion is in progress |
| Age | Time elapsed since creation |
Selecting the name shows the resources in that namespace, the resource limits applied (see 8.1), and the access permissions together.
Staying in Terminating for a long time means resources inside it are not being deleted. The cause is usually a
resource connected to an external system, and it needs a check by operations staff.
Nodes
View the list of servers making up the cluster under Cluster > Nodes.
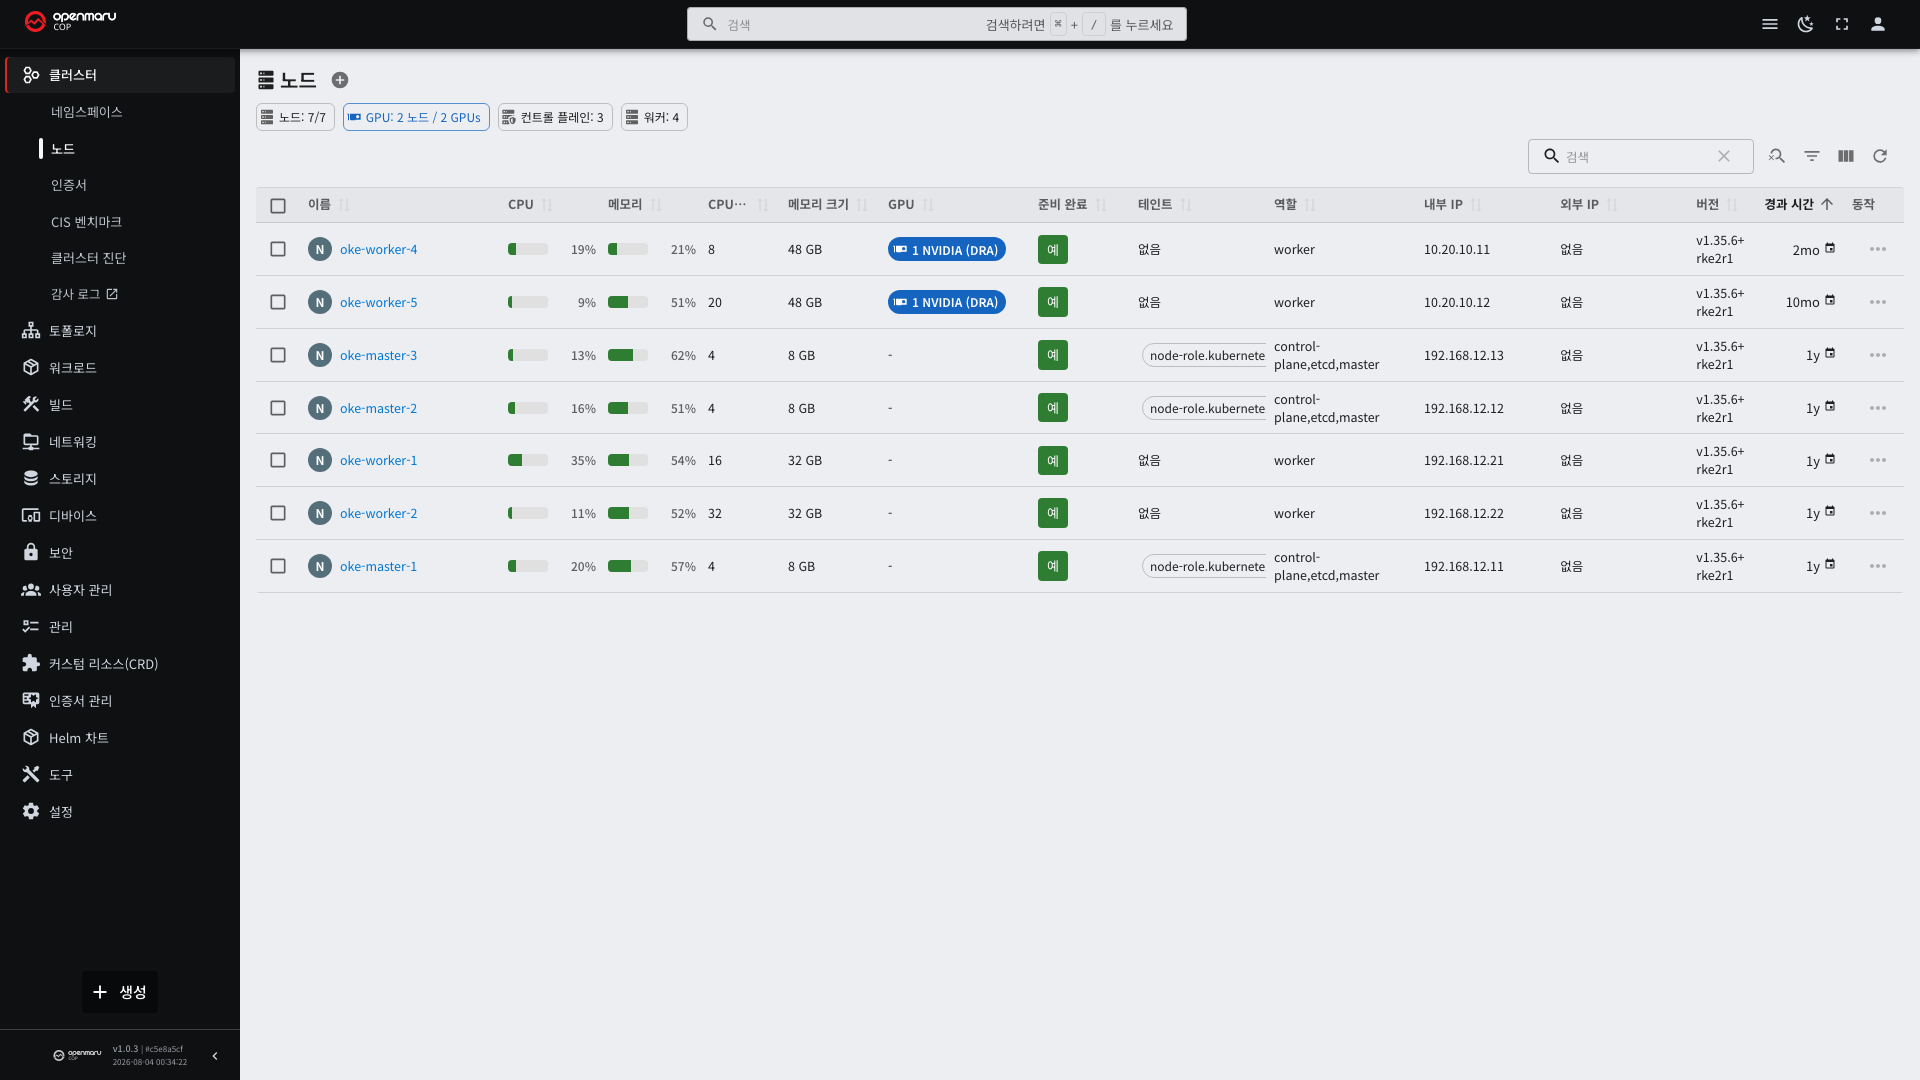
| Column | Description |
|---|---|
| Name | The node name |
| Status | Whether pods can be scheduled on it |
| Roles | control-plane (management) or worker |
| CPU · Memory | Current usage |
| Version | The Kubernetes version installed on the node |
Node Detail
Selecting a node name opens the detail screen.
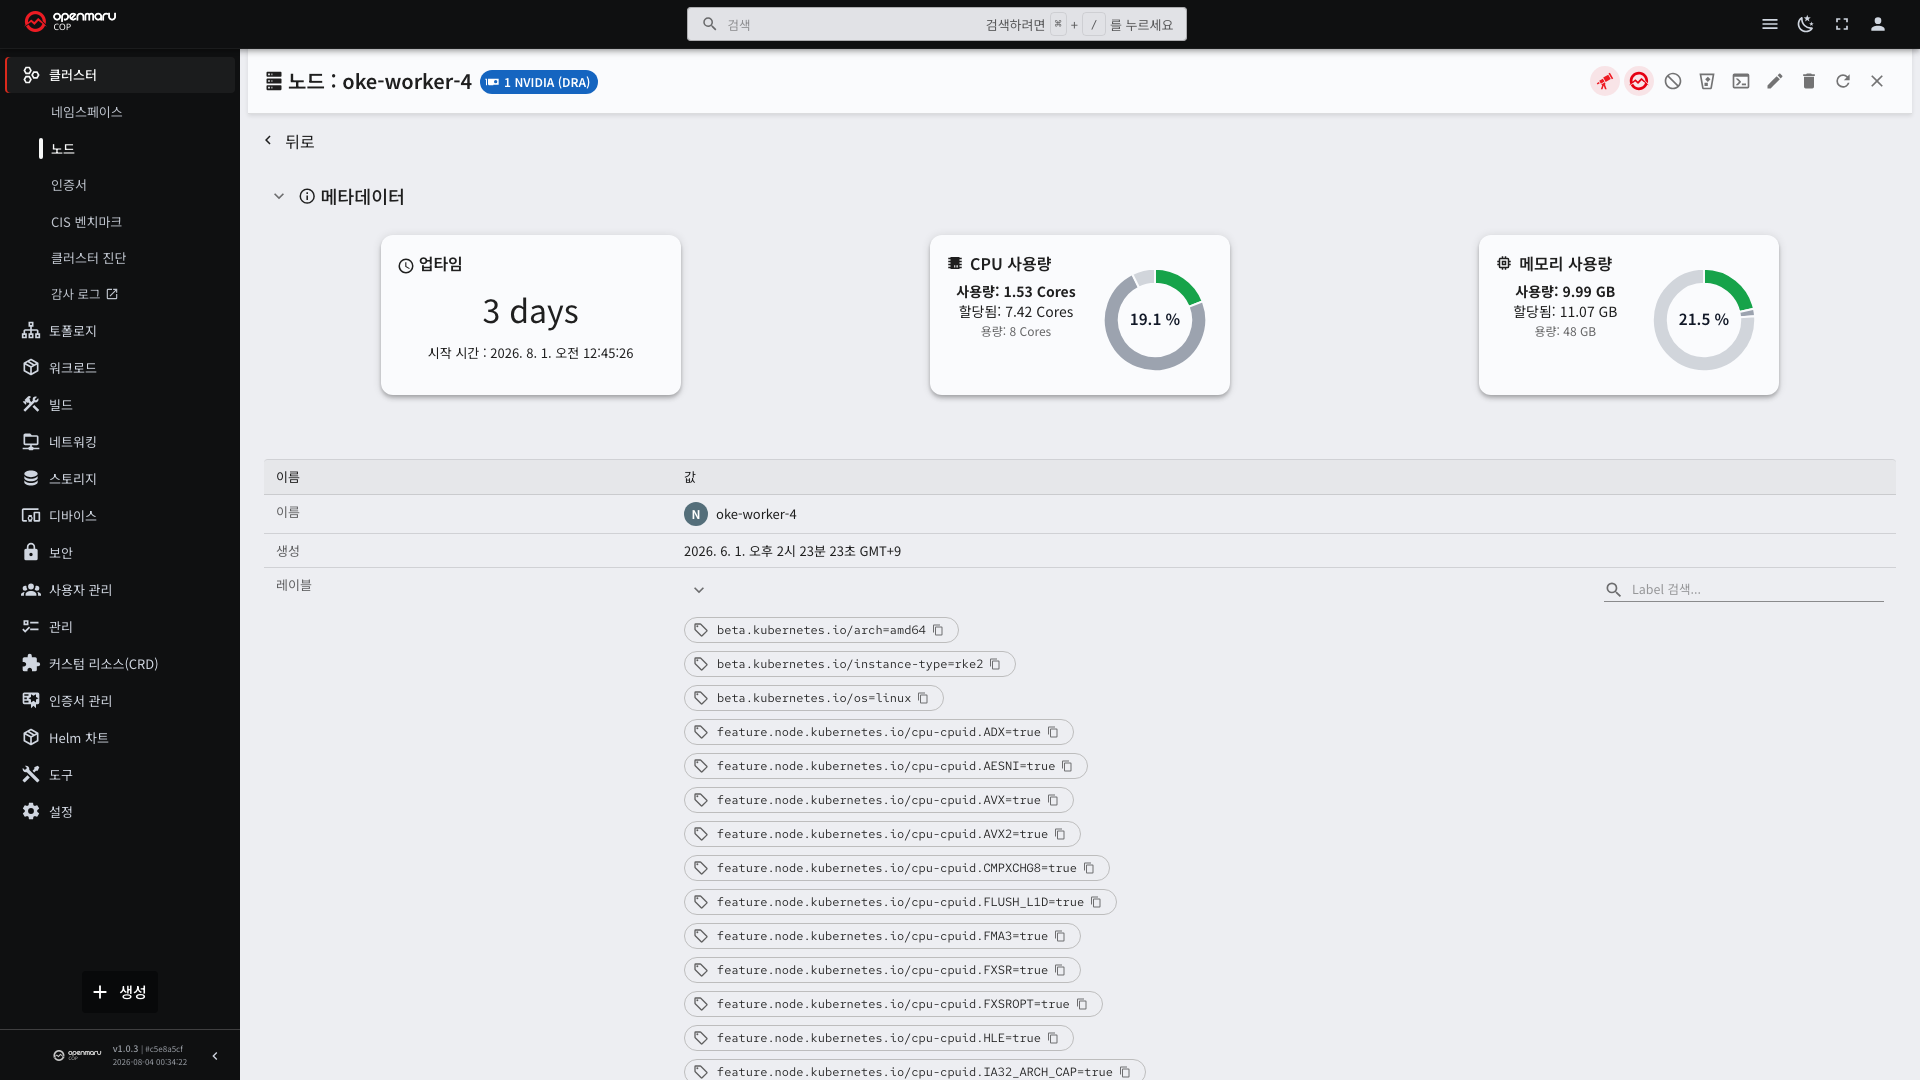
| Section | What it tells you |
|---|---|
| Conditions | The items that determine whether the node is healthy |
| Capacity and allocatable | The resources the node has and the resources it can give to pods |
| System information | Operating system, kernel, container runtime versions |
| Labels | The name tags on the node. Used in pod scheduling conditions |
| Taints | Markers that make the node accept only certain pods |
| Scheduled pods | The list of pods running on this node |
Look at these conditions.
| Condition | Healthy value | If it is otherwise |
|---|---|---|
| Ready | True | The node cannot accept pods |
| MemoryPressure | False | Memory is short |
| DiskPressure | False | Disk is short |
| PIDPressure | False | The process count is at its limit |
Capacity and allocatable are different. Capacity is everything the server has; allocatable is what remains after the share the system uses is subtracted. Pods are scheduled only within the allocatable range.
Not just any pod is scheduled on a node with a taint. If a pod is Pending while the node still has resources
left, check the taints. Management nodes (control-plane) carry a taint by default, so general applications are not
scheduled on them.
The Scheduling Disabled (Cordon) Marker
If a Scheduling Disabled badge appears beside a node name, no new pods are scheduled on that node. It has been blocked ahead of maintenance.
Pods already running continue to operate. Only scheduling is blocked.
The Console does not display "drain complete". Kubernetes has no value meaning that state, so there is no way to distinguish a node that has finished draining from one where scheduling is merely blocked. Check whether the pods are actually gone in the scheduled pod list on the node detail.
Immutable OS Nodes
From 1.0.4 the node operating system can be installed as an Immutable OS. The operating system is built and shipped as one piece, like a container image (image mode), and once deployed it cannot be modified.
What Gets Better
| Benefit | Why |
|---|---|
| Nodes become identical | The operating system does not change, so node states cannot diverge. Fewer problems that happen "only on this node," and the same environment wherever a pod lands |
| Rollback happens in one step | The operating system is one piece, so it is rolled back whole. No need to revert packages one at a time |
| Nothing drifts over time | Nothing can be modified, so nothing accumulates. Package-installed nodes differ from each other after a few months |
Two Things That Change in Return
These change how work is done, so know them first. Both are the other face of "it does not change."
- Additional packages cannot be installed on a node.
dnf installdoes not work and system files cannot be edited. The same holds when you enter the node through the Console's web terminal. This is not a policy: the file system is read-only, so it is physically impossible — not evenrootcan write. - Anything that used to be installed on the node runs as a container. Agents, monitoring tools, and utilities that previously sat on the node are deployed as DaemonSets or pods. This is also how nodes stay identical — nothing touches the node, so node states cannot diverge.
What You See on the Screen
- The System info — operating system field on the node detail shows a different value than on a package-installed node.
- Updates involve a reboot. During it the node reads
NotReadyand pods move to other nodes. During a planned update this is normal.
Updating and rolling back are done by the operator. For the procedure, see the node operating system chapter of the installation guide.
What Immutable OS Gives You for Security
Kept separate because it is used directly to meet security requirements.
| Security benefit | Why Immutable OS makes it possible |
|---|---|
SELinux is Enforcing | The image is fixed in that state, so it cannot be switched off while running. Package-installed nodes are disabled |
| Security settings survive a rollback | The settings live in the image, not in /etc. Rolling back returns /etc to its earlier values, while settings inside the image remain |
| Vulnerability checklist items are already applied | Blocked root login, password policy, account lockout, restricted su, a 10-minute idle session limit, restricted source addresses, and a login banner ship inside the image. Operators configure nothing, and no node can be missed |
| SSH with a password is not possible | Access is by key only. For the same reason, it applies identically on every node |
| The attack surface does not grow | Arbitrary software cannot land on a node. What is installed is what the image contains |
SELinux depends on the installation method. Within the same product, Immutable OS nodes are
Enforcingwhile package-installed nodes aredisabled. This difference applies only to nodes installed as Immutable OS.
When a Node Has a Problem
When a node turns NotReady, its pods are moved to other nodes after a short while.
| Order of checks | Where to look |
|---|---|
| 1 | Conditions on the node detail — which one is False |
| 2 | Events on the node detail |
| 3 | Whether there is room on other nodes to move to (Allocated on the overview screen) |
Fixing the node itself requires server access, so operations staff perform it. Pass on the node name and the condition status.