3.1. Pods
When to Look at This
- When a deployed application will not start
- When a service is slow or unresponsive
- When you need to see logs
- When you need to check files or configuration inside a container
Most failure investigations start on this screen.
What a Pod Is
It is the smallest unit Kubernetes deploys and manages. It is one container or a group of containers, and it corresponds to the process actually running in the cluster.
Containers within a pod share the following.
| What is shared | Meaning |
|---|---|
| Network | They use the same IP address and reach each other over localhost |
| Storage | They can attach the same volume and exchange files |
| Lifetime | They are created together and disappear together |
| Node placement | They always run on the same node |
Why Pods Rather Than Containers
It would be simpler if a single container were the smallest unit. The extra layer called a pod exists because some containers must stay together.
| Example | Main container | Sidecar container |
|---|---|---|
| Log shipping | The application | A collector that reads log files and ships them |
| Configuration refresh | The application | A program that periodically downloads configuration |
| Communication proxy | The application | A proxy that handles encryption and authentication on its behalf |
Such pairs must run on the same node, see the same files, and be created and removed together. Deployed separately, one could land on a different node and they could not share files.
Most pods hold only one container. This is a mechanism for the cases where several are needed.
Why You Do Not Create Pods Directly
If you create a pod directly, nobody starts it again when it terminates. The same is true if the node goes down.
So in practice you create a controller such as a Deployment and let the controller create and manage the pods (see 3.2).
Most pods you see on this screen were created by a controller. The random string after the name is the sign of that.
| Example name | What created it |
|---|---|
web-7d4f9c8b6-x8k2m | Deployment (ReplicaSet hash + pod hash) |
db-0 | StatefulSet (ordinal) |
backup-29579160-abcde | CronJob (run time + hash) |
The Pod List
Go to Workloads > Pods.
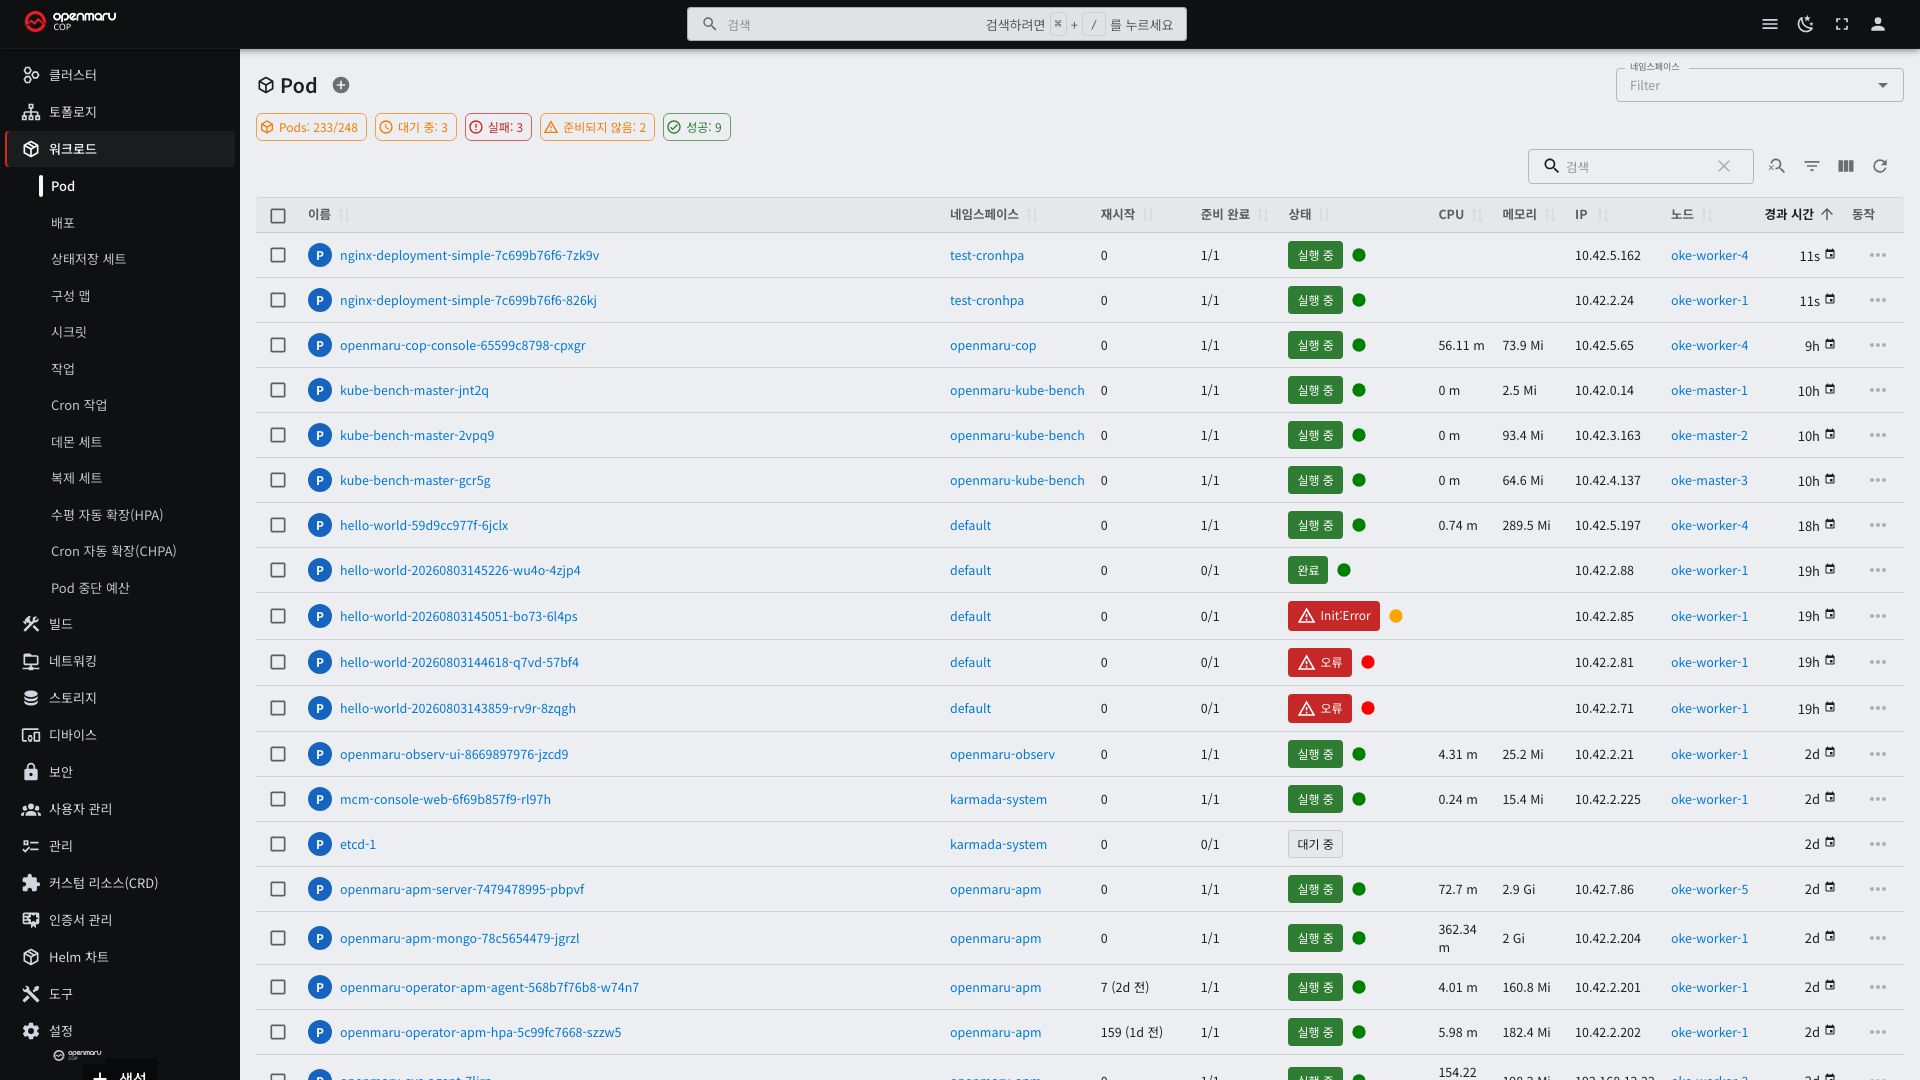
| Column | Description | How to read it |
|---|---|---|
| Name | The pod name | The random string at the end was added by a controller |
| Namespace | The namespace the pod belongs to | |
| Restarts | How many times the container has restarted | Anything other than 0 means it terminated at least once |
| Ready | Ready containers / total containers | 1/2 means one is not ready yet |
| Status | The current run state | See below |
| CPU · Memory | The amount currently in use | Close to the limit suggests a performance problem |
| IP | The pod's internal address | It changes when the pod is recreated |
| Node | The node the pod is scheduled on | If only one node's pods have problems, suspect the node |
| Age | Time elapsed since creation | Tells you whether it restarted recently |
Reading Statuses
| Status | Meaning | What to check |
|---|---|---|
| Running | Running normally | Nothing |
| Succeeded | Finished its work and exited normally | Nothing (normal for a Job) |
| Pending | Waiting to be scheduled | Node resource shortage, whether volumes are ready |
| ContainerCreating | Creating the container | If it lingers, check image download or volume attachment |
| Failed | Failed to run | Logs and events |
| CrashLoopBackOff | Repeatedly starting and stopping | Logs. Usually a configuration error or a dependency that has not started |
| ImagePullBackOff | Could not fetch the image | Image name, registry credentials |
| Terminating | Being deleted | If it lingers, termination handling is blocked |
The BackOff in CrashLoopBackOff means the retry interval is being widened. On continued failure, Kubernetes
widens the interval to 10 seconds, 20 seconds, 40 seconds, and so on, up to five minutes. It is a mechanism to keep
endless restarts from consuming the node.
A restart count that keeps rising means the container is terminating repeatedly. Check the logs first.
The Pod Lifecycle
A pod goes through several stages between creation and receiving traffic. Knowing where it stopped narrows the cause.
| Order | Stage | If it stops here |
|---|---|---|
| 1 | Scheduling — deciding which node to place it on | Resource shortage, node selection conditions, taints |
| 2 | Volume attachment | The PVC is not ready (see 6.1) |
| 3 | Image download | Typo in the image name, registry authentication |
| 4 | Container start | Command error, missing required environment variable |
| 5 | Passing the readiness probe | The application is still starting, or the probe path is wrong |
Probes
A container being up and being ready to work are different. The process may have started but still be reading configuration or unable to connect to the database.
Kubernetes cannot tell this by looking inside the container. So it asks the application directly. That way of asking is a probe.
Three Probes
| Probe | What it asks | If it fails |
|---|---|---|
| readiness | "Can you take requests right now?" | No traffic is sent. It is removed from the Service endpoints |
| liveness | "Are you alive?" | The container is restarted |
| startup | "Has startup finished?" | It restarts. Until it finishes, the other two probes are deferred |
The readiness probe is the key mechanism for zero-downtime deployment. A new pod takes no traffic until it is ready, so requests do not fail during a deployment (see 5.1).
The startup probe is for applications that take a long time to start. For example, if a Java application that takes three minutes to start has only a liveness probe, it is judged unresponsive while still starting and is restarted over and over. A startup probe defers the liveness probe during that time.
Probe Methods
| Method | How success is judged | Where it is used |
|---|---|---|
| HTTP GET | Calls the given path and succeeds if the response code is 200-399 | Web applications. The most common |
| TCP socket | Succeeds if it can connect to the given port | Non-HTTP servers (databases and so on) |
| Command execution | Runs a command inside the container and succeeds if the exit code is 0 | When the first two cannot decide |
When using HTTP GET, it is better to have a dedicated path. Using a real service path fills the logs with probe requests, and if that path calls the database, the pod also restarts whenever the database slows down.
Tuning Values
You can see each probe's settings on the pod detail.
| Value | Meaning | Default |
|---|---|---|
| delay | How long to wait after the container starts before the first probe | 0 seconds |
| period | The probe interval | 10 seconds |
| timeout | How long to wait for a response | 1 second |
| success | How many consecutive successes count as success | 1 |
| failure | How many consecutive failures count as failure | 3 |
In the Console these values appear as delay = 10s, period = 10s, failure = 3.
The actual time until action is the combination of these values.
Time to first probe = delay
Time to failure verdict = delay + (period × failure)
For example, with delay = 10s, period = 10s, and failure = 3, a restart is triggered 40 seconds after the
container starts.
When Probe Settings Cause Problems
Probes exist to help, but set wrong they keep killing healthy pods.
| Symptom | Cause | Remedy |
|---|---|---|
| Restarts repeat but there are no errors in the log | The liveness probe is too strict | Increase delay and failure, or add a startup probe |
| A slow-starting app keeps restarting | delay is shorter than the startup time | Use a startup probe |
The pod is Running but no traffic arrives | The readiness probe is failing | Check that the probe path and port are right |
| It restarts only under heavy load | timeout is short and slow responses count as failures | Increase timeout |
| The app restarts whenever the database slows down | The probe path calls the database | Provide a separate path for probes |
Do not put a database connection check in the liveness probe. If the database slows down briefly, every pod restarts at once and the situation gets worse. Such checks are safer in the readiness probe — traffic pauses briefly but nothing restarts.
Which Probes to Use
| Situation | Recommendation |
|---|---|
| Web service | A readiness probe is essential. Keep the liveness probe generous |
| Slow startup | Add a startup probe |
| Batch work (Job) | Usually not needed |
| You do not know which to use | Use only a readiness probe. A liveness probe is optional |
Without a liveness probe you cannot revive a hung process, but in most cases the container ends when the process ends and Kubernetes restarts it. No liveness probe is better than a badly set one.
How to Configure It — YAML
Write each probe type into the container spec.
      containers:
        - name: app
          image: registry.example.com/my-app:1.0
          ports:
            - name: http
              containerPort: 8080
          startupProbe:                  # has startup finished — the two below begin only after this passes
            httpGet:
              path: /health/startup
              port: http
            periodSeconds: 10
            failureThreshold: 30         # 10 seconds x 30 = waits up to five minutes
          readinessProbe:                # may it take traffic
            httpGet:
              path: /health/ready
              port: http
            periodSeconds: 10
            timeoutSeconds: 3
            failureThreshold: 3
          livenessProbe:                 # is it alive
            httpGet:
              path: /health/live
              port: http
            periodSeconds: 20
            timeoutSeconds: 3
            failureThreshold: 3
| Field | In the table above | Description |
|---|---|---|
initialDelaySeconds | delay | How long to wait before the first probe |
periodSeconds | period | The probe interval |
timeoutSeconds | timeout | How long to wait for a response |
failureThreshold | failure | How many consecutive failures count as failure |
successThreshold | success | How many consecutive successes count as success |
You can use a name in port. Naming the containerPort as in the example above means you do not have to edit
probe settings when the port number changes.
With a startup probe you do not need initialDelaySeconds to buy time. It suits applications with variable
startup times particularly well — if they start quickly they pass quickly, and if they take longer it waits
periodSeconds x failureThreshold.
Non-HTTP servers use other methods.
          readinessProbe:
            tcpSocket:                   # only checks whether the port is open
              port: 5432
          livenessProbe:
            exec:                        # succeeds if the command exit code is 0
              command: ["sh", "-c", "pg_isready -U postgres"]
Pod Detail
Selecting a name in the list opens the detail screen.
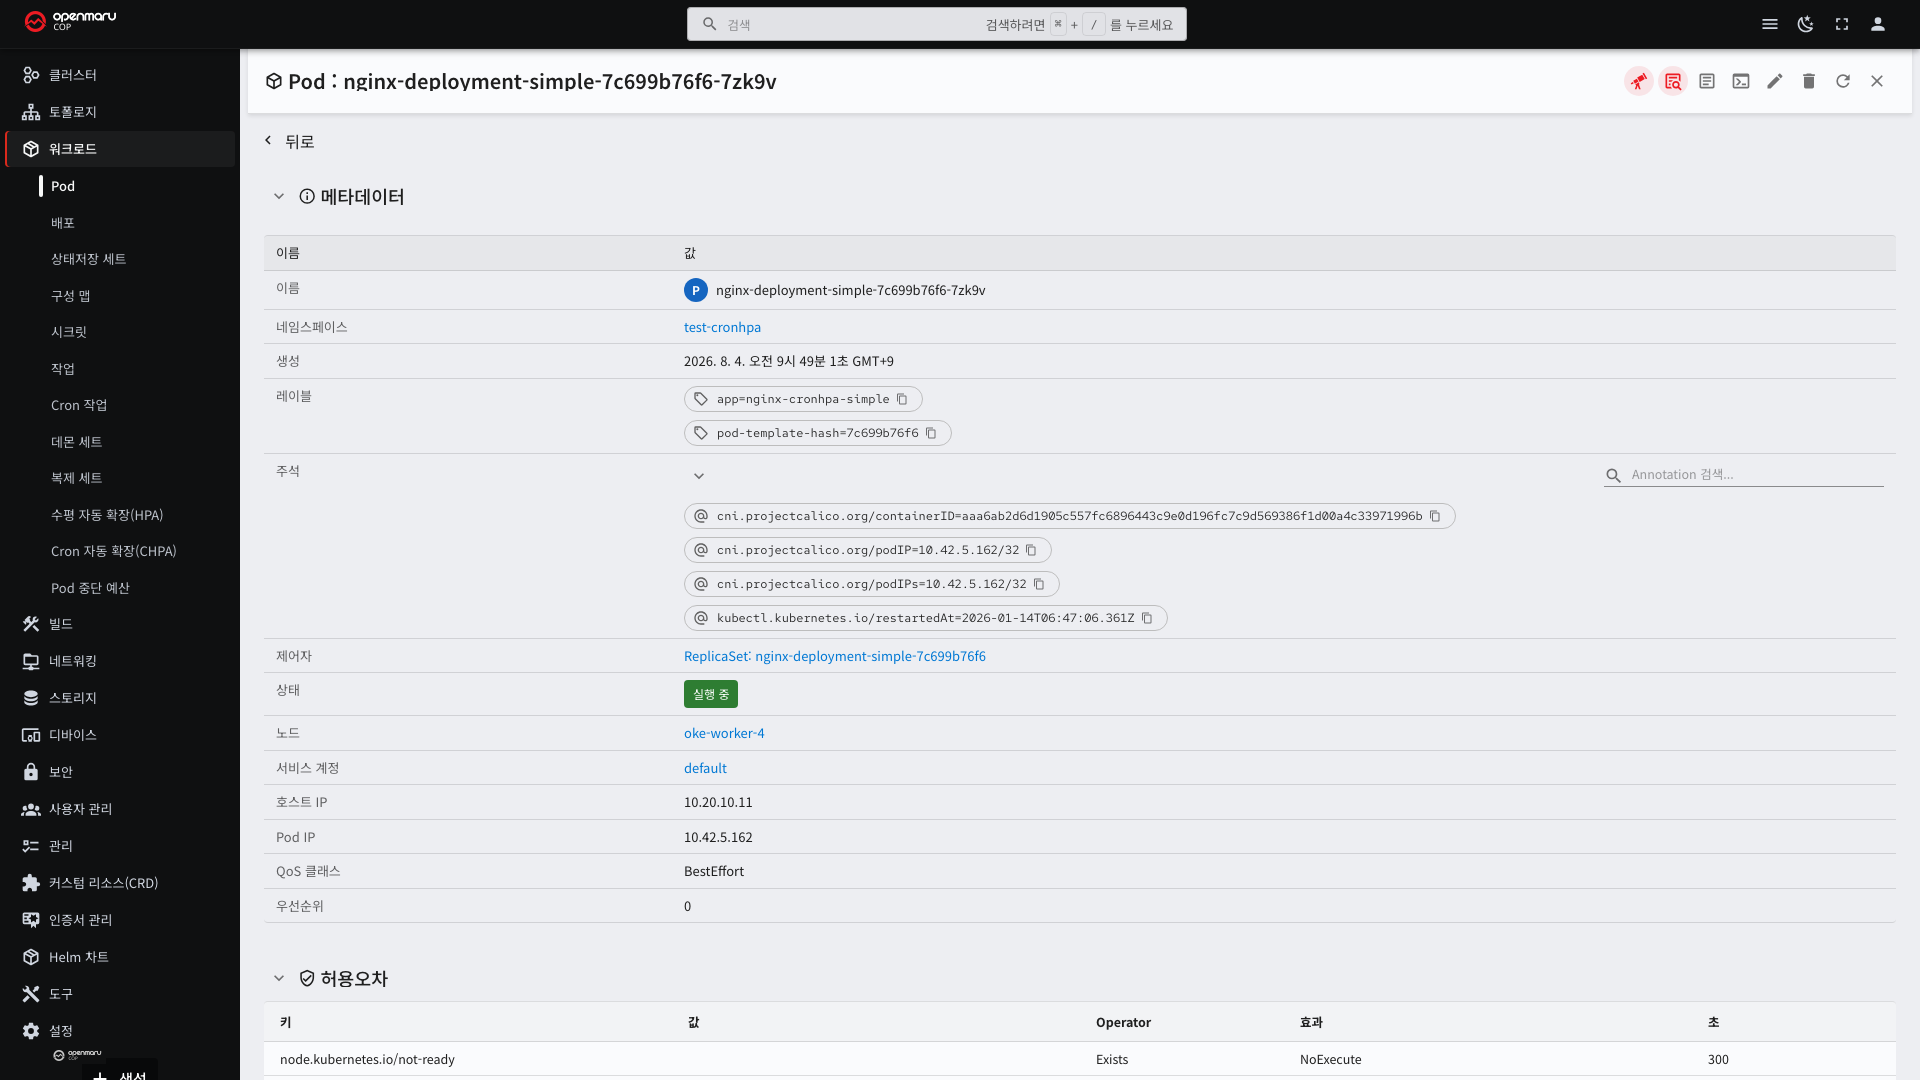
| Item | What it tells you |
|---|---|
| Labels | The criteria a Service uses to select this pod (see 5.1) |
| Annotations | Information left by deployment tools, such as the last restart time |
| Owner | The parent resource that created this pod. Select it to trace back |
| Status | The current run state |
| Node | The node it is scheduled on. Select it to check node status |
| Service account | The account this pod uses to call the cluster API (see 7.1) |
| Host IP · Pod IP | The node address and the pod address |
| QoS class | The order in which it is evicted when resources run short |
Scrolling down shows per-container information.
| Item | Description |
|---|---|
| Image | The running container image and tag |
| Status | Per-container run state and the last termination reason |
| Environment variables | Injected configuration values. Those from ConfigMaps and Secrets are shown too |
| Mounts | Attached volumes and paths |
| Requests and limits | The requested CPU and memory, and the limits |
Pay attention to the last termination reason. OOMKilled means it was killed for exceeding the memory limit;
Error means the application ended with an error.
Resource Requests and Limits
Each container can set two values: a request and a limit. The names are similar, but they apply at different times and to different things.
| Value | Meaning | When it applies |
|---|---|---|
| Request | This much must be guaranteed | When deciding which node to schedule the pod on |
| Limit | It cannot use more than this | While the pod is running |
Requests Reserve a Place
When scheduling a pod, Kubernetes adds up the requests to calculate the room left on a node. It does not look at actual usage.
If a node with 8 CPU cores holds three pods requesting 2 cores each, then even if those pods actually use only 0.1
core, the node is calculated as having only 2 cores left. A pod requesting 4 cores is not scheduled and waits in
Pending.
Conversely, setting no request reserves no place. Scheduling becomes easier, but with no guaranteed share the pod is evicted first when the node gets crowded (see QoS classes below).
Limits Restrain at Runtime
What happens when a limit is exceeded differs between CPU and memory.
| Resource | When the limit is exceeded |
|---|---|
| CPU | It slows down. It is restricted (throttled) to the limit but is not killed |
| Memory | It is killed. The container ends as OOMKilled and starts again |
CPU can simply be shared for a while, whereas memory already taken cannot be reclaimed. If OOMKilled repeats, raise
the limit or reduce the application's memory use.
Reading the Values
CPU is written in cores and memory in byte sizes.
| Notation | Meaning |
|---|---|
2 or 2000m | 2 CPU cores. m is 1/1000, so 500m is 0.5 core |
1.5Gi | 1.5 gigabytes of memory |
512Mi | 512 megabytes of memory |
What Happens If You Set Only One
| What you set | Result |
|---|---|
| Request only | With no limit, it uses as much as the node has spare |
| Limit only | The request is filled in automatically with the same value as the limit |
| Both | Exactly as set |
| Neither | It reserves no place and has no restriction |
The important point is that setting only a limit still creates a request. The application charts COP provides are
like this — they set only limits of cpu: "2" and memory: 1.5Gi, so the requests become the same values. Such a
pod occupies 2 cores on the node regardless of actual usage.
In the Console, check Requests and limits under the container section of the pod detail. If the two values are the same, either only the limit was set or they were deliberately made equal.
What Values to Use
| If too small | If too large | |
|---|---|---|
| Request | It is evicted when the node gets crowded | Few pods fit on a node and resources sit idle |
| Limit | CPU slows down and memory is killed | One pod uses up the node and affects other pods |
Measure actual usage first, then decide. The Console's pod list shows current CPU and memory usage, and the monitoring screen shows change over time (see 9.2). Taking typical usage as the request and the peak as the limit is a starting point.
Java applications have to be set together with the heap size. If the heap is 512MB and the memory limit is also 512MB, the areas outside the heap (metaspace, thread stacks) push it over the limit and it is killed. Set the limit comfortably above the heap.
QoS Classes
This is the grade that decides which pods are pushed out first when resources run short. You do not specify it; it is determined automatically from the resource settings.
| Class | Condition | On resource shortage |
|---|---|---|
| Guaranteed | Every container's request equals its limit | Evicted last |
| Burstable | Only requests are set, or requests differ from limits | In between |
| BestEffort | Neither requests nor limits | Evicted first |
If an important application is BestEffort, it is terminated first when resources run short. Specify requests.
Guaranteed is the most stable but holds resources equal to the requests at all times, which lowers cluster density.
Burstable suits most cases.
Finding the Cause Through Events
The events at the bottom of the detail screen tell you the cause of a problem fastest. When a pod will not start, look here before the logs.
Logs exist only after the container starts, whereas events also record the pre-start stages (scheduling failure, image download failure, volume attachment failure).
| Reason | Meaning | Remedy |
|---|---|---|
| FailedScheduling | Could not find a node to place it on | Check node resources, node selection conditions, taints |
| Failed / ErrImagePull | Could not fetch the image | Check the image name and registry credentials |
| Unhealthy | A probe failed | Check that the application responds on the probe path |
| BackOff | The retry interval was widened after repeated failures | Resolve the root cause first |
| FailedMount | Could not attach a volume | Check the PVC status (see 6.1) |
| Evicted | Pushed out due to node resource shortage | Check the QoS class and node headroom |
Viewing Logs
Select the logs button at the top right of the detail screen.
| Feature | Description | When to use it |
|---|---|---|
| Container selection | Chooses which container to view when the pod has several | Pods with sidecar containers |
| Auto-refresh | Follows the screen down as new logs appear | When watching what is happening now |
| Line count | Sets how many lines to fetch | Reduce it when many logs make it slow |
| Previous container | The log of the container before it restarted | Pods that restart repeatedly |
| Timestamps | Adds a time to each line | When aligning with other records |
| Download | Saves the log to a file | When sharing or searching |
If a pod restarts repeatedly, the current log is often empty and the cause is left in the previous container log.
Logs contain only the container's standard output. If the application writes only to files, nothing appears here. Logs of deleted pods cannot be viewed, so use the monitoring screen if you need them (see 9.2).
The Web Terminal
Selecting the terminal button lets you run commands inside the container.
It is used in situations like these.
| What to check | How |
|---|---|
| Whether the configuration file is attached properly | Look at the file at the mount path |
| Whether it connects to another service | Call it with curl or nc |
| Whether environment variables arrived | Print the environment variables |
| Whether the process is running | Look at the process list |
There are cautions.
- You cannot connect if the container has no shell. Minimal images often have none.
- Files created here disappear when the pod restarts.
- Editing configuration directly in a running pod is reverted on the next deployment. Use it only for temporary checks, and make real changes through a ConfigMap or the deployment definition (see 3.4).
Common Problems and Remedies
| Symptom | Where to look first | Common cause |
|---|---|---|
| Stuck in Pending | Events | Node resource shortage, PVC not ready |
| CrashLoopBackOff | Previous container log | Configuration error, missing required environment variable, dependency not started |
| ImagePullBackOff | Events | Typo in the image tag, missing registry credentials |
| Running but unresponsive | Probe settings, logs | The application is still getting ready, port mismatch |
| Restarts repeat with no errors in the log | Liveness probe settings | The probe is too strict |
| It keeps getting evicted | QoS class, node resources | Requests not set (BestEffort) |
| OOMKilled | Container status, memory limit | The limit is below actual usage |