3.5. Autoscaling
When to Look at This
- When a service slows down during peak hours
- When resources are wasted during quiet hours
- When you want the service to stay up during node maintenance
Why Automatic Scaling Is Needed
Increasing the pod count by hand when load rises is too slow to respond. Conversely, leaving many pods up during quiet hours wastes resources.
COP provides two automatic scaling methods.
| Method | Basis | Response |
|---|---|---|
| HPA | Current CPU and memory utilization | Scales up after load rises |
| CronHPA | A set time | Scales up before load rises |
HPA
HPA (HorizontalPodAutoscaler) looks at utilization and increases or decreases the pod count.
Go to Workloads > HPAs.
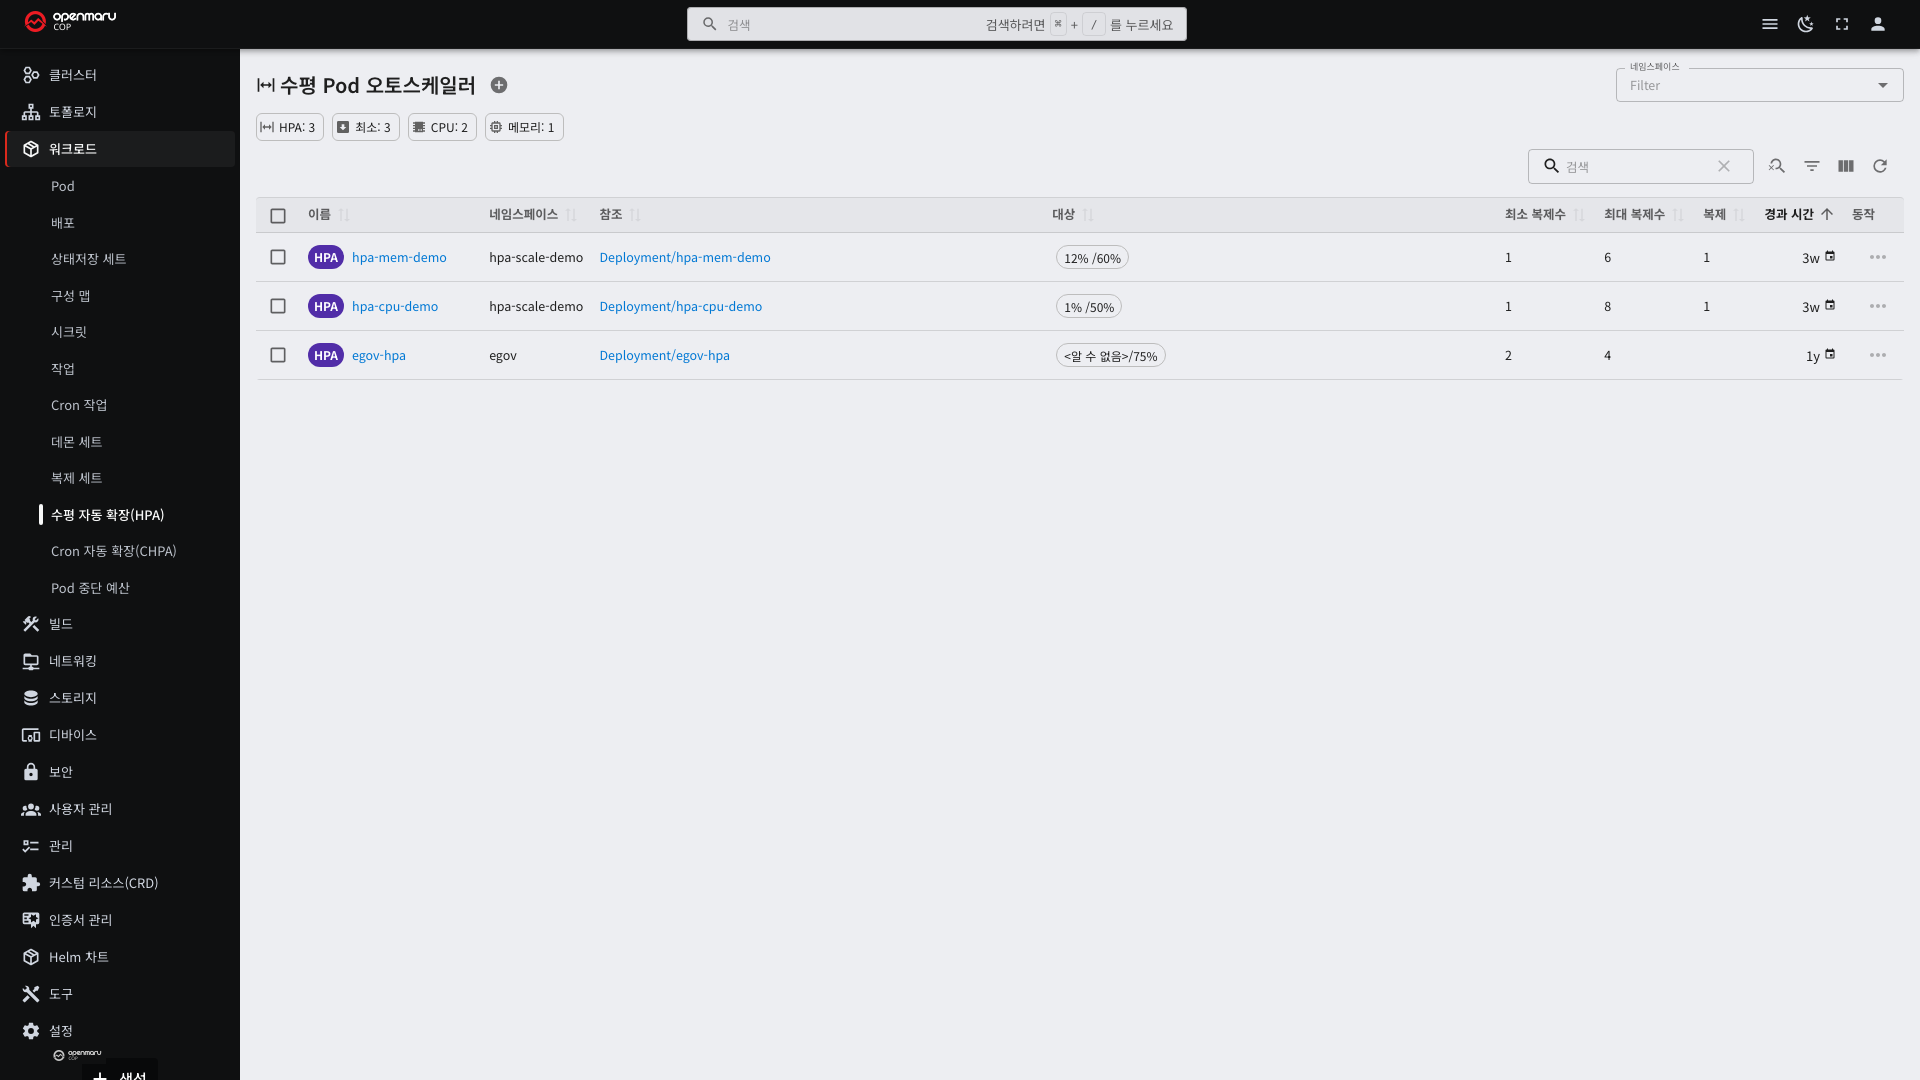
| Column | Description |
|---|---|
| Name | The HPA name |
| Target | The Deployment or other resource to scale |
| Min · Max | The lower and upper bounds of the pod count |
| Replicas | The current pod count |
| Metrics | Current utilization / target utilization |
It works like this.
- Measures the average utilization of the target pods.
- Compares it with the target utilization.
- Calculates
required pods = current pods × (current utilization ÷ target utilization). - Adjusts within the minimum and maximum range.
For example, if two pods average 80% and the target is 50%, then 2 × (80 ÷ 50) = 3.2, so it scales to 4.
It moves more slowly when scaling down than up. Scaling down the moment load dips would only require scaling up again, so it scales down only after utilization stays low for a while.
HPA Requires Resource Requests
The target pods must have resource requests configured before you attach an HPA. Without them, the HPA does nothing. This is the most common reason an HPA does not work.
Why It Is Needed
The "utilization" in the formula above is a ratio against the request. It is not against total node capacity or against the limit.
utilization = actual usage ÷ request × 100
The request is the denominator. Without a request there is no denominator, so utilization cannot be computed at all,
and the metrics column of the HPA list stays at <unknown>.
What requests and limits are, and how to set them, is in 3.1. Here we only look at how the HPA uses those values.
Worked Example — the COP Sample Application
Let us follow the actual settings of the e-government sample application that COP provides.
| Item | Value |
|---|---|
| CPU limit | 2 (2 cores) |
| CPU request | Not set separately, so it is filled in automatically as 2, the same as the limit (see 3.1) |
| HPA minimum pods | 2 |
| HPA maximum pods | 4 |
| HPA target utilization | 75% |
Here, a 75% target means "each pod averages 1.5 cores".
2 cores (request) × 75% = 1.5 cores
Suppose two pods are each using 1.8 cores.
| Step | Calculation |
|---|---|
| Current utilization | 1.8 ÷ 2 × 100 = 90% |
| Required pods | 2 × (90 ÷ 75) = 2.4, rounded up to 3 |
| Check against the maximum | 3 is within the maximum of 4, so it stays at 3 |
After scaling up, the same load is divided among three pods, giving 1.2 cores each and 60% utilization, which is below the target. If load keeps rising it grows to 4, and if 4 pods still exceed 90% it grows no further. At that point you have to raise the maximum or find another bottleneck.
What Happens If the Request Is Wrong
The request is both the value used for scheduling and the denominator for the HPA. Because one value decides two things, getting it wrong throws both off together.
| Request | Effect on scheduling | Effect on the HPA |
|---|---|---|
| Larger than reality | Few pods fit on a node | Utilization reads low, so it does not scale up when it should |
| Smaller than reality | It is evicted when crowded | Utilization reads high, so it scales up when it need not |
| Absent | It reserves no place | The HPA does not work |
For example, if the request is 2 cores but the application actually uses only 0.2 core, then even when load jumps fivefold to 1 core, utilization is 50% and falls short of the 75% target, so pods do not increase. On screen it looks like "the HPA is fine but the service is slow".
Measure actual usage first, set the request, and then attach the HPA. In the other order, no amount of tuning the target utilization makes it fit.
Scaling on Memory
You can also scale on memory utilization, but it does not fit as well as CPU. Runtimes that reserve a heap in advance, such as Java, do not reduce memory usage even when idle, so utilization does not drop as you add pods. It then keeps scaling to the maximum.
It is better to set memory limits properly and base automatic scaling on CPU.
Creating One — YAML
apiVersion: autoscaling/v2
kind: HorizontalPodAutoscaler
metadata:
  name: my-app-hpa
  namespace: my-app
spec:
  scaleTargetRef:
    apiVersion: apps/v1
    kind: Deployment
    name: my-app
  minReplicas: 2
  maxReplicas: 10
  metrics:
    - type: Resource
      resource:
        name: cpu
        target:
          type: Utilization
          averageUtilization: 75      # 75% of the request
| Field | Description |
|---|---|
scaleTargetRef | The target to scale. A wrong name leaves the metric at <unknown> |
minReplicas | The floor. 2 or more is recommended — with 1, the service can be interrupted during scaling |
maxReplicas | The ceiling. Set it to what the cluster can bear |
averageUtilization | The target utilization. Based on the request (see the section above) |
If it moves up and down too often, tune the response speed.
  behavior:
    scaleDown:
      stabilizationWindowSeconds: 300   # scales down only after five minutes of low load
    scaleUp:
      stabilizationWindowSeconds: 0     # scales up immediately
The trick is to slow down only the scaling-down side. Scaling down the moment load dips means scaling up again soon after, so pods keep oscillating.
When HPA Does Not Work
If the metrics column shows <unknown>, usage cannot be read.
| Cause | What to check |
|---|---|
| The target pods have no resource requests | The most common cause. Look at the requests and limits on the pod detail (see the section above) |
| The metric collector is not running | Ask operations staff |
| The target name is wrong | Whether the target on the detail screen matches the actual Deployment name |
| The pods just started | It takes about a minute for the first measurements to accumulate. Look again shortly |
Numbers appearing but pods not increasing has a different cause than <unknown>.
| Symptom | Cause |
|---|---|
| Utilization only ever reads below the target | The request is set larger than reality (see the section above) |
| It sits at the maximum | The maximum pod count is too low, or the bottleneck is elsewhere |
It scaled up but stays in Pending | There is no room in the cluster. Check node resources (see 2.1) |
If it is slow even at the maximum, the problem is not the pod count. The database or an external integration may be the bottleneck, so check the monitoring screen (see 9.2).
CronHPA
CronHPA changes the pod count based on time. Use it to prepare before load rises.
View it under Workloads > CronHPAs.
The schedule notation differs from CronJob. CronJob uses five fields, while CronHPA uses six, including seconds. Using the notation from 3.3 as is shifts every field by one.
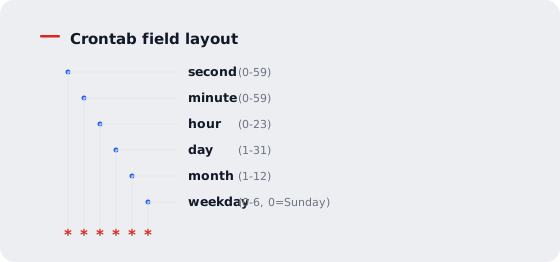
| Symbol | Meaning | Example |
|---|---|---|
* | Every value | 0 0 * * * * = on the hour |
/ | Interval | 0 */10 * * * * = every 10 minutes |
, | List | 0 0 9,18 * * * = at 09:00 and 18:00 |
- | Range | 0 0 9-18 * * * = hourly from 09:00 to 18:00 |
There are also notations that can be used in place of a fixed schedule.
| Notation | Meaning |
|---|---|
@hourly · @daily · @weekly · @monthly · @yearly | On the hour · daily at midnight · Sunday at midnight · the 1st of each month at midnight · January 1 at midnight |
@every 1h30m | Every 1 hour 30 minutes |
@date 2026-12-25 09:00:00 | Once, at that date and time |
@date is a non-repeating schedule. Use it for events and occasions with a fixed date.
When to Use It
| Situation | Why CronHPA |
|---|---|
| Load concentrates only during business hours | Scale up before people arrive. HPA only moves after load arrives |
| Startup takes a long time | If a Java application takes minutes to start, HPA is already too late |
| Times are fixed, as with settlement or closing | Scale up for the end of each month or the nightly batch window |
| You want to reduce resources at night and on weekends | Reduce to 0 or 1 at night in development and staging to save resources |
| An event date is fixed | Specify start and end times with @date |
| Load cannot be read from metrics | Load that does not show in CPU or memory, such as queue depth |
CronHPA fills the gaps where HPA does not fit well. HPA reacts after load rises, so in a sudden surge it scales up only after things have already slowed.
Basic Use — Scaling for Business Hours
This is the most common form. Scale up during weekday business hours and down afterwards.
apiVersion: autoscaling.openmaru.io/v1
kind: CronHPA
metadata:
  name: app-cronhpa
  namespace: my-app
spec:
  scaleTargetRef:
    apiVersion: apps/v1
    kind: Deployment
    name: my-app
  jobs:
    - name: scale-up-morning
      schedule: "0 50 8 * * 1-5"     # weekdays at 08:50:00
      targetSize: 10
    - name: scale-down-evening
      schedule: "0 0 20 * * 1-5"     # weekdays at 20:00:00
      targetSize: 3
    - name: weekend-minimum
      schedule: "0 0 0 * * 6"        # Saturday at 00:00:00
      targetSize: 2
| Field | Description |
|---|---|
scaleTargetRef | The target to scale. Write all three of apiVersion, kind, and name |
jobs | The schedule list. At least one is required |
jobs[].name | A name unique within this CronHPA. It appears under this name on the status screen |
jobs[].schedule | When to run |
jobs[].targetSize | The pod count to set at that time. 0 is allowed |
targetSize is not "how many to add" but "how many to end up with". It sets that value regardless of the current
pod count.
The target can be any resource that supports scale. Deployments, StatefulSets, and ReplicaSets can be used.
Using It Together With HPA
Pointing CronHPA at an HPA rather than a Deployment lets you use both together. In that case CronHPA does not change the pod count directly; it adjusts the HPA's minimum and maximum pod counts.
apiVersion: autoscaling.openmaru.io/v1
kind: CronHPA
metadata:
  name: app-cronhpa-with-hpa
  namespace: my-app
spec:
  scaleTargetRef:
    apiVersion: autoscaling/v1
    kind: HorizontalPodAutoscaler    # points at the HPA, not the Deployment
    name: my-app-hpa
  jobs:
    - name: peak-hours
      schedule: "0 50 8 * * 1-5"     # weekdays 08:50 — raises the floor to 5
      targetSize: 5
    - name: off-hours
      schedule: "0 0 20 * * 1-5"     # weekdays 20:00 — lowers the floor to 2
      targetSize: 2
It behaves like this.
| Time | What CronHPA does | What the HPA then does |
|---|---|---|
| 08:50 | Raises the HPA minimum pod count to 5 | Scales up to the maximum on its own if load rises further |
| 20:00 | Lowers the HPA minimum pod count to 2 | Scales down to 2 if load is low |
Time sets the floor, and above that the HPA adjusts based on actual load. CronHPA takes the predictable part and the HPA takes the unpredictable part.
If targetSize exceeds the current maximum pod count, the maximum is raised along with it. Entering a value beyond
the maximum does not fail.
Running Only Once
Adding runOnce: true makes that schedule run once and disappear from the list.
  jobs:
    - name: one-time-scale-up
      schedule: "0 0 9 * * *"
      targetSize: 10
      runOnce: true
Combined with @date, it can match an event on a particular date.
  jobs:
    - name: event-start
      schedule: "@date 2026-10-03 00:00:00"
      targetSize: 20
    - name: event-end
      schedule: "@date 2026-10-09 00:00:00"
      targetSize: 3
Skipping Particular Dates
On dates listed in excludeDates, no schedule runs at all. Use it to stop scaling on holidays and weekends.
spec:
  scaleTargetRef:
    apiVersion: apps/v1
    kind: Deployment
    name: my-app
  excludeDates:
    - "* * * * * 6"      # every Saturday
    - "* * * * * 0"      # every Sunday
    - "* * * 1 1 *"      # January 1
    - "* * * 25 12 *"    # December 25
  jobs:
    - name: scale-up
      schedule: "0 50 8 * * *"
      targetSize: 5
    - name: scale-down
      schedule: "0 10 18 * * *"
      targetSize: 1
excludeDates also uses cron notation. It is not a date format such as 2026-01-01. In the six-field notation,
specify only the date fields and leave the rest as *.
On excluded dates it neither scales up nor down. In the example above, after scaling down to 1 at 18:10 on
Friday, nothing happens on Saturday or Sunday, so it stays at 1 until 08:50 on Monday. If you need a minimum count on
weekends too, add a separate weekend schedule instead of using excludeDates.
Checking Status
View per-schedule status on the CronHPA detail screen in the Console.
| Status | Meaning |
|---|---|
Submitted | Registered and waiting for the next run |
Succeed | The last run succeeded |
Failed | The last run failed. The reason is shown with it |
Each schedule shows its last run time and next scheduled run time. If they differ from what you intended, check the time zone item below.
Cautions
| Item | Content |
|---|---|
| Number of schedule fields | Six. Using CronJob notation (five fields) shifts the fields and runs at the wrong time |
| Time zone | It follows the controller's time zone. COP installs with Asia/Seoul by default. If installed with another time zone, schedule times follow that |
targetSize: 0 | Entering 0 takes all pods down and stops the service. Use it only to save resources at night in development and staging |
| Always include a schedule that restores the count | With only a scale-up schedule, it stays in that state |
| A hand-set pod count is overwritten at the next schedule | Even if you change the replica count in the Console, it returns to targetSize at the next run time |
| Attaching it directly to a Deployment conflicts with an HPA | To use both, point it at the HPA (see above) |
| Do not set beyond the cluster's headroom | If the added pods sit in Pending, the situation only gets worse |
VPA
Where HPA and CronHPA change the number of pods, VPA adjusts the size of a single pod. It watches how much a workload actually uses and tells you the right resource requests, or applies them depending on the setting.
You find it under Workloads > Vertical Pod Autoscalers (VPA).
Being installed alone changes nothing. You must create a VPA that names a target before anything happens to that workload.
When to Use It
| Situation | Why VPA |
|---|---|
| You do not know what request values to set | It calculates them from actual usage, doing the work described in "Resource Requests" above for you |
| Generous values are tying up the node | It reduces them to what is actually needed, freeing room for other workloads |
| The load pattern has changed | It tells you values that match current usage |
| The workload cannot be scaled out | For something like a database where adding replicas is hard, growing the pod is the right move |
VPA fills the gap that counting pods cannot close. If a single pod cannot handle the amount itself, adding more pods leaves each one short.
Which Workloads Fit Well
Workloads that adding replicas does not fix, or that are hard to replicate at all.
| Workload | The situation |
|---|---|
| Databases | Queries grew and it got slow. Even with two pods, writes still land on one of them. Giving that one more memory is the answer |
| Cache servers | You need to hold 5Gi but gave the pod 2Gi. Scaling to four pods still means 2Gi each, so it is still short |
| Java applications | Started with -Xmx2g while the container memory limit is 1Gi. The moment the heap fills, the container is killed (OOMKilled). Pod count is irrelevant |
| ML inference servers | The model file is 4Gi. Every pod loads the whole thing, so each one needs 4Gi |
| Batch jobs | Month-end settlement processes five times the usual volume. Size it for normal days and it dies at month end; size it for month end and it idles all month |
| Pods with sidecars | The application needs 2Gi while the log-collector sidecar is fine with 64Mi. One blanket value is guaranteed to get one of them wrong |
There is one test that separates them. Ask whether adding one more pod solves the problem. If it does, use an HPA; if it does not, use a VPA. Load that is slow because requests pile up gets shared across more pods, but something dying for lack of memory dies on every pod you add.
Set per-container caps when sidecars are present. A recommendation applied uniformly to every container either oversizes the sidecar or undersizes the main container. Use
containerPoliciesto set them separately.
How Far Off Are Values in Practice
"Hard to pick a value" is not an abstract claim. These are measurements from a test cluster.
| State | Count |
|---|---|
| Both requests and limits left empty | 31 |
| Requests only left empty | 33 |
| Limits only left empty | 10 |
| (Total Deployments) | 151 |
Values that were filled in often do not match reality either. Over-provisioned and under-provisioned workloads coexist in the same cluster.
| Direction | Measured example |
|---|---|
| Over-provisioned | requests 4000m but 7m in use (0.2%) · requests 2000m but 6m (0.3%) |
| Under-provisioned | requests 50m but 459m in use (918%) · requests 1000m but 3105m (310%) |
Over-provisioning ties up node capacity so other pods cannot be placed; under-provisioning makes the scheduler miscalculate free capacity and throttles CPU. VPA sets these values from observation.
A Safe Way to Start
- Attach it with
Offand watch for a few days. It collects recommendations without touching pods. - Check whether the recommendations match normal usage. Include a peak day.
- Apply it to less critical workloads first.
- Set
maxAllowedto keep recommendations from growing too far. - Leave production workloads for last, and confirm you can use the restart-free mode before applying.
Leave it at
Offfor workloads that already have an HPA. Two controllers aiming at the same resource make the values oscillate. Take the recommendations and apply them yourself.
Getting Recommendations Only
This is the safest start. It does not touch pods at all and only tells you the right values.
apiVersion: autoscaling.k8s.io/v1
kind: VerticalPodAutoscaler
metadata:
  name: my-app-vpa
  namespace: my-namespace
spec:
  targetRef:
    apiVersion: apps/v1
    kind: Deployment
    name: my-app          # target workload
  updatePolicy:
    updateMode: "Off"     # tell only, change nothing
Values do not appear immediately. Usage has to be observed for a while, so it is normal for the field to be empty at first. Look again after a few minutes.
Reading the Recommended Values
The list shows CPU and memory recommendations. Clicking the name opens the details, where you see four values per container.
| Value | Meaning |
|---|---|
| Lower Bound | Below this it may fall short |
| Target | The value to actually go by |
| Upper Bound | There is no reason to set it higher than this |
| Uncapped Target | What the recommendation would have been without minimum and maximum limits |
The lower and upper bounds are the span of observed usage, not values an operator set. When the observation period is short the upper bound can be very large; it narrows over time.
If the target and the uncapped target differ, a limit you set is capping the recommendation.
Target: cpu 500m Uncapped Target: cpu 763m ← capped by your limit
The workload actually needs 763m but you capped it at 500m. Decide whether to raise the cap or whether
the restraint was intentional. With no limit set, the two values are the same.
Applying Them
To act on the recommendation, change updateMode.
| Value | Behaviour |
|---|---|
Off | Tells only. Does not touch pods |
Initial | Applies only when a pod is newly created |
Recreate | Recreates the pod when the gap is large. Causes a brief interruption |
InPlaceOrRecreate | Adjusts without recreating; falls back to recreating if that is not possible |
InPlaceOrRecreate adjusts without interrupting the service, which makes it the better choice, but it
has conditions.
- Two or more replicas are required. With only one, no adjustment is made — touching that single pod would interrupt the service.
- The capability is still experimental and is off by default. Ask your installation engineer to enable it.
To confirm it was adjusted without recreating, check that the pod did not come up again while the request values changed.
Cautions
- 🔴 Do not use it together with an HPA on the same resource. See "Cautions When Using Them Together" below.
- Raising requests raises limits by the same ratio. If requests grow fivefold, so do limits. Set
maxAllowedif you do not want that. - If the recommendation exceeds the node's free capacity the pod stays
Pending. SetmaxAllowedhere too. - Do not attach several VPAs to one workload. Which one applies is undefined.
- Pods you created directly (not owned by a Deployment and the like) are not targets.
- Deleting a VPA leaves the already-changed request values in place. Edit the workload to revert them.
Scaling on APM Metrics
By default an HPA looks at CPU and memory. But a service being under strain and CPU being high are different things. When the application waits on an external call or sits on a lock, CPU stays idle while responses get slower.
Once APM is installed, the values APM already measures can drive an HPA. You add the metric name to a standard HPA definition; no extra controller is involved.
When to Use It
- You want to scale out when responses slow down even though CPU is idle
- You want to scale on transaction counts or active user counts
- You want to scale out when errors increase
There is one prerequisite: APM must be installed. Without it these metrics do not appear at all. CPU and memory based HPAs work regardless of APM.
Available Metrics
| Metric name | What it is | Target type |
|---|---|---|
tps | Transactions per second | AverageValue |
activeUser | Active user count | AverageValue |
loginUser | Logged-in user count | AverageValue |
avgRT | Average response time (ms) | Value |
errorRate | Error rate, 0-100 | Value |
apdexDeficit | Response quality deficit (100 - apdex) | Value |
🔴 Choose the target type to match the metric. AverageValue makes Kubernetes divide the
value by the pod count. That suits summed values (tps, activeUser, loginUser), but dividing
a value that is already an average or a ratio (avgRT, errorRate, apdexDeficit) destroys its
meaning. No error is raised — only the number is wrong, which makes it hard to notice.
apdex(satisfaction) appears in the list but cannot be used as a scale-out condition. Higher is better for it, so using it directly would add pods when responses are good. UseapdexDeficitinstead.
Creating One — YAML
This example scales out when average response time exceeds 500 ms.
apiVersion: autoscaling/v2
kind: HorizontalPodAutoscaler
metadata:
  name: my-app-hpa
  namespace: my-namespace
spec:
  scaleTargetRef:
    apiVersion: apps/v1
    kind: Deployment
    name: my-app
  minReplicas: 2
  maxReplicas: 10
  metrics:
    - type: External
      external:
        metric:
          name: avgRT
          selector:
            matchLabels:
              apmAlias: apm1          # which APM server to query
              groupName: my-app-group # group name registered in APM
        target:
          type: Value                 # an average, so do not divide
          value: "500"
Scaling on transactions per second uses a different target type.
    - type: External
      external:
        metric:
          name: tps
          selector:
            matchLabels:
              apmAlias: apm1
              groupName: my-app-group
        target:
          type: AverageValue          # a sum, so divide by pod count
          averageValue: "100"         # each pod handles 100 transactions
apmAlias and groupName are set when APM is installed. Ask your installation engineer if you
do not know them. A wrong alias causes the query to be rejected — it will not silently read values
from another server.
Cautions
- If APM cannot answer, the metric cannot be read. The HPA then leaves the pod count unchanged.
- Gaps with no value are not answered at all. Filling a gap with 0 would read as "the best possible state" and shrink the deployment.
- If the metric name and current value do not appear in the list, check whether APM is installed and whether the alias and group name are correct first.
Choosing Between HPA, CronHPA, VPA, and APM Metrics
| Situation | Recommendation |
|---|---|
| You cannot predict when load will rise | HPA |
| It concentrates at the same time every day (commute hours, settlement times) | CronHPA |
| Warm-up is long, so scaling after load arrives is too late | CronHPA |
| You want to reduce resources at night and on weekends | CronHPA |
| There is an event with a fixed date | CronHPA (@date) |
| CPU is idle but responses are slow | APM metrics (avgRT) |
| You want to judge by transactions or user counts | APM metrics (tps, activeUser) |
| You do not know what request values to set | VPA (start with Off for recommendations only) |
| A single pod cannot handle the amount itself | VPA |
| The workload is hard to scale out | VPA |
| You need both HPA and CronHPA | Point CronHPA at the HPA and use them together (see "Using It Together With HPA" above) |
PodDisruptionBudget
A PodDisruptionBudget sets how many pods may go down at once when pods are moved, for example during node maintenance.
View them under Workloads > Pod Disruption Budgets.
| Setting | Meaning |
|---|---|
| minAvailable | The minimum number of pods that must always remain |
| maxUnavailable | The maximum number of pods that may be down at once |
Set only one of the two. They can be written as a ratio (50%) instead of a count.
Without one, every pod can go down at once during maintenance and interrupt the service. Node maintenance sometimes proceeds without notice, so configure this in advance for important services.
Setting it too strictly stops node maintenance itself. With two replicas and
minAvailable: 2, no pod can be moved and maintenance stalls.
apiVersion: policy/v1
kind: PodDisruptionBudget
metadata:
  name: my-app-pdb
  namespace: my-app
spec:
  minAvailable: 2                   # or maxUnavailable: 1 (only one of the two)
  selector:
    matchLabels:
      app: my-app                   # the labels of the pods to protect
The selector does not point at a Deployment; it selects pod labels. Use the same value as the Deployment's
spec.selector.matchLabels (see 3.2).
If you also use automatic scaling, writing it as a ratio is safer. Written as a count, maintenance is blocked when the pod count drops.
maxUnavailable: 25%
Cautions When Using Them Together
- Do not attach an HPA and a CronHPA separately to the same Deployment. They instruct different values and the pod count oscillates. To use both, point the CronHPA at the HPA (see above).
- 🔴 Do not attach an HPA and a VPA on the same resource (CPU or memory). The HPA watches that resource
to change the pod count while the VPA changes the request for the same resource, so each undoes the other's
decision. They can coexist on different resources (for example HPA on CPU, VPA on memory). When in doubt,
leave the VPA in
Off— that mode changes nothing and never conflicts with an HPA. - Changing the replica count by hand on a target with automatic scaling soon reverts.
- When attaching automatic scaling to a resource managed by ArgoCD, remove the replica count field from the configuration repository. Otherwise ArgoCD reverts the pod count (see 4.7).
- Setting the minimum to 1 can interrupt the service briefly during scaling. 2 or more is recommended.
- Set the maximum within what the cluster can bear. With insufficient resources, the added pods sit in
Pendingand the situation only gets worse.