2.4. CIS Benchmark
When to Look at This
- When you have to report security check results
- When you want to confirm that the cluster configuration meets security standards
- When you need material for an audit
What CIS Is
CIS (Center for Internet Security) is a non-profit organization in the United States that creates and publishes standards for configuring systems securely. There are roughly 100 standards covering operating systems, databases, cloud services, and more, and Kubernetes is one of them.
Because these standards are not created by any one product vendor but agreed jointly by security experts from many organizations, they are accepted as a basis in security audits in many countries.
What the CIS Benchmark Is
The CIS standard for Kubernetes is called the CIS Kubernetes Benchmark. Each item states three things.
| Part | Content |
|---|---|
| What is checked | For example: "whether the API server disallows anonymous access" |
| Why it should be so | Allowing anonymous access lets the cluster be operated without authentication |
| How to fix it | Which item in which configuration file to change, and to what |
COP checks automatically against these standards and shows the results on screen. Nobody has to go through the items one by one.
Why It Is Needed
Kubernetes defaults favor convenience. Several restrictions are relaxed so that it works well right after installation. In a production environment those restrictions have to be reapplied.
The problem is that there are more than 100 items to reapply, and it is hard to know what to change and where. The CIS benchmark provides that list and those methods.
| Without this screen | With it |
|---|---|
| You do not know what to check | The items are fixed |
| You have to connect to each node and read files | You see everything on one screen |
| You build audit material by hand | You use the results as they are |
COP Already Applies It at Installation
There is nothing for you to change. OPENMARU COP builds the cluster with the CIS profile enabled during installation and takes measures in advance so that benchmark items do not fail.
| Configuration item | What is applied |
|---|---|
| CIS profile | Starts the cluster with CIS-standard settings. Kernel values, file permissions, and component settings are adjusted together |
| Pod security | Pod Security Admission is applied, so pods demanding excessive privileges are rejected |
| Audit log | An audit policy is configured to record API server calls |
| Service accounts | Automatic token mounting is turned off for the default accounts in the namespaces that existed at installation (see the note below) |
Pod security really does take effect. A pod demanding more privilege than allowed is not created and raises an error. If a pod you created is rejected, this setting may be the reason (see 3.1).
As a result, the outcome on this screen is mostly passing from the start. What you need to check is not so much whether it passes as whether anything has changed over time.
| When to check again | Why |
|---|---|
| After adding a node | To confirm the profile was applied to the new node |
| After creating a new namespace | See the note below |
| After changing a setting by hand | The measure may have been undone |
| After upgrading the cluster | Defaults may have changed |
| Before a regular audit | Used as reporting material |
Newly Created Namespaces Are Handled Automatically
Blocking automatic service account token mounting also applies to newly created namespaces. There is nothing for you to do.
| When the namespace was created | How it is handled |
|---|---|
| Created at installation | Handled during installation |
| Created later by the product | Handled the moment it is created. Tokens are not attached because this happens before pods start |
| Created by you | Handled automatically within seconds of creation |
The sa-hardening workload runs continuously and watches the Kubernetes API, so it fixes the default account of a
new namespace as soon as it appears. Note that if you apply the namespace and a workload together, the pod can
be created first and still receive a token. The time this takes has been shortened, not removed.
To have every namespace checked once more, restart the workload.
kubectl -n openmaru-kube-bench rollout restart deploy/sa-hardening
Check what was handled in the log.
kubectl logs -n openmaru-kube-bench deploy/sa-hardening --tail=20
Pods That Were Already Running Have to Be Restarted
Whether a token is inserted is decided when the pod is created. So if you created the namespace and started pods first, those pods keep the token until they are started again.
The product does not restart them on its own. Taking down a running workload without notice is not acceptable. Instead, it reports the namespace in the log.
[sa-hardening] Warning: my-app has 3 pods using the default ServiceAccount.
[sa-hardening]          Tokens already mounted are removed only when the pods are started again:
[sa-hardening]          kubectl rollout restart deployment,daemonset,statefulset -n my-app
Run the command shown during your maintenance window.
If Your Application Has to Reach the API Server
Do not use the default account; create a dedicated service account and grant only the permissions it needs. Attaching permissions to the default account gives every pod in that namespace the same permissions.
You can also turn it off per pod. That pod receives no token regardless of the namespace setting.
    spec:
      automountServiceAccountToken: false
What Is Not Checked
The check targets cluster configuration. The following are not covered by this screen.
| Target | Where instead |
|---|---|
| Vulnerabilities in container images | The scan feature of the image registry (Harbor) |
| Vulnerabilities in application code | A separate code analysis tool |
| Whether access permission settings are appropriate | A person decides (see 7.1) |
| Whether network policies are sufficient | A person decides (see 5.1) |
Passing every CIS benchmark item does not mean the application is secure. It means the cluster, as a foundation, meets the standard.
The Four Check Targets
| Target | What is checked | Where it runs |
|---|---|---|
| Control Plane | Run options and file permissions of the API server, scheduler, and controller manager | Management nodes |
| etcd | Access control and encryption of the cluster data store | Management nodes |
| Worker Node | kubelet settings, certificate file permissions | Worker nodes |
| Policies | Access permissions (RBAC), network policies, pod security settings | The whole cluster |
The etcd items matter most. etcd holds all the cluster's information, and Secrets are stored there too. If its access control is breached, it is the same as the whole cluster being breached.
Viewing the Check Results
Go to Cluster > CIS Benchmark.
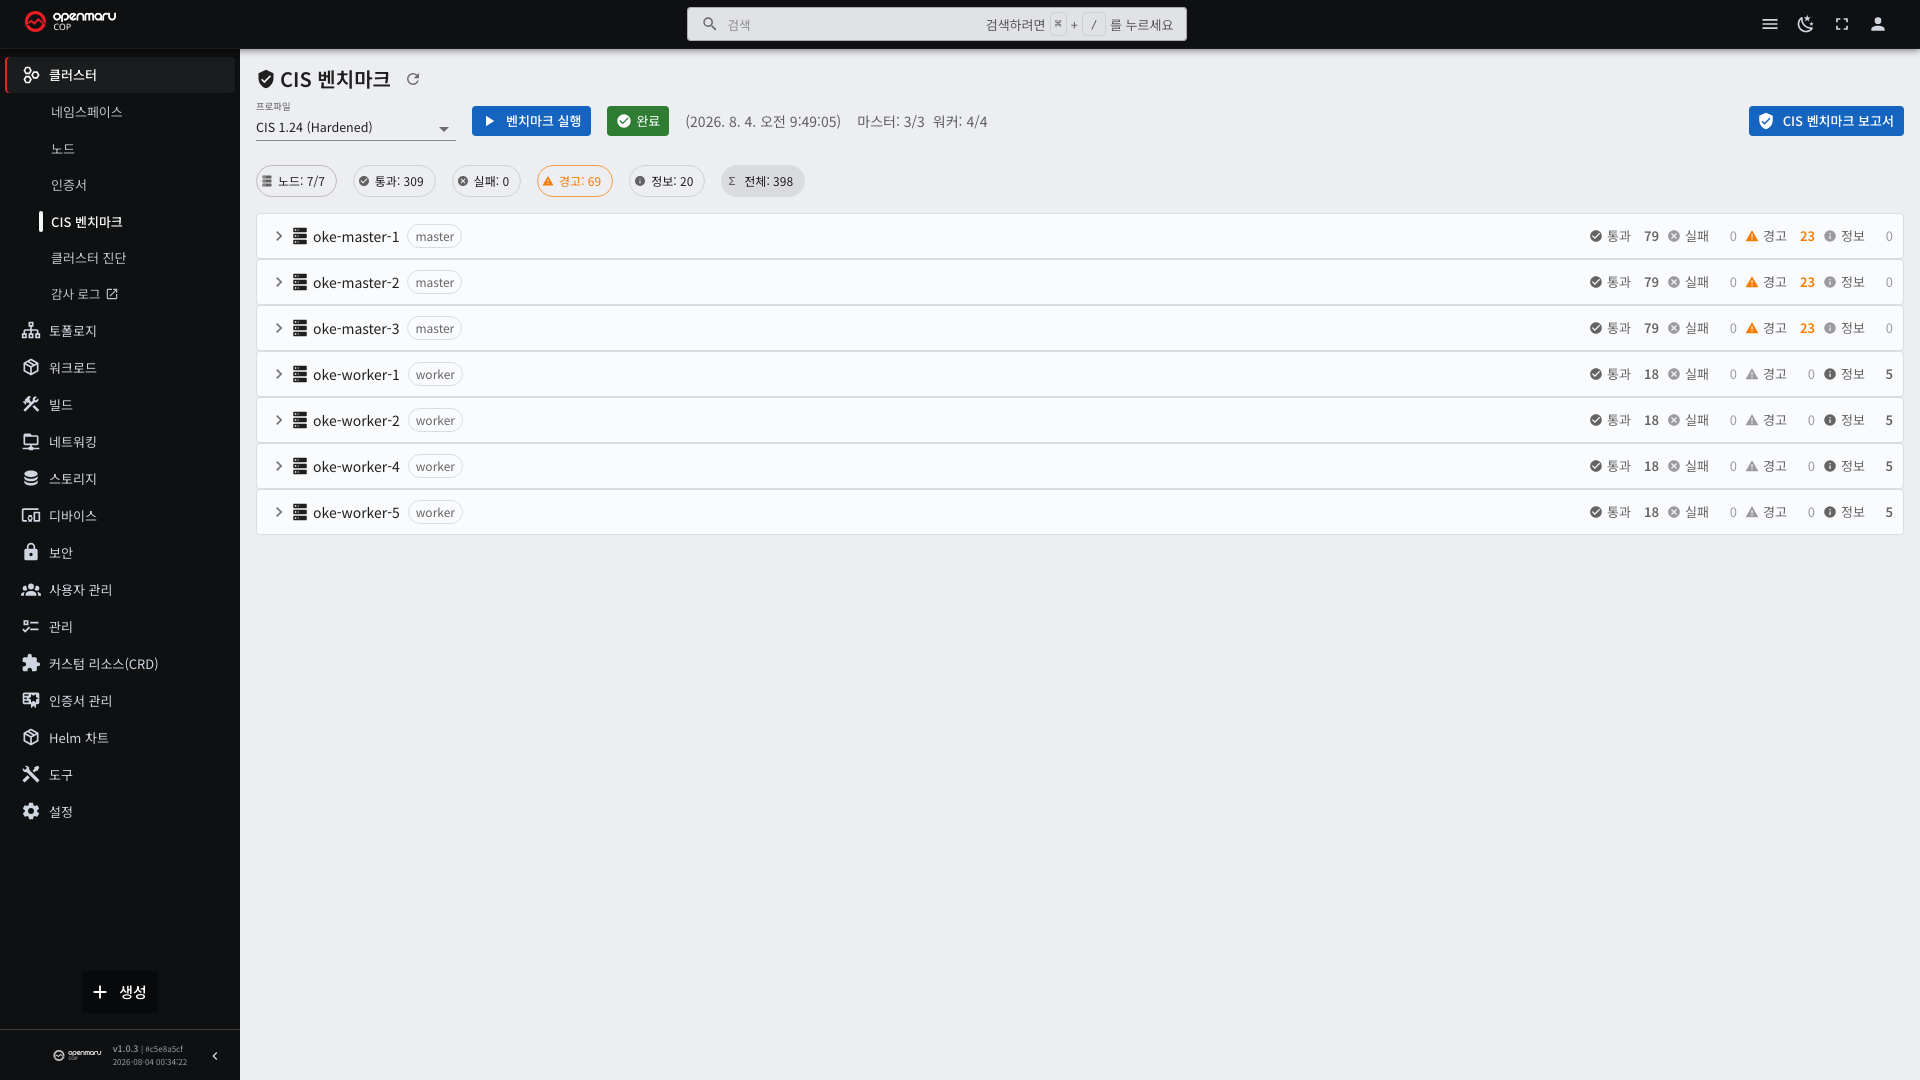
Pass and fail counts appear per target, and selecting an item shows the details.
With several nodes, results appear per node. If the same item passes on one node and fails on another, only that node's configuration differs, so check it first.
Reading Item Statuses
| Status | Meaning | What to do |
|---|---|---|
| PASS | Meets the standard | Nothing |
| FAIL | Does not meet the standard | Consider a remedy |
| WARN | Cannot be determined automatically | A person must check directly |
| INFO | Informational item | Nothing |
Do not skip over WARN. It means the check tool cannot decide, not that things are safe.
WARN usually appears for these reasons.
- Items whose answer depends on organizational policy (for example, "how many days audit logs must be retained")
- Cases where the setting is in a location the tool cannot read
- Items whose judgment requires outside information
How to Read a Single Item
Selecting an item shows the following.
| Element | Example | Use |
|---|---|---|
| Number | 1.2.7 | Use it verbatim in reports |
| Title | "Disable anonymous authentication on the API server" | What was checked |
| Result | FAIL | |
| Remediation | Which value in which configuration file to change, and how | Pass to operations staff |
The number is the unique number of the CIS standard. In audit reports and technical support inquiries, use the number verbatim. Copying the description over makes it unclear which item is meant.
How to Handle FAIL
Most FAIL items require editing cluster configuration files. This work requires connecting to nodes, so operations staff perform it.
When passing it on, give these three things together.
- The item number (for example,
1.2.7) - The item title
- The remediation shown on screen
Changing a setting restarts the corresponding component. Because management node settings can briefly stop the cluster API, schedule a maintenance window for the work. Pods already running continue to operate.
You Do Not Have to Pass Everything
Turning every item into PASS is not the goal.
Some settings cannot be used in production. For example, some items recommend turning a feature off entirely, and if your service needs that feature you cannot turn it off.
| Criterion | Description |
|---|---|
| Your organization's security policy | Start with the items the policy requires |
| Risk level | Prioritize items related to external exposure and privilege escalation |
| Operational impact | Be cautious with changes that stop the service |
Decide which items are in scope, and record why you excluded the ones you excluded. Audits look at the reasoning more than the pass rate. An explanation such as "this item was not applied because feature A is required, and the risk was reduced with B instead" is enough.
Downloading the Report
Expanding items one by one on screen does not make audit material. The full result has to be saved as a file before it can be submitted and archived.
Select CIS benchmark report at the top right of the screen.
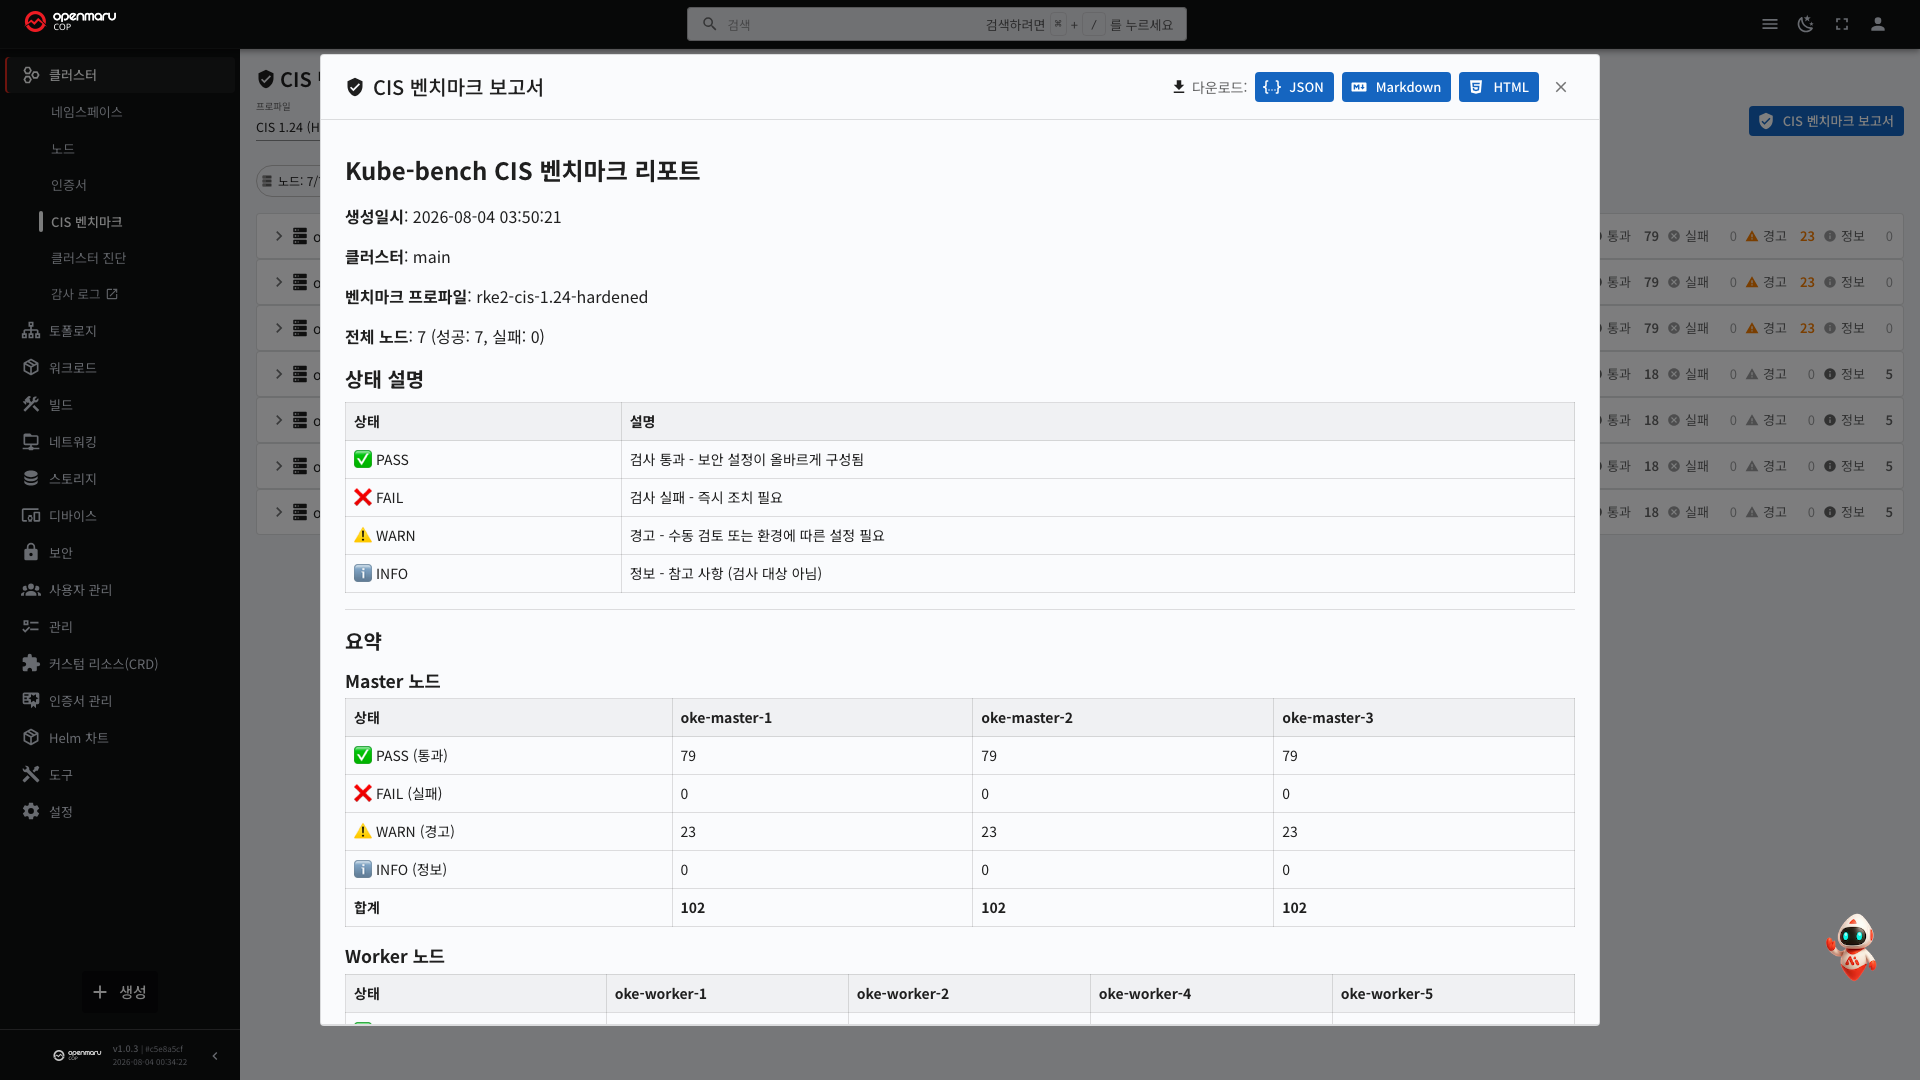
What the Report Contains
Check the content on screen before downloading. It contains the following, in order.
| Part | Content |
|---|---|
| Header | Creation time, cluster name, benchmark profile, total node count and the number of succeeded and failed nodes |
| Status legend | The meaning of PASS, FAIL, WARN, and INFO |
| Summary | A table of status counts per node, divided into Master and Worker nodes |
| Management node results | Items in sections 1, 2, 3, and 5, shown per node |
| Worker node results | Items in section 4, shown per node |
| Remediation | A collection of remedies for the items that did not pass |
| Nodes with collection failures | Shown only when results could not be retrieved from some nodes |
The summary table puts nodes in columns. Whether the same item fails only on certain nodes is visible on a single table. That is faster than expanding nodes one by one on screen.
The report language follows the Console language. If you are working in Korean you get a Korean report; in English, an English one. Switch the language to match your audience before downloading (see 9.4).
Three Formats
Download using the three buttons at the top right of the report window. Each format has a different use.
| Button | File | What it is for |
|---|---|---|
| JSON | kube-bench-results.json | The raw check result. For feeding into another tool or comparing automatically with earlier results |
| Markdown | kube-bench-results.md | For pasting into a document or putting under version control to keep a history |
| HTML | kube-bench-report-<date-time>.html | For opening as is, or printing and turning into a PDF for submission |
HTML is convenient for submission. It comes as a single file with the table formatting intact and opens in a web browser without any separate program. Making a PDF with the browser's print function gives you audit material directly. The HTML file name includes the download time, so repeated downloads do not overwrite each other.
If your purpose is keeping a history, archive the JSON as well. HTML and Markdown are formats for people to read, which makes two points in time hard to compare mechanically. JSON carries the item numbers and statuses as they are, so what changed since the last check can be extracted automatically.
Handling the File With Care
The report contains cluster configuration information. Node names, configuration file paths, the items that did not pass, and their remedies are all included. A list of items that did not pass is useful information to an attacker. When sending it outside, confirm the recipient and the delivery route, and manage it according to your organization's document retention rules.
When to Download
| Point in time | Why |
|---|---|
| Right after running a check | Results are overwritten the next time you run it |
| Before changing a setting | You need the before state on record to tell what changed |
| Before submitting for an audit | The result must be from the time of submission |
| After adding a node or upgrading | Compare against the previous report to find newly appearing items |
Check Frequency
Check again at these points.
| Point in time | Why |
|---|---|
| After first building the cluster | Default settings may remain |
| After adding a node | Only the new node's configuration may differ |
| After upgrading the cluster | Defaults may have changed |
| Before a regular audit | Used as reporting material |
Keeping results by point in time shows what changed and when. You can also collect them together through cluster diagnostics (see 2.3).