3.3. ③ Analysis Prompt Builder — overview
When to use it, and its two modes
This is how you get an answer by calculating over metrics. Instead of showing you values, it produces correlation coefficients, projects what comes next, and finds anomalous windows.
When to use it
| What you want to ask | Method |
|---|---|
| "What is the response time in ms right now?" | Free-form or guided question |
| "Why did it get slow?" | Analysis builder — correlation |
| "When will it hit the limit?" | Analysis builder — forecasting |
| "Is there an unusual window?" | Analysis builder — anomaly detection |
For a single value there is no need to go as far as the builder. Use it when you need the relationship between several metrics or what comes next.
The screen flow

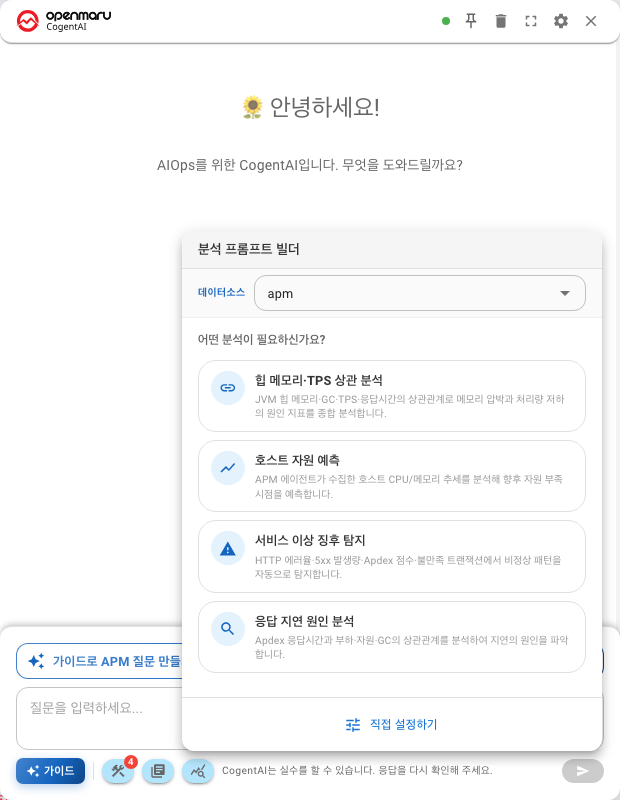
Choose the datasource first
There is a datasource field at the top. What you choose there changes the list below it.
| Value | What you see |
|---|---|
observ | 13 scenarios over Kubernetes and node metrics |
apm | 10 scenarios over WAS and transaction metrics |
Both are available whichever console you opened the widget in. If a scenario from this document is missing, you have usually selected the other datasource (Chapter 401).
Two modes
Wizard mode — guided selections
Pressing a scenario starts it. It asks you for what it needs, one step at a time.
- You do not have to know what to choose
- The metric combination is usually pre-selected as a recommendation
- The number of steps varies by scenario (two or three)
Use this one by default (Chapter 304).
Custom Setup — you choose everything
This is the Custom Setup button at the bottom of the scenario list. You choose the analysis type, target, metrics and time range on a single screen.
- For combinations the prepared scenarios do not cover
- When you want specific metrics
Chapter 305 covers it in detail.
After you send it
The builder writes the question for you and puts it into the conversation. What you asked stays in the history in full, so you can ask the same thing by hand later.
Querying and calculating take time. The stage and the elapsed time are shown.
Know the three families
Scenarios have different names, but there are only three ways they ask.
| Family | What it asks | In detail |
|---|---|---|
| Correlation | Do two metrics move together | Chapter 402 |
| Forecasting | When will it hit the limit | Chapter 403 |
| Anomaly detection | Is there a window that differs from normal | Chapter 404 |
When you do not know the cause, anomaly detection → correlation is a convenient order.
Next
- Choosing step by step — Wizard mode
- Choosing on one screen — Custom Setup mode
- What scenarios exist — Analysis scenarios at a glance