3.4. Wizard mode
Three steps: situation → targets → review
Pressing a scenario starts it. It asks you only for what it needs, one step at a time.
The number of steps varies by scenario
Not every scenario has three steps. You are shown only what that scenario needs.
| Kind of scenario | Steps |
|---|---|
| Nothing to ask about | Targets → Review |
| Several situations | Situation → Targets → Review |
| Correlation analysis | Targets → Metrics |
| Correlation with several situations | Situation → Targets → Metrics |
The top of the screen shows which step you are on out of how many, so it is hard to lose track.
Step 1 — choose the situation
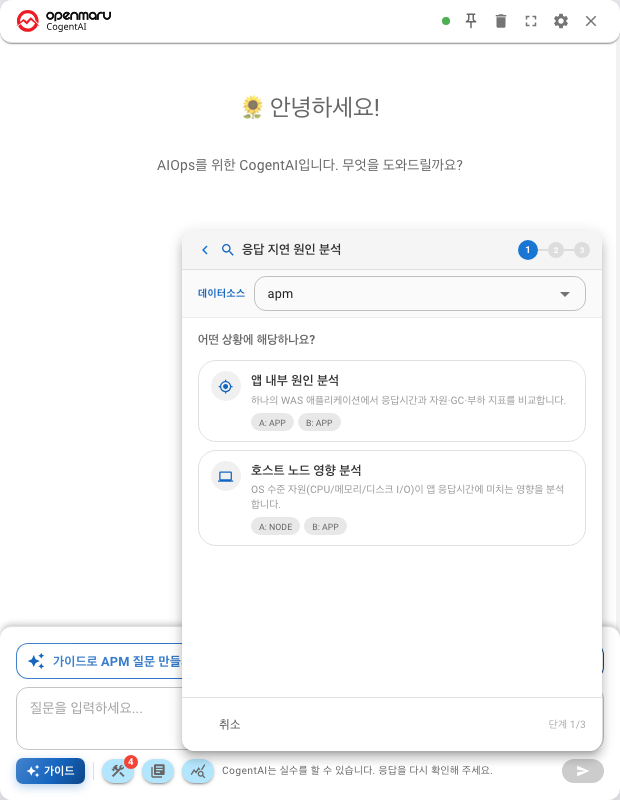
This appears only when a scenario has several variants.
Choosing Response delay cause analysis, for example, asks you this:
- compare within a single application, or
- compare between one application and another
Why it asks
Because what you compare changes which targets you have to choose. Within an application you choose one; between applications you choose two.
Scenarios with only one variant skip this step, because there is nothing to ask.
Step 2 — choose the targets
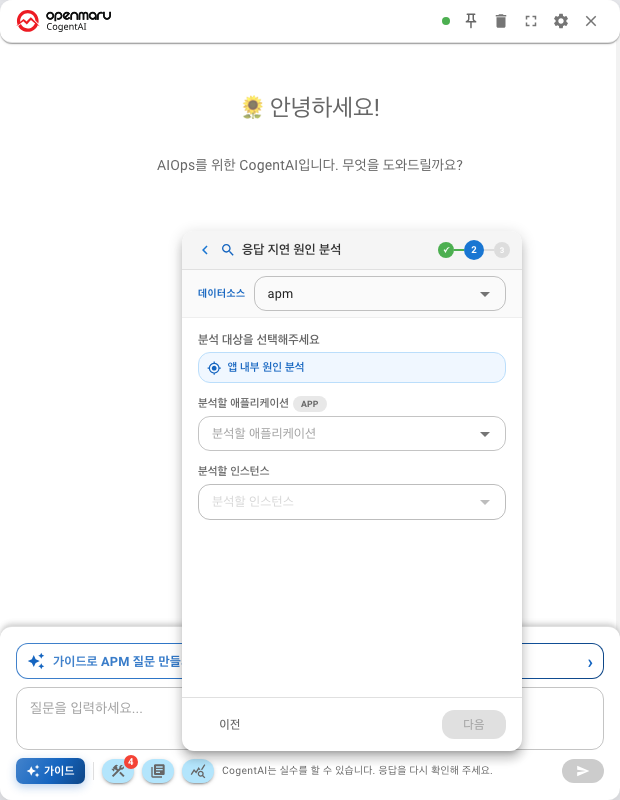
Choose what to analyse.
| Target type | What you choose |
|---|---|
| Application | A service or app. Most scenarios |
| Node | A server or host. Node state forecasting, disk exhaustion forecasting and so on |
If application names are missing in a node scenario, nothing is wrong. The target type is simply different.
Scenarios where you choose two
If you chose "between applications" or "between services" in the situation step, you choose two targets.
Choose the caller first and the callee second. That way the → direction in the result comes out the natural way round.
Time range
You choose this here too.
1 hour · 6 hours · 1 day · 3 days
For forecasting, this window is the entire evidence base. Nothing longer than three days is available (Chapter 403).
Step 3 — metrics, or review
For correlation analysis — choose metrics
Choose which metric combination to look at. A recommended combination is pre-selected, so leaving it as it is works.
Two kinds of arrow are shown in the combinations.
| Notation | Meaning |
|---|---|
A → B | Direction matters — did A move first and B follow |
A ↔ B | Only co-movement — which came first is not asked |
Use → when you are looking for a cause, and ↔ when you want to see whether two metrics move together.
This is the final step of a correlation analysis. You confirm the time range here and start the analysis.
Otherwise — review
Your selections are shown once more. If they are right, the analysis starts.
Going back
The Back button returns you to the previous step. Your selections are kept, so you do not start over.
To change the scenario itself, return to the list.
After you send it
The builder writes the question and puts it into the conversation. Because what is being analysed is stated in words, you can request the same analysis by hand later.
Next
- Choosing everything on one screen — Custom Setup mode
- What scenarios exist — Analysis scenarios at a glance
- Reading the result — Appendix: How to read the results