4.4. Anomaly detection
Is there a window that differs from normal — 6 scenarios
This is the family to start with when you do not know where to look. It examines a metric and finds the windows that differ from normal.
It does not tell you what the problem is. It narrows down where to look.
What it answers
- When — the point that departs from normal
- How much — how far it departed
- In which metric — when several metrics are examined together
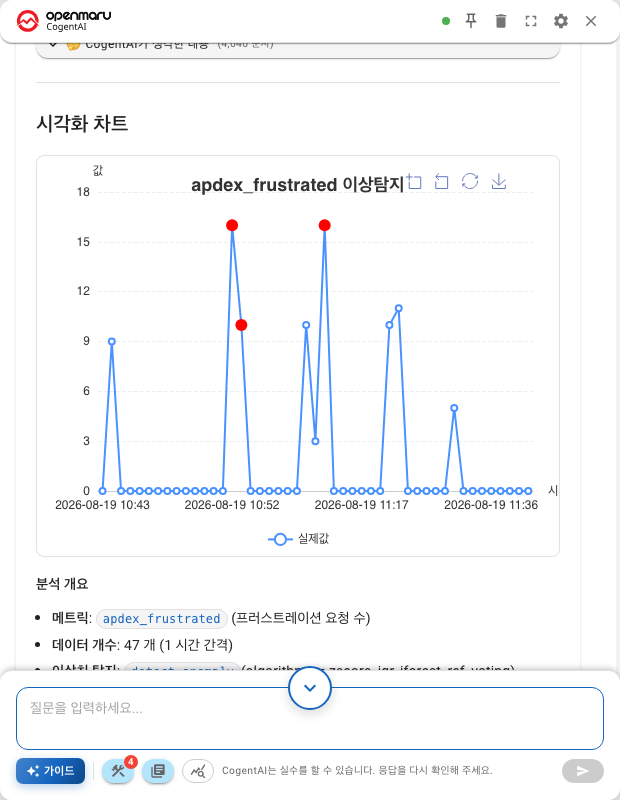
The values are drawn as a connected line and only the points that depart from normal are marked separately. In the figure above, 3 of the 47 values in a one-hour window were flagged as anomalies. The rest are treated as normal and passed over.
"Anomaly" does not mean "fault"
It means different from usual. All of the following are flagged, and none of them is a problem.
- Just after a deployment — restarts and a change in response time
- A scheduled batch — load that only spikes in the early hours
- An event or an announcement — a sudden rush of traffic
First think about what was happening at that time. Look more closely only when nothing comes to mind.
The opposite case exists too. Slow degradation is not caught. If memory fills a little at a time over several days, "normal" rises with it and no departing window appears. For that, predictive analysis is the right tool.
| What you are seeing | The right family |
|---|---|
| It spiked suddenly | Anomaly detection |
| It is filling up gradually | Forecasting |
| You want to know why | Correlation |
The observ datasource — 4 scenarios
| Scenario | Metrics |
|---|---|
| Service Anomaly Detection (container) | HTTP request volume · latency · restart count |
| Service Anomaly Detection (Web/WAS) | Latency · error rate · traffic · JVM heap |
| JVM Memory Analysis (container) | Heap usage · GC time · thread count |
| JVM Memory Analysis (WAS) | Heap usage · active threads |
Tell the two same-named pairs apart by the description. "Container" means the first, "Web server" or "WAS" the second (see Chapter 401).
Below is Service Anomaly Detection.
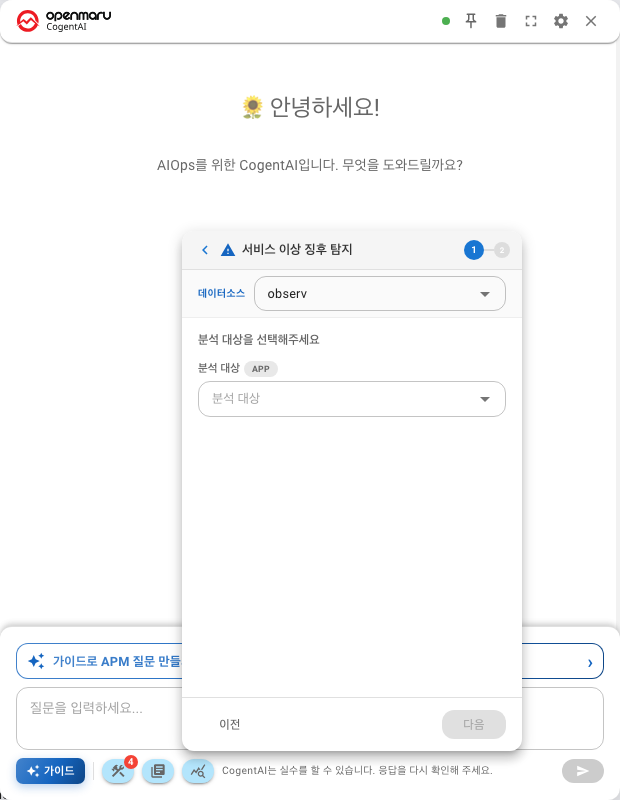
Restart count is one of the metrics
In the container version of Service Anomaly Detection, one of the three metrics is restart count. It is a different kind of thing from the other two: latency is a matter of degree, but a restart is an event.
If a restart is flagged, look at that first. A latency spike may well be a consequence of it.
The apm datasource — 2 scenarios
| Scenario | Metrics |
|---|---|
| Service Anomaly Detection | Error rate · 5xx count · Apdex score · frustrated transactions |
| Thread Pool Anomaly | Blocked · Waiting · Deadlock threads |
What Thread Pool Anomaly points at
The three states mean different things.
| State | Meaning |
|---|---|
| Blocked | Waiting for a lock — contention between threads |
| Waiting | Waiting for someone else — usually a database or external call |
| Deadlock | Waiting for each other, and never resolving |
A lot of Waiting means the cause is outside this application. Deadlock must be investigated even if there is only one. It does not resolve itself.
Two scenarios ask you back
Service Anomaly Detection asks which metric to look at in both datasources.
| Datasource | What you can choose |
|---|---|
apm | Error rate · 5xx count · Apdex score · frustrated transactions |
observ (Web/WAS) | Latency · error rate · traffic · JVM heap usage |
Each metric is a problem in a different direction
| Metric | What is flagged |
|---|---|
| Error rate · 5xx · frustrated transactions | Going up |
| Apdex score | Going down — higher is better |
| Traffic | Both directions |
There is a reason traffic goes both ways. A sudden drop is an anomaly too. It can mean that something upstream is blocked and requests are not getting through. Traffic approaching zero is not calm; it means the inflow has stopped.
Why JVM Memory Analysis is in this family
The two JVM Memory Analysis scenarios in observ belong to anomaly detection. They look for departing windows in heap, GC and threads.
A scenario with the same name exists in apm, but that one is in the Correlation family and covers forecasting and trend as well (see Chapter 402). The name is the same; the work is not.
- JVM Memory Analysis in
observ— is there an unusual window - JVM Memory Analysis in
apm— why, and what happens next
Which to choose when
| What you are seeing | What to choose |
|---|---|
| You do not know where the problem is | Service Anomaly Detection — start here |
| Users say it feels worse | Service Anomaly Detection (apm) → Apdex score |
| Errors are up but you do not know since when | Service Anomaly Detection → error rate |
| The app keeps terminating | Service Anomaly Detection (container) — restarts |
| Responses seem to have stopped | Thread Pool Anomaly (apm) |
| You suspect a memory leak | JVM Memory Analysis |
| Requests dropped suddenly | Service Anomaly Detection (Web/WAS) → traffic |
After you get the result
Anomaly detection gives you a time. From there you go one of two ways.

Finding the metrics that moved during the same window in correlation analysis narrows the candidate causes.
When you do not trust the verdict
The builder has no field for sensitivity. You can ask for it in a free-form question, though.
"Look again, a bit more sensitively" "Cross-check it with several methods"
There is also a mode that measures with several methods and calls something an anomaly only when a set number of them agree. The point is to reduce the misjudgements you get from using only one method. Which methods are involved is covered in Appendix: How anomalies are judged.
Next
- Reading how far it departed — Appendix: How to read the results
- How the verdict is reached — Appendix: How anomalies are judged
- Finding the cause — Correlation analysis
- The other family — Predictive analysis