4.1. Analysis scenarios at a glance
Which analysis to choose — why the list changes, and what to pick
Opening the Analysis Prompt Builder shows you a list of scenarios. This chapter covers why that list changes and what to choose.
First — choose the datasource
There is a datasource selector at the top of the builder. What you choose there changes the scenario list below it.
| Value | Where the data comes from | Scenarios shown |
|---|---|---|
observ | Kubernetes and node metrics collected by OPENMARU Observability | 13 |
apm | WAS and transaction metrics collected by OPENMARU APM | 10 |
Here is the same screen with only the datasource changed. The list is completely different.
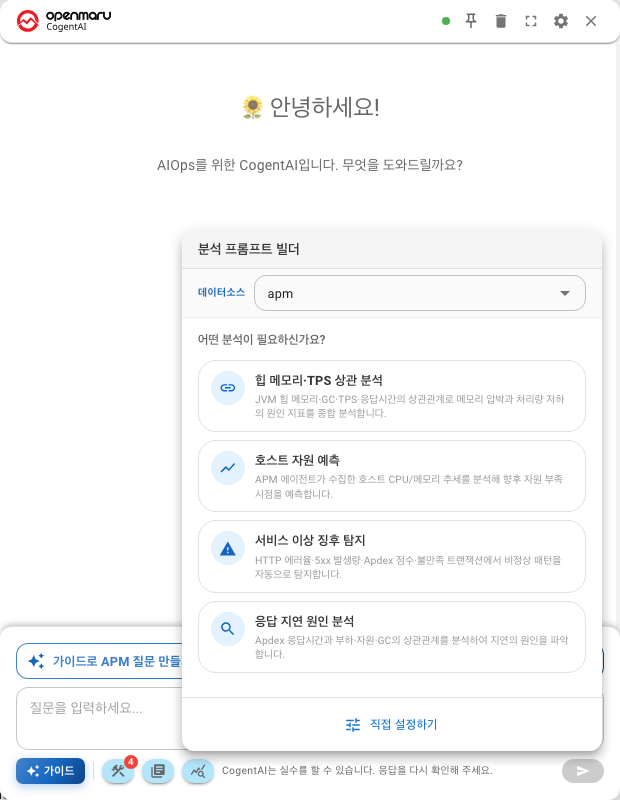
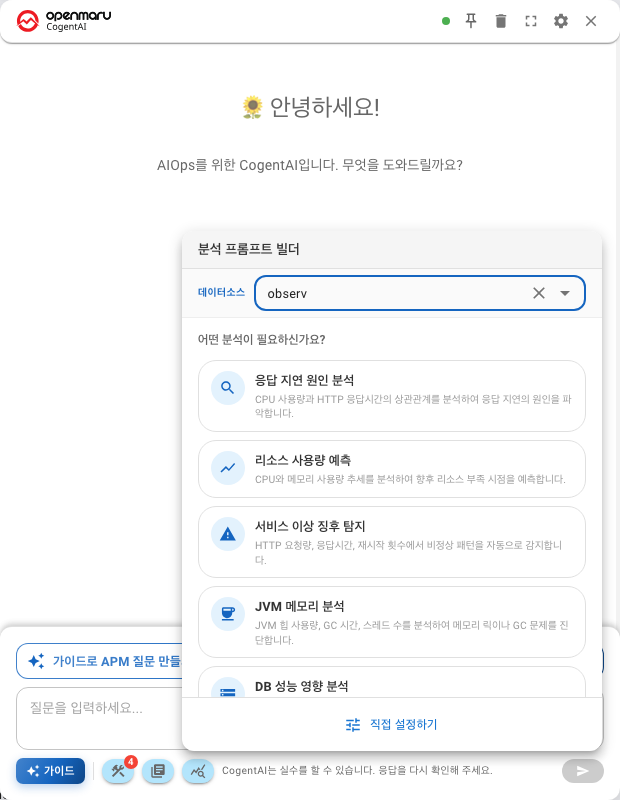
The datasource has nothing to do with the console you opened
Both datasources are available whichever console you open the widget in. The list comes from the server, not from the host page. You can choose observ and apm in COP Console too.
COP Console does not keep a datasource of its own. Choose observ for Kubernetes metrics and apm for WAS metrics.
Both are read through Prometheus.
apmis a Prometheus-compatible endpoint, so the query mechanism is the same. What differs is which metrics are inside:observholds container and node metrics, whileapmholds APM metrics such as Apdex, TPS and SQL response time.
If a scenario from this document is not on your screen, you have usually selected the other datasource. Check the selector at the top first.
Three families — what they ask
Scenarios have different names, but there are only three ways they ask. Once you know this you can guess what an unfamiliar scenario will do.
| Family | What it asks | Shape of the answer | Count |
|---|---|---|---|
| Correlation | Do two metrics move together | Correlation coefficient, lead/lag relationship | 11 |
| Forecasting | At this rate, when will it hit the limit | Future values and a confidence band | 6 |
| Anomaly detection | Is there a window that differs from normal | The time and the degree | 6 |
Which family to choose
Decide by what you want to know.
- "Why did it get slow?" → correlation. It finds the metrics that moved with response time.
- "When do I need to add capacity?" → forecasting. It extends the trend and shows when the limit is reached.
- "Is anything unusual?" → anomaly detection. Use it first when you do not know where to look.
When you do not know the cause, anomaly detection → correlation is a convenient order: find the time with anomaly detection, then look at that window closely with correlation analysis.
The apm datasource — 10 scenarios
These look at the WAS and transaction metrics collected by OPENMARU APM: Apdex, TPS and SQL response time.
| Family | Scenario | Target | What it looks at |
|---|---|---|---|
| Correlation | Heap Memory & TPS Correlation | Application | Heap, GC, TPS and latency together, to see memory pressure |
| Correlation | MSA Failure Propagation Correlation | Application | Traces the latency → error rate propagation path |
| Correlation | JVM Memory Analysis | Application | Heap usage from three angles: forecast, trend and correlation |
| Correlation | Traffic ↔ Error Rate | Application | Whether errors rise as requests rise |
| Correlation | Response Latency Analysis | Application | Apdex latency against load, resources and GC |
| Correlation | DB Performance Impact | Application | Whether SQL response time affects application latency |
| Forecasting | Host Resource Forecast | Node | Host CPU and memory trends collected by the agent |
| Forecasting | App Resource Forecast | Application | Heap and process CPU trends of a WAS instance |
| Anomaly | Service Anomaly Detection | Application | Error rate, 5xx, Apdex, frustrated transactions |
| Anomaly | Thread Pool Anomaly | Application | Blocked, Waiting and Deadlock patterns |
The observ datasource — 13 scenarios
These look at the Kubernetes and node metrics collected by OPENMARU Observability: container CPU and memory, and node disk.
| Family | Scenario | Target | What it looks at |
|---|---|---|---|
| Correlation | Response Latency Analysis (container) | Application | Container CPU against HTTP latency |
| Correlation | Response Latency Analysis (Web/WAS) | Application | Web server latency against load, resources and errors |
| Correlation | DB Performance Impact | Application | DB query count against service latency |
| Correlation | Thread Pool Load Analysis | Application | Active threads against traffic, latency and heap |
| Correlation | Golden Signals Analysis | Application | Latency, traffic, error rate and CPU in one pass |
| Forecasting | Resource Usage Forecast (container) | Application | Container CPU and memory trends |
| Forecasting | Resource Usage Forecast (Web server) | Application | Web server CPU and memory trends |
| Forecasting | Node Status Forecast | Node | Node CPU, memory and load average |
| Forecasting | Disk Usage Forecast | Node | Disk usage → risk of pod eviction |
| Anomaly | Service Anomaly Detection (container) | Application | Request volume, latency, restarts |
| Anomaly | Service Anomaly Detection (Web/WAS) | Application | Latency, error rate, traffic |
| Anomaly | JVM Memory Analysis (container) | Application | Heap, GC time, thread count |
| Anomaly | JVM Memory Analysis (WAS) | Application | Heap and active threads of a WAS instance |
The same name appears twice
Four pairs of scenarios share a name in these lists.
Response Latency Analysis · Resource Usage Forecast · Service Anomaly Detection · JVM Memory Analysis
What differs is the target they look at.
| One of them | The other | |
|---|---|---|
| Looks at | Kubernetes container metrics | Web server / WAS metrics |
| Example | container_cpu_usage | Web server latency, WAS heap |
Tell them apart by the description. Before you pick a scenario from the list, read the one-line description under its name. "Container" means the first kind; "Web server" or "WAS" means the second.
For an app running in a container, choose the first; for a WAS on a virtual machine or physical hardware, choose the second.
Targets fall into two kinds — application and node
Each scenario has a fixed target type.
- Application — a service or app. Most scenarios are of this kind.
- Node — a server or host:
Node Status Forecast,Disk Usage Forecast,Host Resource Forecast.
If you chose a node scenario and see no application names, nothing is wrong. The target is simply different.
Scenarios with an extra step
Some scenarios ask "which situation is this?" once more after you pick them. This is common in correlation analysis.
Choosing Response Latency Analysis, for example, asks you this:
- compare within a single application, or
- compare between one application and another
The reason is that what you compare changes which targets are needed. That question screen is wizard mode, covered in Wizard mode.
Next
- Each family in detail — Correlation analysis · Predictive analysis · Anomaly detection
- What happens after you choose — Wizard mode
- How to read the numbers — Appendix: How to read the results