4.3. Predictive analysis
At this rate, when will it hit the limit — 6 scenarios
This is the family you use to ask "when do I need to add capacity?". It extends the trend so far and shows you what comes next.
Use it for capacity planning, or to decide when to add resources.
What it answers
- Future values — the line that extends the trend
- How confident it is — the confidence band spreading above and below the line
- When the limit is reached at the current rate
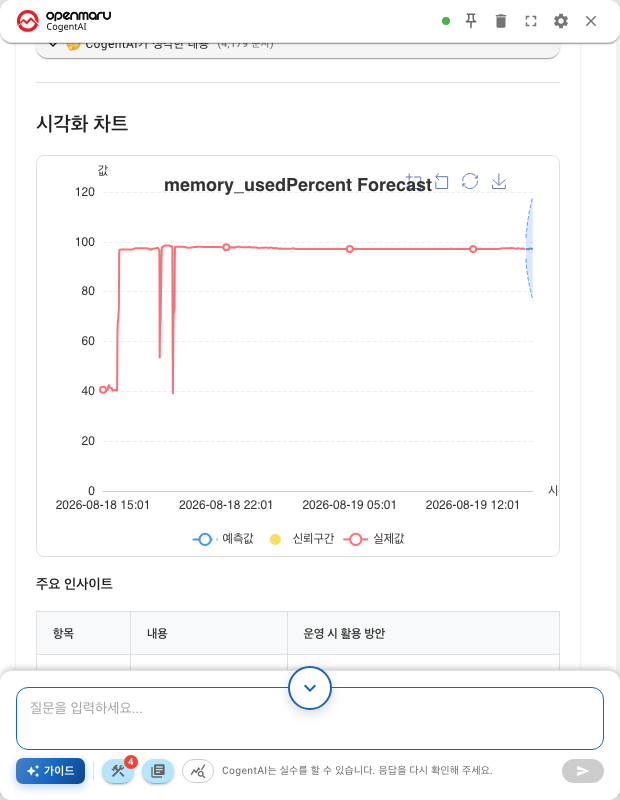
Three series are drawn on one chart. The left is the actual values so far, the right end is the forecast, and the band wrapped around it is the confidence band. The legend underneath tells you which line is which.
A wide band means low confidence. The narrower the band, the more you can rely on it. How to read it is covered in Appendix: How to read the results.
The evidence window is three days at most
A forecast is drawn from the data in the time range you selected, and there are four to choose from.
1 hour · 6 hours · 1 day · 3 days
Nothing longer than three days is available. This is the first constraint to know when reading a forecast.
| What you want to know | Is this the right feature |
|---|---|
| Will the heap fill up tonight | Yes |
| Will it survive this weekend's traffic | Yes |
| How many servers to buy next quarter | No — the evidence is too short |
Using a three-day trend to talk about next month produces numbers with nothing behind them. Long-term capacity planning needs your retained metrics, not this feature.
One more thing. It assumes the trend continues. If something that breaks the trend is scheduled — a deployment, an event, a sudden traffic change — the forecast will be wrong.
The observ datasource — 4 scenarios
| Scenario | Target | Metrics |
|---|---|---|
| Resource Usage Forecast (container) | Application | Container CPU and memory |
| Resource Usage Forecast (Web server) | Application | Web server CPU and memory |
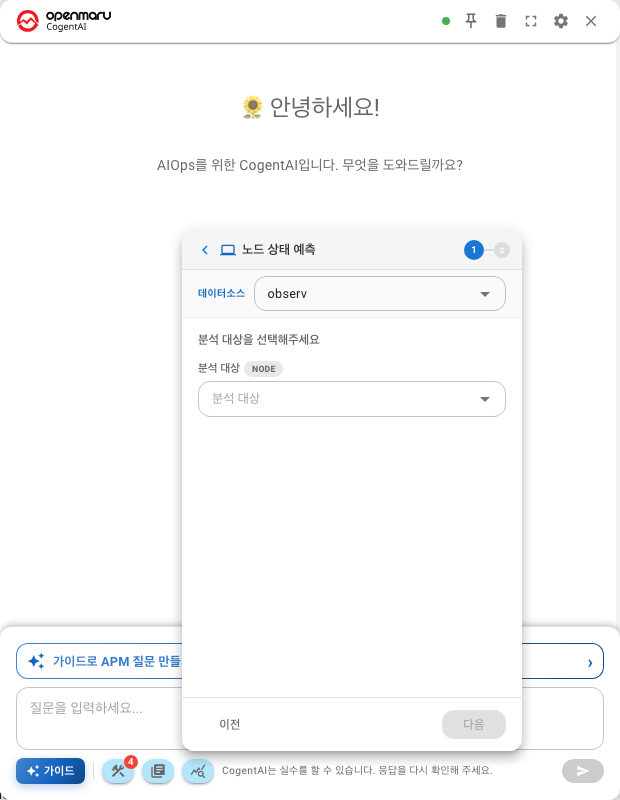
| Node Status Forecast | Node | Node CPU, memory and load average |
| Disk Usage Forecast | Node | Disk usage |
Tell the two Resource Usage Forecast scenarios apart by the description. "Container" means the first, "Web server" the second (see Chapter 401).
Below is Node Status Forecast. Its target is a node, so you choose a node rather than an application.
Why Disk Usage Forecast is different
Of the four, only this one turns directly into a risk. When a node's disk fills up, Kubernetes evicts pods. Unlike running short of a resource and getting slower, the service stops.
Unlike CPU and memory, disk usage does not come back down on its own, so once the trend line points upwards it usually keeps going. This is the scenario whose forecast is most likely to be right.
The apm datasource — 2 scenarios
Both apm scenarios ask once more what to forecast after you pick them.
| Scenario | Target | What it asks |
|---|---|---|
| Host Resource Forecast | Node | CPU Forecast · Memory Forecast |
| App Resource Forecast | Application | JVM Heap Usage Forecast · Process CPU Forecast |
The observ scenarios look at CPU and memory together; the apm ones look at them one at a time. To see both, you ask twice.
Which one to choose
- Host Resource Forecast — whether the server hardware is running short. Everything running on it is counted together
- App Resource Forecast — whether a single WAS instance is running short
With several WAS instances on one server, you can end up in a situation where the app has room but the host does not. Look at the host in that case.
Forecasting appears in scenarios outside the forecasting family
Scenarios in the Forecasting family are not the only ones that forecast.
JVM Memory Analysis in apm belongs to the Correlation family, yet its options include
Heap Forecast and Heap Trend Analysis — because heap only makes sense when all three angles are seen together.
If heap is your concern, choosing JVM Memory Analysis is better than App Resource Forecast from the forecasting family. It gives you forecast, trend and correlation in one go.
Which to choose when
| What you are seeing | What to choose |
|---|---|
| The disk is filling up | Disk Usage Forecast (observ) |
| Do I need more nodes | Node Status Forecast (observ) |
| You are tuning container resource requests | Resource Usage Forecast (container) |
| Will the server hardware hold | Host Resource Forecast (apm) |
| The heap keeps filling | JVM Memory Analysis (apm) — forecast, trend and correlation together |
| You are worried about one WAS instance's CPU | App Resource Forecast → Process CPU Forecast |
After you get the result
A forecast tells you when, not why.
The heap reaches 90% in six hours → why it is filling is a separate question
To find the cause, move to correlation analysis. Fixing the time with a forecast and then narrowing down what affects that metric with correlation is a convenient order.
Next
- Reading the band and the numbers — Appendix: How to read the results
- How it is calculated — Appendix: How forecasts are calculated
- Finding the cause — Correlation analysis
- The other family — Anomaly detection