6.1. In OPENMARU APM
Asking around WAS and transactions — AI buttons all over the screen
In APM, look for a button before you start typing. There are AI buttons all over the screen, and pressing one hands over exactly what you were looking at.
You do not have to retype anything, and which application and which instance it is goes across automatically as well.
The entry points at a glance
| Where | Button | What is handed over |
|---|---|---|
| Top of the screen | CogentAI diagnosis | The whole dashboard you are looking at |
| Chart widget | AI button | That chart's data and its picture |
| T-Map | AI button + status dot | The response time distribution |
| Transaction detail | AI button | The transaction summary and its detail |
| Thread dump | AI button | The active thread list and deadlocks |
| Database spans in the waterfall | SQL → AI query diagnosis | The query as executed |
| Event list | AI button | The event, its root-cause event and the graph |
SQL alone is covered separately in Chapter 502. The rest are below.
1. CogentAI diagnosis — the whole screen at once
This is the button in the toolbar at the top of the screen. It diagnoses the entire dashboard you are looking at.
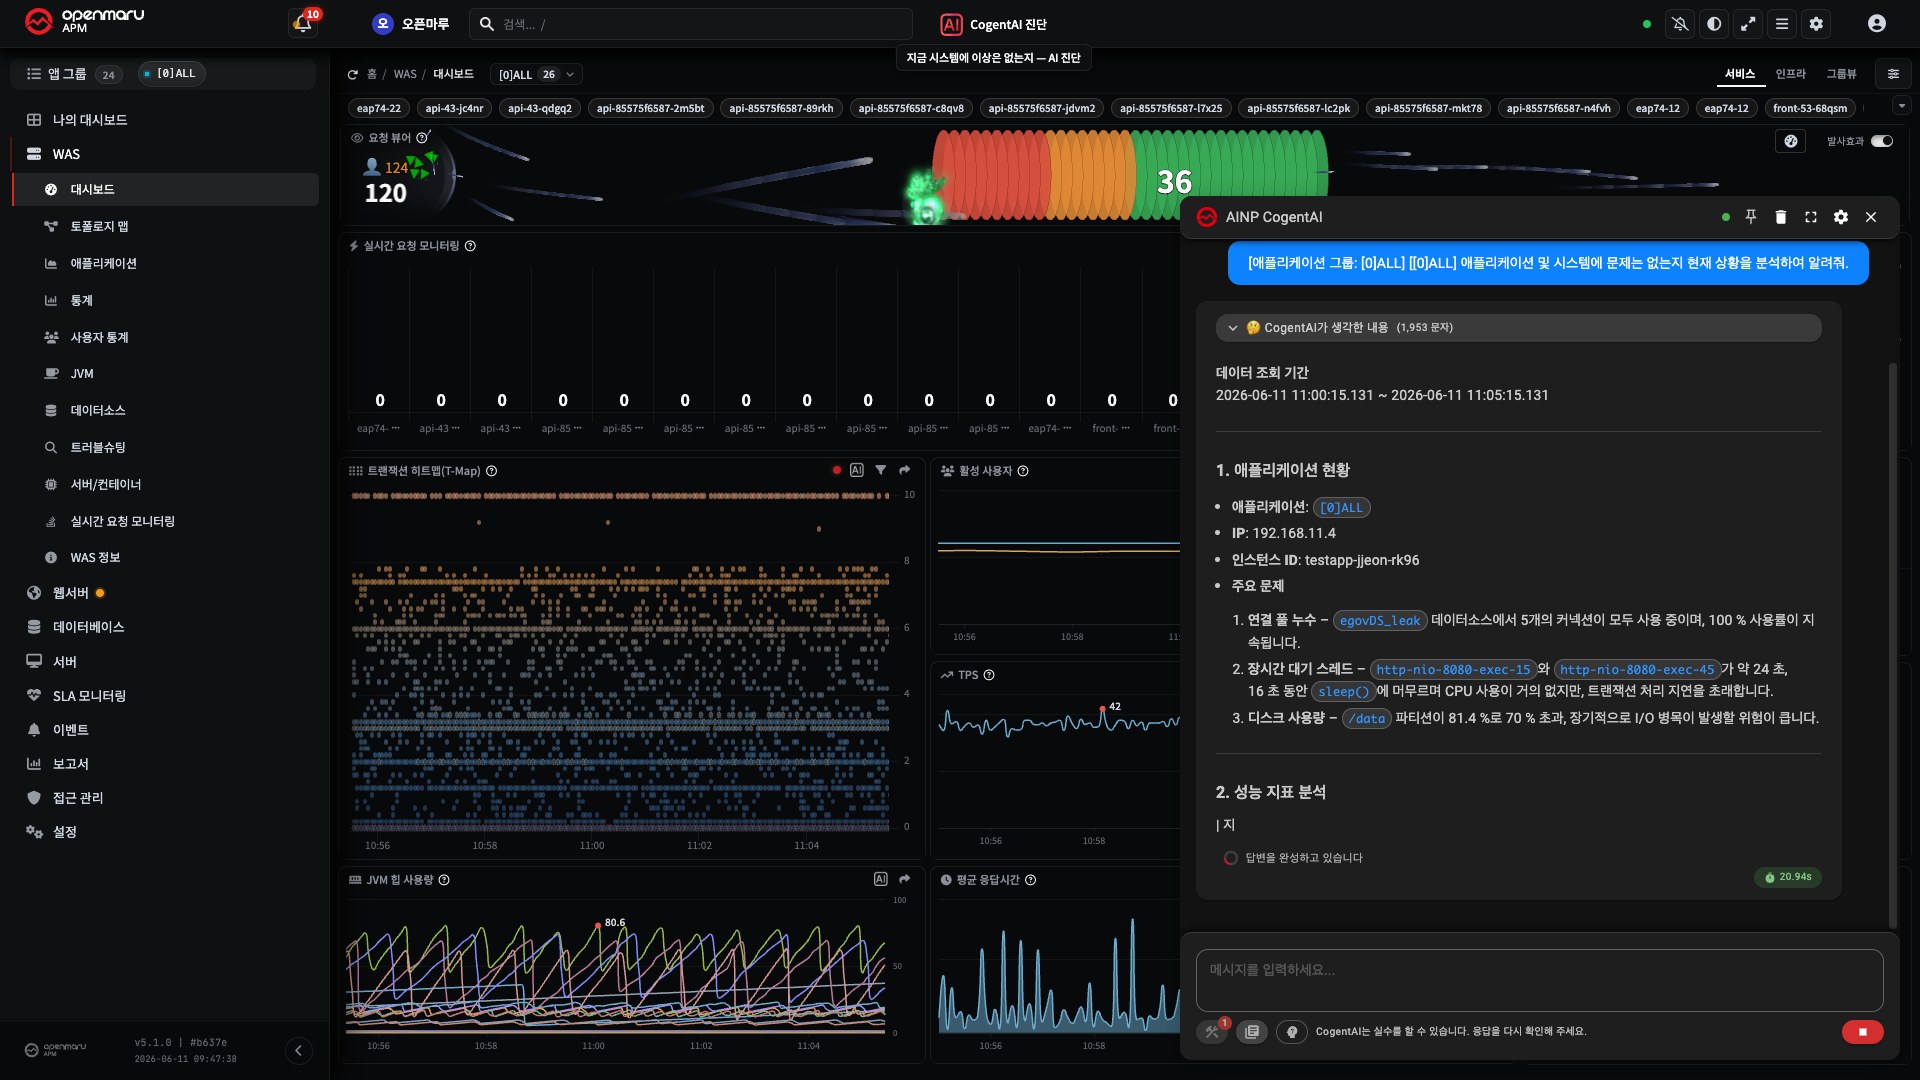
There is something unusual about it. It captures the screen as an image and sends that too. It answers from how the charts look, not just from the numbers.
Start here when you do not know what to look at first. Having the odd spots pointed out across the whole screen is faster than pressing charts one by one.
Pressing it on My Dashboard
Different widgets may target different applications, so it collects the groups the widgets on screen belong to and sends those. It goes by the screen, whatever you selected in the left menu.
Pressing it outside the WAS dashboard
It first moves to the WAS dashboard, waits for the charts to finish drawing, and then captures. Wait a moment if the answer does not come immediately.
The diagnosis proceeds even if the capture fails. It answers from the numbers alone, without the image.
2. The chart AI button — this chart only
This sits at the top right of a chart widget. Pressing it is the same as asking this.
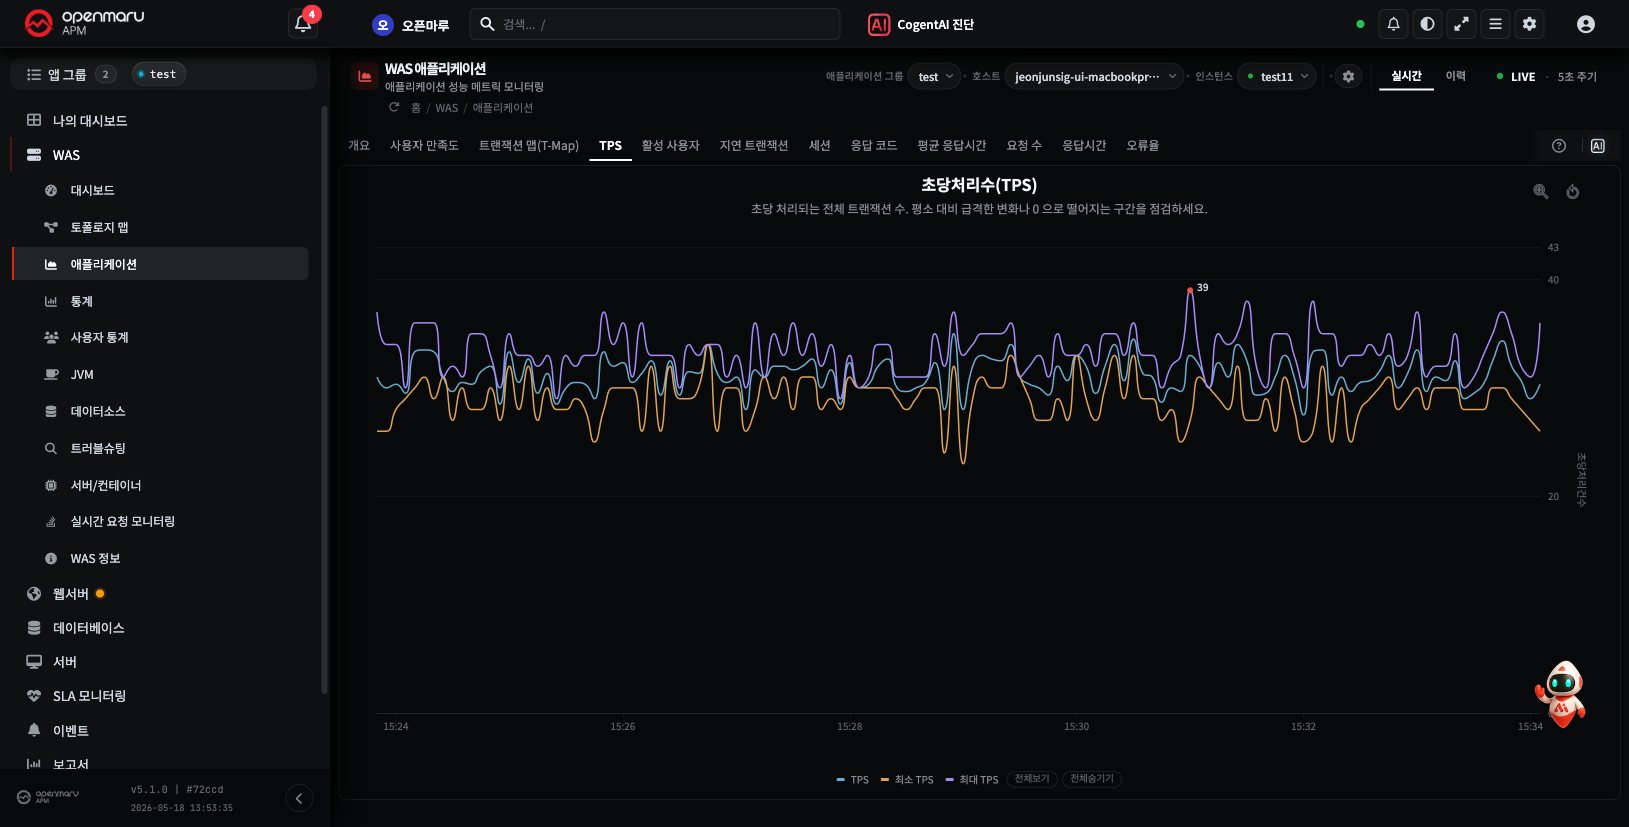
"Analyse the information in the
<chart title>chart and tell me about it"
Three things go across.
- The values drawn in the chart — arranged as a table
- The picture of the chart — as you see it
- The subject — which application group, host or instance
Different instructions go with different charts
A CPU chart and a heap chart need different things looked at, so guidance specific to the chart type is handed over with it: WAS response time, Apdex, TPS, GC and connection pools; system CPU, disk and network; Web servers; and MySQL statistics are all distinguished.
That is why pressing the button produces a more accurate answer than asking about the same values yourself.
You can change the time range before pressing
The window you are viewing in the chart goes across as it is. Move to the time the problem occurred, then press.
3. T-Map
This is the response time distribution chart. It has a status dot alongside the AI button.
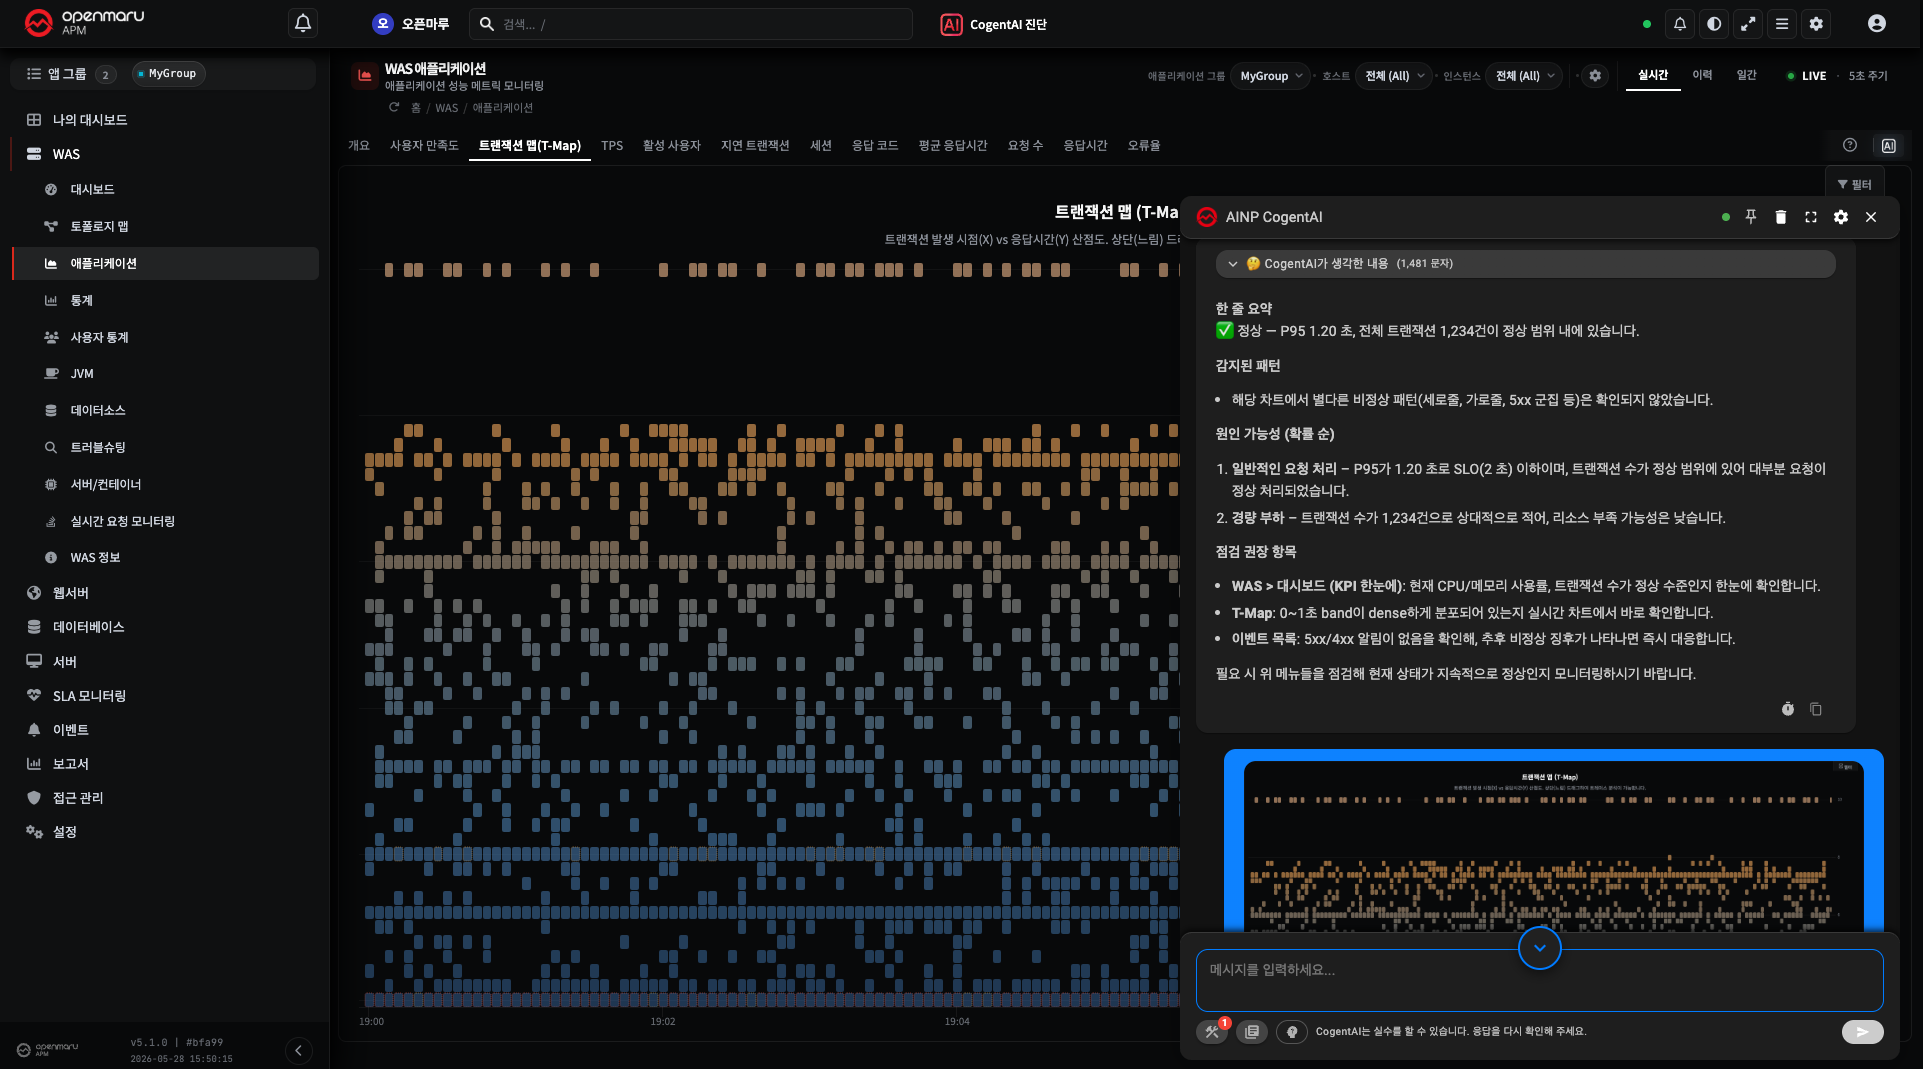
Hovering over the dot shows a summary of the current state. It is there to check first, before you press the button and ask.
4. Transaction detail
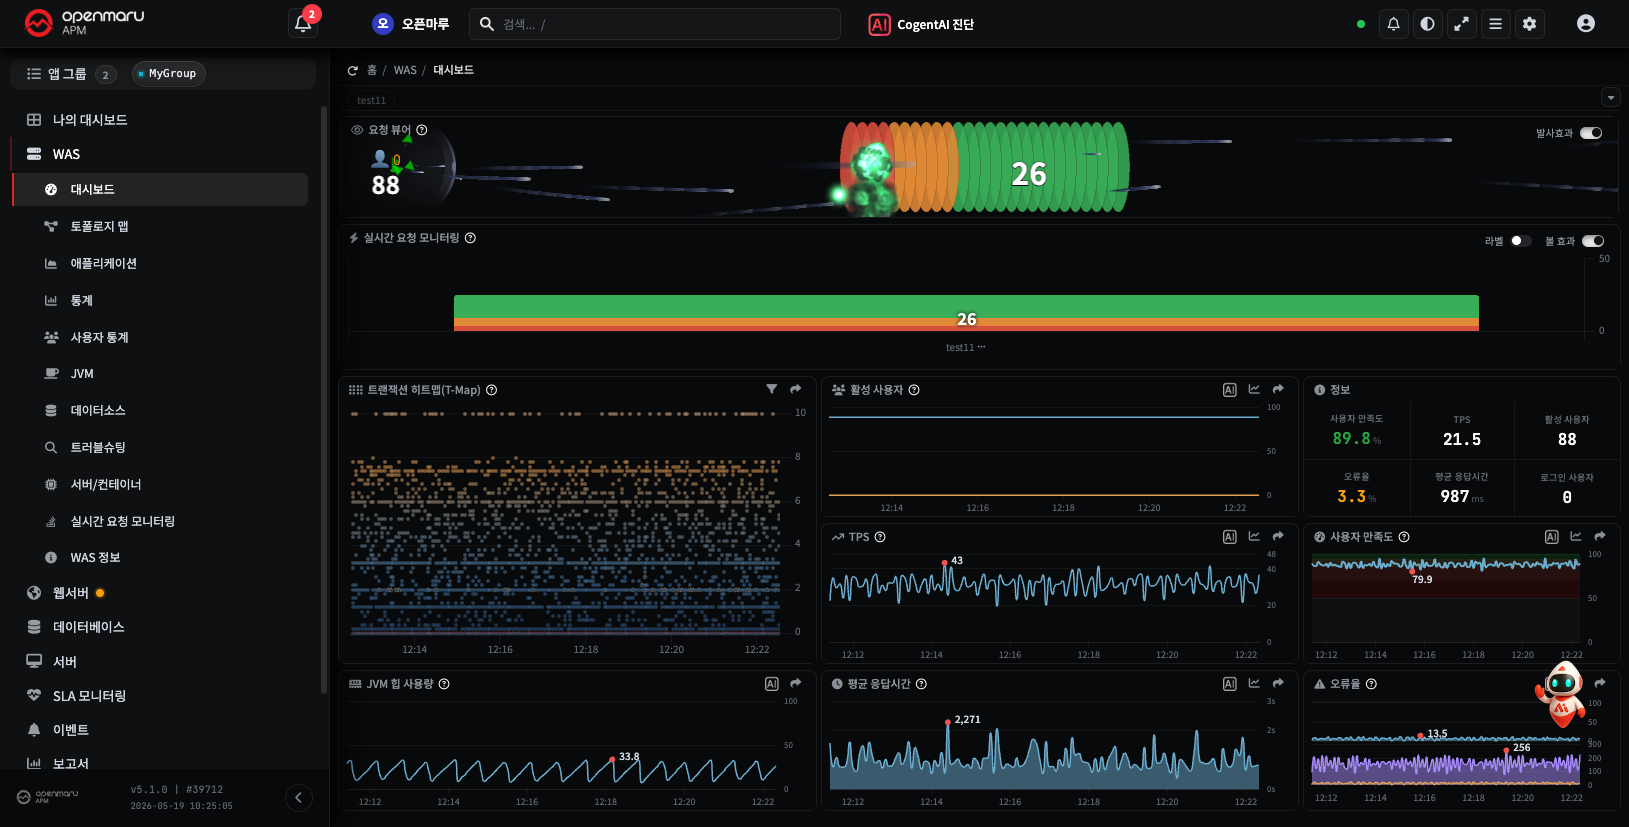
Open one slow transaction and press the button. The summary and the detail go across together.
Once you have narrowed down which SQL statement is the problem, the next step is the SQL button on that span (Chapter 502).
Very long transactions are truncated
When the detail is too long, only the beginning is sent. For a transaction with thousands of spans, read the answer knowing that the later part may be missing.
5. Thread dumps
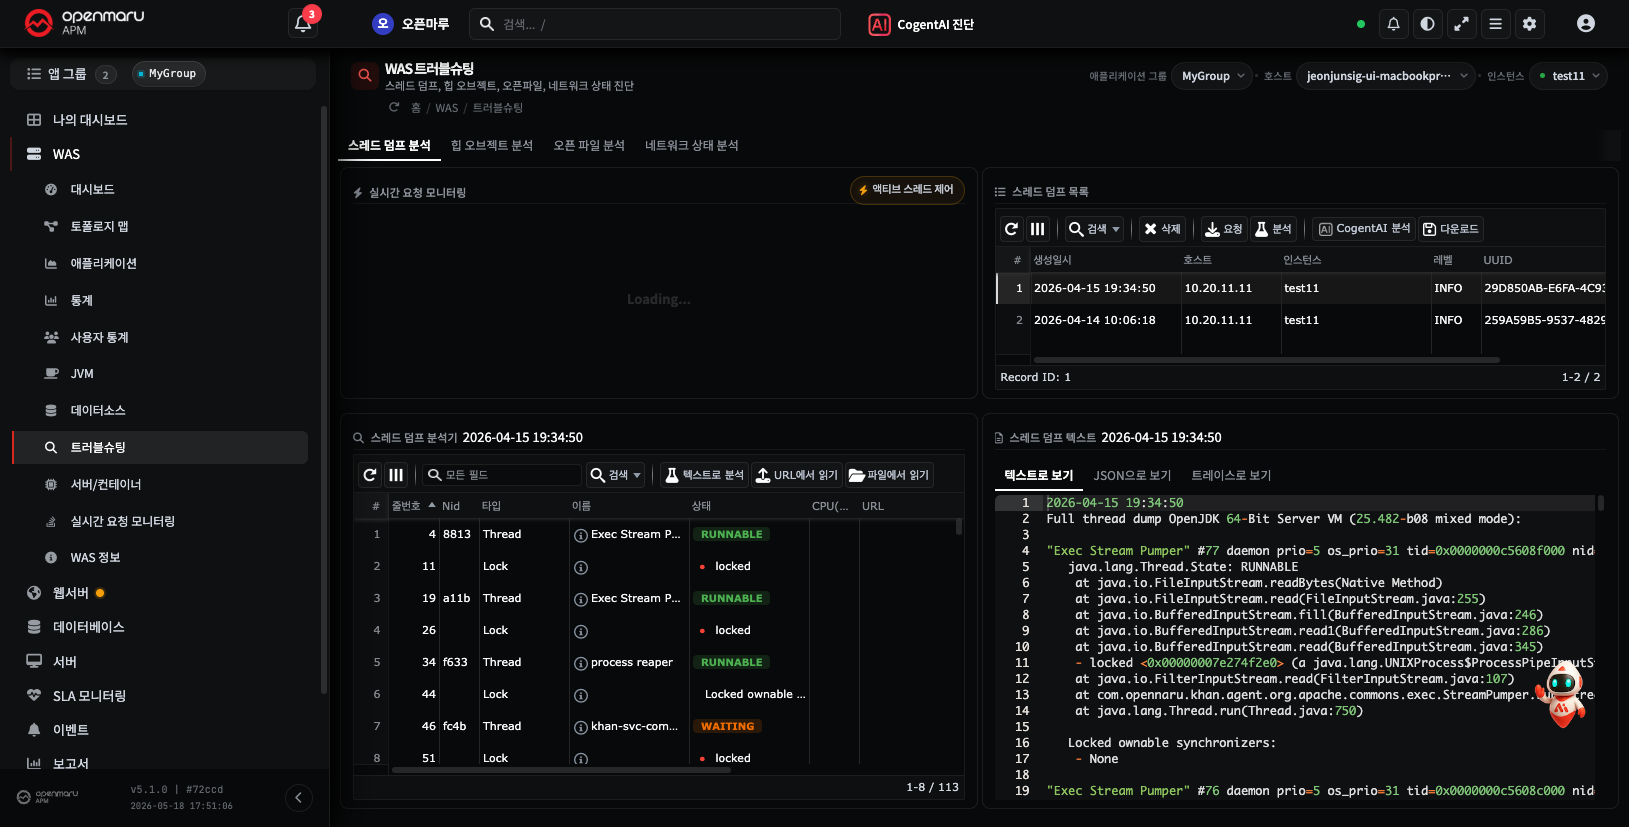
This analyses a dump you have already taken. The question is composed like this.
"Analyse the thread dump for
<group><instance>@<host>[<IP>]"
More than the raw dump goes across.
- The active thread list — what each one is doing
- Deadlocks — flagged separately when present
Use it when responses seem to have stopped. Because deadlocks go across with it, it points them out immediately if there are any.
6. Event list
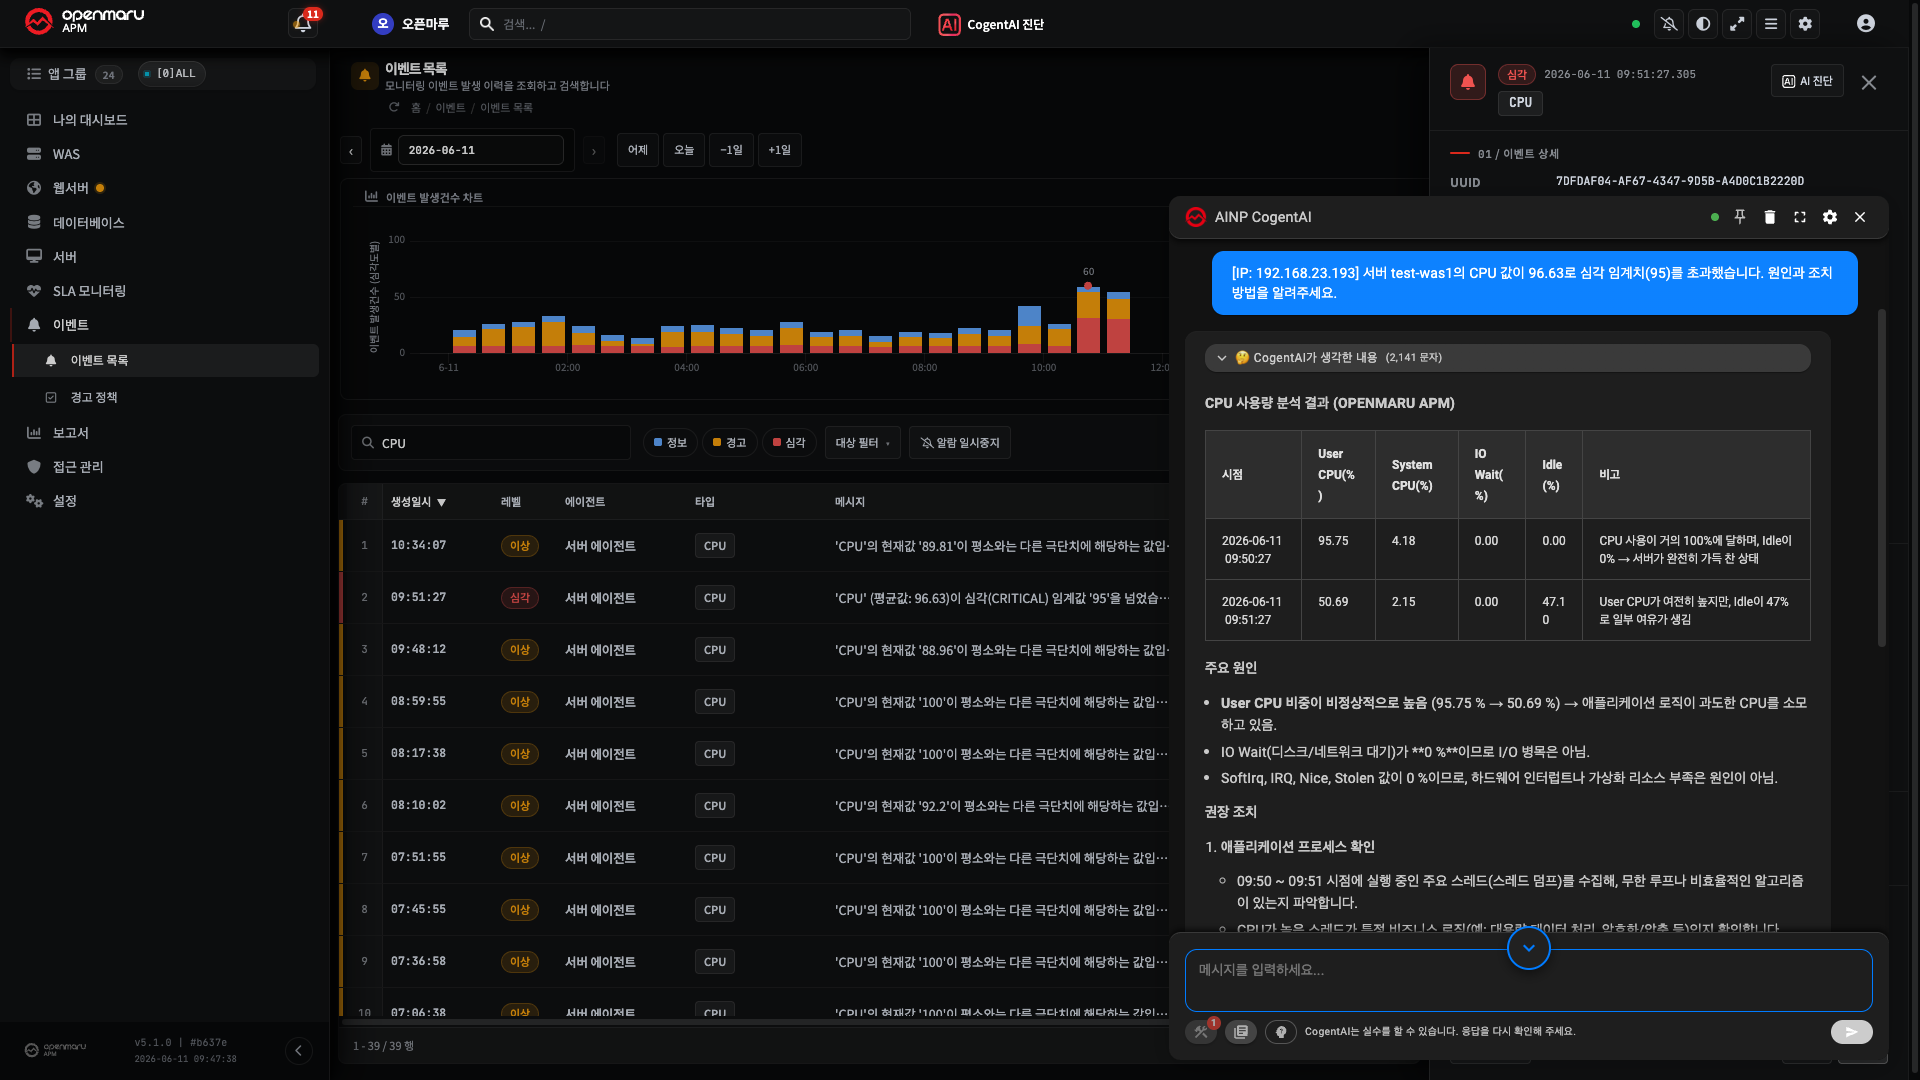
Ask directly from an event that occurred. More than that one event goes across: the event identified as the root cause and the related graph go with it.
Use it as the first step in working out what happened when you arrive from an alert.
What every button hands over
The subject goes across automatically
You do not have to write the application group, host IP or instance. The button takes them from where it sits.
Names appear exactly as they do on screen
If aliases have been set for instances or groups, the question uses the alias too, so the names on screen and in the conversation match.
The original name goes across as well, so the answer still makes sense if you ask about it.
Personal data is masked before sending
The following are masked automatically when a transaction detail is sent.
| What is masked | Shown as |
|---|---|
| Resident registration number | [RRN_MASKED] |
| Phone number | [PHONE_MASKED] |
| Card number | [CARD_MASKED] |
| Account number | [ACCOUNT_MASKED] |
Only correctly formatted values are masked. Numbers written without hyphens, and email addresses, are not masked. Keep that in mind on screens that handle production data.
Asking with a free-form question
For anything without a button, open the widget and type. In that case you have to name the subject, because the screen context does not go across as it does with a button.
"How was
<app name>'s response time yesterday afternoon?"
To look at metrics from several angles, the Analysis Prompt Builder is the better option. The apm datasource has ten scenarios ready (Chapter 401).
When the buttons are not there
One of two reasons.
- The CogentAI integration is switched off in the APM settings — an administrator has to turn it on
- Your account does not have permission — availability is set per account
It is not something you can turn on from the screen, so contact your administrator.
If pressing it gives you "The AI widget is not ready yet", you pressed before the widget had finished loading. Wait a moment and press again.
Next
- SQL diagnosis — Diagnosing SQL straight from APM
- Choosing a metric analysis — Analysis scenarios at a glance
- The other consoles — In COP Console · In Observability